Thermodynamics and structure behavior of a confined binary mixture
by Reactive Monte Carlo simulations
H. Dom´ınguez
Instituto de Investigaciones en Materiales, Universidad Nacional Aut´onoma de M´exico, M´exico, D.F. 04510
e-mail: [email protected]
Recibido el 2 de marzo de 2012; aceptado el 1 de junio de 2012
Adsorption and structure of a confined binary mixture is investigated with Reactive Monte Carlo (RxMC) simulations. This method allowed us to study thermodynamics of the system at different temperatures and at different pore sizes at chemical equilibrium imposed by the reaction AB. In particular studies of equilibrium composition as a function of particle interactions between particles of the same specie and cross interactions between particles of different species were investigated . As a pore model it was used the slit-like geometry where it was observed that at very narrow pores the particle composition departed from that in the bulk. The results also showed that the creation of particles was determined not only by the strength of the particle-particle interactions but also by the wall-particle interactions. In fact, it was possible to enhance creation of a specific specie in the mixture by changing the affinity of the walls to that particular specie.
Keywords: Confined mixture; Reactive Monte Carlo; particle interactions.
La adsorci´on y la estructura una mezcla binaria confinada fue investigada mediante simulaciones de Monte Carlo Reactivo. Este m´etodo nos permitio hacer estudios de la termodin´amica del sistema a diferentes temperaturas en diferentes tama ˜nos de poro en equilibrio qu´ımico determinado por la reacci´on AB. En particular estudios de composiciones en equilibrio fueron investigadas como funci ´on de la interacci´on entre part´ıculas de la misma especie y de diferentes especies. El modelo de poro que se uso consistio de dos placas paralelas y se observ ´o que para poros muy angostos la composici ´on de part´ıculas se alejaba de los datos en el bulto. Los resultados tambi´en mostraron que la creaci´on de part´ıculas estuvo determinada no solo por la interacci ´on part´ıcula-part´ıcula si no tambi´en por interacci´on pared-part´ıcula. Finalmente, se observo que la creac´on de part´ıculas se puede incrementar haciendo que las paredes favorescan mas la interacci ´on con ciertas part´ıculas del sistema.
Descriptores: Mezcla confinada; Monte Carlo Reactivo; interacciones de part´ıculas.
PACS: 61.20.Ja; 61.30.Hn; 68.08.De
1.
Introduction
Nowadays it is well known that when fluids are confined in narrow pores their properties are modified from those in bulk. The new wall-fuid interactions can alter not only the struc-ture and dynamic properties of the fluids but also can have significant influence on the fluids phase behavior. In fact sev-eral studies have been carried out from experimental [1–4], theoretical [5–7] and computational [8–13] point of view to study these phenomena. In particular computer simulations have proved to be a powerful tool to investigate such systems, where people have used Molecular dynamics [14, 15] and Monte Carlo [13, 16] techniques to investigate not only one component fluids [13, 17] but also mixtures [8–11]. In fact, different Monte Carlo ensambles have been used, NVT, NPT andµ VT to study bulk and confined fluids, however, few years ago the Reactive Monte Carlo (RxMC) appeared [18] as a different approach to study systems where chemical reac-tions were involved. For confined fluids just few works have adreseed the problem with this RxMC method [18–22]. For instance people have used RxMC to study the 2NO(NO)2
reaction in slit pores [20] whereas other authors have [19] conducted studies to investigate dimerization under confine-ment using the RxMC methodology. For recent good reviews of RxMC simulations, in bulk and in confinement, the reader can see references [23, 24].
It is commun to use Gran Canonical or Semi Gran canon-ical Monte Carlo simulations in slit pores systems, however, it is necessary to know the equilibrium chemical potential as input which some times it is not an available informa-tion. On the other hand, these ensambles present problems to conduct simulations at high densities. Therefore in the present simulations we use RxMC, firstly because even when the chemical potencial is unknown the system finds its natu-ral chemical equilibrium, i.e. we conduct simulations of the chemical reaction directly. On the other hand we will still ex-plore the benefits of using RxMC in confined fluids, i.e. we study a binary mixture composed of “A” and “B” particles confined in a slit-pore, however, we focused on the effects of the cross interaction between the different particles with symmetric and antisymmetric walls on the behavior of con-fined mixtures since not much work have been carried out in this direction.
2.
Computational Method and Model
The binary mixture of “A”and “B” particles was prepared by conducting the chemical reaction AB. It is important to mention that this is not a straightforward chemical reaction observed in nature, however, this simple model allowed us to prepare the binary system at equilibrium composition. More
over, the advantage of using this model is that we studied ad-sorption of particles at conditions where the system reached its chemical equilibrium.
Then, simulations for the AB chemical reaction con-fined in a slit pore were conducted using the Reactive Monte Carlo method in the NPT ensemble [25], however, the pres-sure was imposed only in the X-Y directions so the separation between the two walls was always constant.
The initial configuration was started from a random num-ber of “A” and “B” particles located in a simulation box. Then, all particles were confined by two parallel walls sep-arated by a distance H and the simulations started.
We do not intent to give explicit details of the RxMC (the reader can see e.g. references [18] for full details) and we only show the principal steps of the method for our simula-tions.
1. A random particle is chosen from “A” or “B” particles and a change in position is attempted with the standard MC probability [25].
2. A random change in the X-Y area is attempted to keep constant pressure an it is accepted with the usual MC probability [25].
3. A forward reaction step is attempted, i.e. a random par-ticle “A” is chosen and it is changed to a “B” parpar-ticle. Then, the move is accepted with probability of min[1, Pr→s].
4. A reverse reaction step is attempted, i.e. a particle “B” is chosen at random and it is changed to an “A” par-ticle. Then, the move is accepted with probability of min[1, Ps→r].
Here, the transition probability for a reaction in the direc-tionr→sis given by:
Pr→s= exp(−βδUrs) C Y i=1 qC i C Y i=1 Ni! [Ni+νi]! (1)
βδUrsis the energy change from state r to s, qi is the par-tition function,Ni is the number of particles of typei,ν is the stoichiometric coefficient and C is the number of com-ponents [18]. The transition probability for a reaction in the reverse direction (s→r) can generated by replacingνiby -νi All particle-particle interactions were given by the Lennard-Jones potential with equal particle diameters for both species. u(rij) = 4²ij ·³σ ij r ´12 −³σij r ´6¸ (2) withσij and²ij the Lennard Jones parameters and the index
i, jreferred to “A” or “B” particles. For the slit pore continu-ous planar walls were used where the particle-wall interaction was given by a 9-3 potential,
uw(r) =²w · 2 45 ³σ wm r ´9 −1 3 ³σ wm r ´3¸ (3)
with ²w = 2π²wmσwm3 ρw, ρw is the wall density. The subindexm refers to the “A” or “B” specie. For the simu-lations we usedσwA=σwB = 0.9934σar andρwσ3ar= 4.5,
σarand²arare the argon parameters so that the values were chosen to mimic a fluid of argon in graphite walls.
Then, three pore widths were investigated, H = 10σAA, 5σAAand 3σAA with a total of 1000, 800 and 600 particles respectively, using periodic boundary conditions as usual in the X-Y directions only. Finally, simulations were conducted in reduced units (using the argon parameters) as the usual way, e.g. H∗= H/σar,²∗wB=²wB/²ar, etc. [25].
For the rest of the paper all quantities are given in reduced units and they are written without the superindex. In all sim-ulations the reduced pressure was P = 1.0. Then, the systems were equilibrated for 10000 Monter Carlo steps and another 60000 steps were run for data production. Few simulations were also run up to 100000 to see any variations, however, we did not observe significant changes in the results.
3.
Results
In this section results for the slit-pores simulations were in-vestigated. The effects of the reaction as a function of tem-perature, particle-particle and particle-wall interactions were analyzed.
3.1. Temperature effects
To study the temperature effects, firstly the cross energy in-teraction between particles of different specie was fixed at
FIGURE1. Concentration number of ”B” (XB) particles as a func-tion of the²AA/²BBparameter at different pore sizes and at differ-ent temperatures. Black circles represdiffer-ent data for the bulk system, square reds are data for a reduced pore width of Z = 10, green di-amonds for Z = 5 and blue tringles for Z = 3. Top figure are the results given at reduced temperature of T = 1.5, middle at T = 1.4 and bottom at T = 1.2. In all figures²AA= 1.0 and²AB= 0.5. Solid lines are just to guide the eyes.
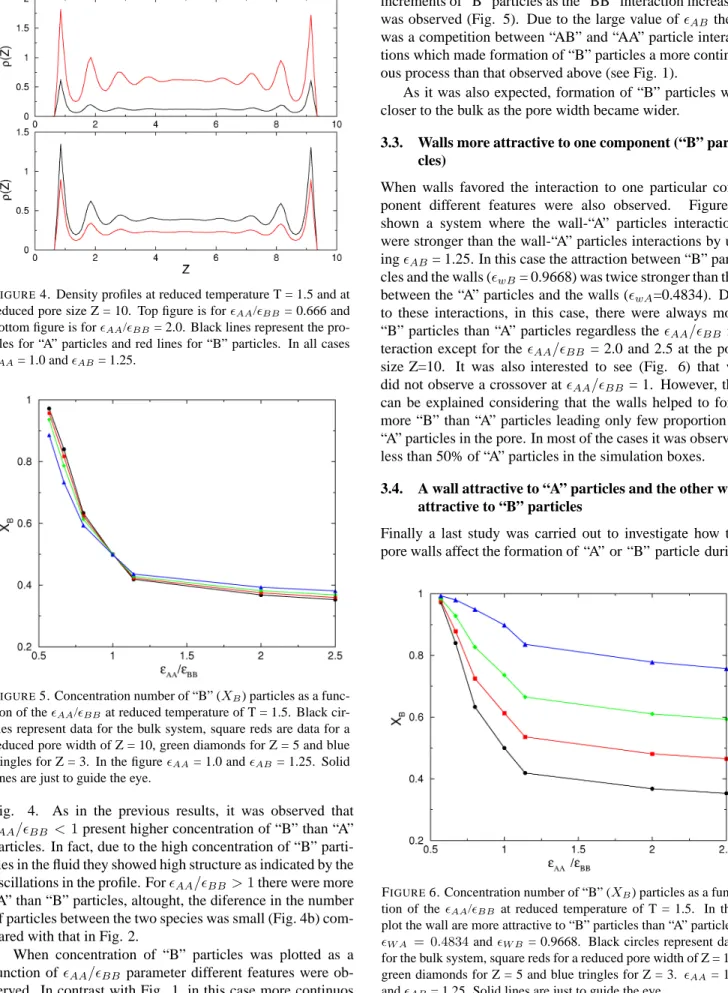
FIGURE2. Density profiles at reduced temperature T = 1.5 and at reduced pore size Z = 10. Top figure is for²AA/²BB= 2.0 and bottom figure is for²AA/²BB= 0.666. Black lines represent the profiles for ”A” particles and red lines for ”B” particles. In all cases
²AA= 1.0 and²AB= 0.5.
²AB = 0.5and symmetric walls were used for the simula-tions, i.e.²wA=²wB= 0.4834.
For these simulations different reduced pore widths were considered (H = 10, 5 and 3) and reaction of the particles were studied as a function of the particle interaction, i.e. the energy ratio²AA/²BB. In Fig. 1 the ratio of the final average number of particles of specie “B”,XB, (= NB/NT where NT is the number of total particles) is plotted for different values of temperature.
Since in reduced units ²AA = 1.0, then large values of ²AA/²BB means small ²BB whereas small values of
²AA/²BB means large ²BB. For weak “B” interactions (²BB < ²AA) it was observed large number of particles “A” (small number of particles “B”), i.e. “A” particles were fa-vored in the reaction. As the “BB” interaction increased (²AA/²BB decreased) the reaction to “B” was more favor-able and consequently the number of “B” particles increased as observed by the plots in Fig. 1. The same trends were depicted from all temperatures and for all pore widths. Ac-tually, as the pore size increased theXB values approached to those of the bulk system as it was expected. It is also im-portant to note that the change from low to highXBbecame sharper as the temperature decreased.
The structure of the fluids were analyzed in terms of their density profiles and they were plotted in Fig. 2 for two
²AA/²BB ratios at one single temperature. For weak “BB” particle interactions the density profiles of component “B” behaved like a gas in the middle of the box whereas the “A” particles formed layers close to the walls with a bulk liquid in the middle of the box. On the other hand, for a strong “BB” interaction we observed that “B” particles were well adsorbed on the surfaces by forming layers trough all the pore whereas just few “A” particles were depicted close to the walls.
FIGURE3. Phase diagrams of temperature as a function of particle concentration,XB. Top figure is for²AA/²BB= 0.95, middle fig-ure for²AA/²BB= 1.0 and bottom figure for²AA/²BB= 1.07. In all cases²AA= 1.0 and²AB= 0.5. Colors are the same as in Fig. 1. Solid lines are just to guide the eye.
As stated before, it is well known that the phase diagram of confined systems is modified, therefore we studied these diagrams to observe how they changed from that of the bulk in all our systems. In Fig. 3 diagrams of temperature as a function of the particle fraction of component “B” are shown at different interactions. It was possible to observe that for strong “BB” interactions (²AA/²BB < 1) the pore was rich in “B” particles. Interesting was to see the data shifted to the left from the bulk as the pore width became narrow. On the other hand, for weak “BB” interactions (²AA/²BB >1) the system was rich in “A” particles, i.e. there was low concen-tration of “B” particles. In this case, it was observed that the data were shifted to the right from those in the bulk as the pore became narrow. However, for any value of the “BB” interaction the data approached to the bulk as the size of the pore increased as expected.
3.2. Different²ABinteraction
All above simulations were conducted for a cross interaction of²AB= 0.5. However, when this interaction was increased different features were observed. Firstly, to study how the particles were structured inside the pore we analyzed the den-sity profiles, and in Fig. 4 we show typical plotts for a system with²AB= 1.25 at reduced temperature of T=1.5 in the pore sizeZ = 10 for two “BB” interactions,²AA/²BB = 0.666 (top) and²AA/²BB= 2.0 (bottom). As in Fig. 2 we saw that small²AA/²BBproduced more number of “B” particles (with strong structure close to the walls) than “A” particles, how-ever, since in this case²AB was stronger than that in Fig. 2, there were here more “A” particles with stronger structure.
More over, in this case, “B” particles liked to be with “A” particles and consequently it was more difficult to form rich phases composed only of “A” or “B” particles as indicated in
FIGURE4. Density profiles at reduced temperature T = 1.5 and at reduced pore size Z = 10. Top figure is for²AA/²BB= 0.666 and bottom figure is for²AA/²BB= 2.0. Black lines represent the pro-files for “A” particles and red lines for “B” particles. In all cases
²AA= 1.0 and²AB= 1.25.
FIGURE5. Concentration number of “B” (XB) particles as a func-tion of the²AA/²BBat reduced temperature of T = 1.5. Black cir-cles represent data for the bulk system, square reds are data for a reduced pore width of Z = 10, green diamonds for Z = 5 and blue tringles for Z = 3. In the figure²AA= 1.0 and²AB= 1.25. Solid lines are just to guide the eye.
Fig. 4. As in the previous results, it was observed that
²AA/²BB <1present higher concentration of “B” than “A” particles. In fact, due to the high concentration of “B” parti-cles in the fluid they showed high structure as indicated by the oscillations in the profile. For²AA/²BB>1there were more “A” than “B” particles, altought, the diference in the number of particles between the two species was small (Fig. 4b) com-pared with that in Fig. 2.
When concentration of “B” particles was plotted as a function of ²AA/²BB parameter different features were ob-served. In contrast with Fig. 1, in this case more continuos
increments of “B” particles as the “BB” interaction increased was observed (Fig. 5). Due to the large value of²AB there was a competition between “AB” and “AA” particle interac-tions which made formation of “B” particles a more continu-ous process than that observed above (see Fig. 1).
As it was also expected, formation of “B” particles was closer to the bulk as the pore width became wider.
3.3. Walls more attractive to one component (“B” parti-cles)
When walls favored the interaction to one particular com-ponent different features were also observed. Figure 6 shown a system where the wall-“A” particles interactions were stronger than the wall-“A” particles interactions by us-ing²AB= 1.25. In this case the attraction between “B” parti-cles and the walls (²wB= 0.9668) was twice stronger than that between the “A” particles and the walls (²wA=0.4834). Due to these interactions, in this case, there were always more “B” particles than “A” particles regardless the²AA/²BB in-teraction except for the²AA/²BB = 2.0 and 2.5 at the pore size Z=10. It was also interested to see (Fig. 6) that we did not observe a crossover at²AA/²BB = 1. However, this can be explained considering that the walls helped to form more “B” than “A” particles leading only few proportion of “A” particles in the pore. In most of the cases it was observed less than 50% of “A” particles in the simulation boxes. 3.4. A wall attractive to “A” particles and the other wall
attractive to “B” particles
Finally a last study was carried out to investigate how the pore walls affect the formation of “A” or “B” particle during
FIGURE6. Concentration number of “B” (XB) particles as a func-tion of the²AA/²BB at reduced temperature of T = 1.5. In this plot the wall are more attractive to “B” particles than “A” particles,
²W A = 0.4834and²W B = 0.9668. Black circles represent data for the bulk system, square reds for a reduced pore width of Z = 10, green diamonds for Z = 5 and blue tringles for Z = 3. ²AA= 1.0 and²AB= 1.25. Solid lines are just to guide the eye.
FIGURE7. Density profiles at reduced temperature T = 1.5 and at a reduced pore size Z = 10. In this figures one wall was attrac-tive to “A” particles whereas the other wall was attracattrac-tive to “B” particles. Top figure is for²AA/²BB= 0.666 bottom figure is for
²AA/²BB = 2.0.Black lines represent the profile for “A” parti-cles and red lines for “B” partiparti-cles. In all cases²AA= 1.0 and
²AB= 1.25.
FIGURE8. Concentration number of B (XB) particles as a func-tion of the²AA/²BB at reduced temperature of T = 1.5. In this figures one wall was attractive to “A” particles whereas the other wall was attractive to “B” particles. Black circles represent data for the bulk system, square reds for a reduced pore width of Z = 10, green diamonds for Z = 5 and blue tringles for Z = 3. ²AA= 1.0 and²AB= 1.25.Solid lines are just to guide the eye.
a reaction when one specie of particles was attracted to one wall whereas the other wall attracted the other specie.
From Fig. 7, density profiles for a pore widthZ = 10at different²AA/²BBratios are shown. It was observed that “A” particles were adsorbed to one wall while “B” particles to the other. As it was expected for²AA < ²BB there were more “B” particles through the pore (see top of Fig. 7). More over, the “B” particles developed several adsorbed layers close to one of the walls and at the same time the other wall was
satu-rated mainly by “A” particles. When²AA> ²BBthere were similar number of “A” and “B” particles in the pore, never-theless, there were still “B” particles adsorbed to one wall whereas “A” particles were adsorbed to the other wall, how-ever, in this case the particles formed more structured layers as it shown in the bottom plot of Fig. 7. In this case, it is interesting to observe a few “A” particles even next to the se-lective wall to “B” particles. However, this can be understood in terms of the cross interactions. Since the cross parameter (²AB = 1.25) favored the “A” and “B” interaction then we found few ”A” particles close to “B” particles. On the other hand the “AA” interaction is stronger than the “BB” therefore the probability to find “A” particles next to “B” particles is higher in regions of high “B” concentrations.
The concentration plots as a function of particle interac-tion is shown in Fig. 8. Basically, the same trend was ob-served as previous cases, i.e. small²AA/²BB values made largerXBwhereas large values of²AA/²BBproduced small
XB. Since, there was a competition between “A” and “B” particles the crossover at²AA/²BB= 1.0was observed once again.
4.
Conclusions
We present results of a binary mixture confined in two paral-lel walls by using the Reactive Monte Carlo method. This technique allowed us to study adsorption of the fluids at chemical equilibrium conditions. In particular we investi-gated how fluids under confinement were affected by the in-teractions between particles of different species. When “BB” interactions were smaller than the interaction between “AA” particles the formation of particles of an specific specie was determined by the individual interactions of each specie, i.e. strong “BB” interactions produced more “B” particles. This issue was observed in all the systems regardless the simula-tion temperature.
On the other hand, if the cross interaction “AB” was stronger that the “AA” and “BB” interactions then creation of B particles, in general, was favored. From the results it was also possible to observe that adsorption on the walls was de-termined by the number of particles created close to the walls with the formation of high peaks and strong fluid structures of the dominated specie in the mixture.
Finally, we can say that rich phases of one particular specie of particles can be controlled by strong or weak in-teraction of this specie with the walls, e.g. strong wall - “B” particle interactions produced that those particles were more abundant in the system.
Acknowledgments
I acknowledge support from DGCTIC-UNAM by using the KamBalam supercomputer. I also acknowledge support from DGAPA-UNAM by grant IN102812 and Conacyt-Mexico by grant 154899.
I acknowledge Prof. Martin Schoen, from Technical Uni-versity of Berlin, Alemania, for helpful discussions and for
the facilities of the Department of Chemistry Theoretical Chemistry where this work started during an academic visit several years ago.
1. P. J. Barrie, ANN R NMR S. 41 (2000) 265.
2. J. A. Duffy and M. A. Alam, Langmuir. 16 (2000) 9513.
3. D. G. Jones and H. M. Fretwell, J Phys-Condens Mat. 15 (2003) 4709.
4. M. Sliwinska-Bartkowiak et al., Stud Surf Sci Catal. 128 (2000) 141.
5. S. Varga et al., J. Colloid Interf Sci. 227 (2000) 223.
6. A. Chrzanowska, J. Comput Phys. 191 (2003) 265.
7. M. B. Sweatman, A. A. Atamas, and J. M. Leyssale, Journal
OF Chemical Physics. 128 (2008) 064102.
8. M. B. Sweatman and N. Quirke, Molecular Simulation. 31 (2005) 667.
9. T. Kaneko, T. Mima, and K. Yasuoka, Chemical Physics
Let-ters. 490 (2010) 165.
10. M. Schmidt, A. Fortini, and M. Dijkstra, Journal of
Physics-Condensed Matter. 16 (2004) S4159.
11. E. Diaz-Herrera, J. A. Moreno-Razo, and G. Ramirez-Santiago,
Physical Review E. 70 (2004) 051601.
12. B. Coasne et al., Journal of Physical Chemistry B. 113 (2009) 13874.
13. H. Dominguez, M. P. Allen, and R. Evans, Molec. Phys. 96 (1999) 209.
14. M. Lupkowski and F. van Swol, J. Chem. Phys. 93 (1990) 737.
15. J. E. Hug, F. van Swol and C. F. Zukoski, Langmuir 11 (1995) 111.
16. M. Miyahara and K. E. Gubbins, J. Chem. Phys. 106 (1997) 2865.
17. M. W. Madox and K. E. Gubbins, J. Chem. Phys. 107 (1997) 9659.
18. J. K. Johnson, A. Z. Panagiotopoulos, and K. E.Gubbins,
Molec. Phys. 81 (1994) 717.
19. M. Lisal, J. K. Brennan, and W. R. Smith, J. Chem. Phys. 124 (2006) 064712.
20. C. H. Turner, J. K. Johnson, and K. E. Gubbins, J. Chem. Phys.
114 (2001) 1851.
21. N. Hansen, S. Jakobtorweihen, and F. J. Keil, J. Chem. Phys.
122 (2005) 164705.
22. S. Jakobtorweihen, N. Hansen, and F. J. Keil, J. Chem. Phys.
125 (2006) 224709.
23. K. E. Gubbins, Y-C. Liu, J. D. Moore, and J. C. Palmer, Phys.
Chem. Chem. Phys. 13 (2011) 58.
24. C. H. Turner et al., Molecular Simulation. 34 (2008) 119.
25. M. P. Allen and D. J. Tildesley, Computer Simulations of