Pattern Recognition for Automated DNA
Sequencing: I. On-line Signal
Conditioning and Feature Extraction for Basecalling
James B. Golden, HI 1
Deborah Torgersen
2
Clark Tibbetts2 t Department of Mechanical Engineering, z Department of Microbiology and ImmunologyVanderbilt University Schools of Medicine and Engineering Nashville, TN 37232-2363 USA
[email protected] tibbetts@ ctrvax.vanderbilt.ed u Abstract
The massive scale of DNA sequencing for the Human Genome Initiative compels efforts to reduce the cost and increase the throughput of DNA sequencing technology. Contemporary automated DNA sequencing systems do not yet meet estimated performance requirements for cost-effective and timely completion of this project. Greater accuracy of basecalling software would minimize manual review and editing of basecalling results, and facilitate assembly of primary sequences to large contig(uous) arrays. In this report describe a neural network model for photometric signal conditioning during raw data acquisition with an automated DNA sequencer. This network supports on-line extraction and evaluation of informative arrays of oligomer separations and yields, as a feature table for accurate, real-time basecalling.
Introduction
Contemporary automated DNA sequencers monitor electrophoretic transport of labeled oligonucleotides, providing digitized images of the sequencing ladders in real time. Reduction of the digital image from an entire run to multiple sequence text files follows data acquisition. Advances in DNA electrophoresis, employing thin slab or capillary gels, may accelerate DNA sequencing data acquisition by one to two orders of magnitude (Luckey et al., 1990; Swerdlow and Gesteland, 1990; Huang et al., 1992; Kambara and Takahashi, 1993). This approach supports larger arrays of samples per run and sharply reduced time for high resolution separation of the oligomer ladders. It is doubtful that conventional basecalling software can keep pace with the anticipated cascade of raw sequencing data.
Basecalling software bundled with automated DNA sequencers recursively identifies the trace of each oligomer in the data streams, in the order of its appearance at the instrument’s detector. The 3’ terminal nucleotide of each oligomer is determined by its lane position or label. When signal detection and electrophoretic resolution are favorable, the performance of this one-at-a-time basecalling rationale is excellent. When signal-to-noise ratio and separation of oligomers deteriorate, basecalling is prone to error.
Work from our laboratory recently demonstrated that the images of DNA sequencing ladders bear additional information, as contextual arrays of the relative yields and the
This research was supported in part by NIH Grant HG00562 from the National Center for Human Genome Research.
relative separations of the oligomers (Bowling, 1991; Bowling et al., 1991; Tibbetts and Bowling, 1992; Tibbctts et al.,
1993). These informative parameters can be analyzed as data vector arrays in neural network pattern classifier programs. This results in significantly increased sequence accuracy and modestly increased sequence range, compared with conventional base-calling software.
We have developed a neural network for photometric signal conditioning during raw data acquisition with an automated DNA sequencer. The processor-network e ffccti vely performs background subtraction, multicomponent analysis (color separation), and deconvolution of adjacent oligomcr signals. This processor-network also supports on-line feature extraction, providing uncorrupted arrays of oligomer separations and yields. A small memory buffer can retain this data as a feature table, for translation to DNA SeXlucnces with a second-stage, basecalling neural network.
Rationale and Methods
DNA Sequencing and Instrument System
The Applied Biosystems ABI 373A automatexl DNA sequencer was used in the work presented in this paper. This instrument is currently in widest use in the field of large scale DNA sequencing. The system is based on a scanning laser / filter photometer which discriminates among four fluorescent dyes used to label the four base-specific oligonucleotide ladders (Smith et al., 1986; Connell et al., 1987). Sequencing reactions were based on the dideoxyterminator sequencing method (Sangeretal., 1977), modified for the thermo-cycling reaction with Taq DNA polymerase (Innis et al., 1988). The four fluorescent dye labels were on -21 position M l 3 forward sequencing primers, as reagents from Applied Biosystems. DNA templates were single-stranded M 13 phage preparations. Sequencing data was generated in the laboratories of the Stanford University Yeast GenomeProject, and made available to us as part of an extended research collaboration.
Access to Raw Photometry Data
Access to the sequencing data of individual DNA samples is made available to the user through the ABI Analysis program. Display of raw dataprofilcs and processed, basecallcd profiles are supported by the program, but the actual data is From: ISMB-93 Proceedings. Copyright © 1993, AAAI (www.aaai.org). All rights reserved.
not readily accessible to the end user. The processed data streams are modified, imposing more uniform peak heights and separations than seen in the raw data profiles. The transforming algorithms used for the basecalled display traces, and for basecaUing have not been disclosed by Applied Biosystems.
We dissected the structure of Analysis sample data files, in order to access the raw andprocessed data streams recorded by the DNA sequencer, enabling an independent basecaUing analysis. An array of tagged, 28-byte long, fixed-length data records, which describes the detailed structure of the entire file, is located near the end of the file. ’DATA’ records #1 through #4, and #9 through #12, indicate positions and sizes of short in teger arrays, corresponding to the raw an d processed photometer data streams, respectively.
Software and Computers
Software tools for analysis of DNA sequencer data were developed in our laboratory for operation on Apple MacintoshTM II computers. We have made extensive use of Think C 5.0TM, ExcelTM 3.0, MathematicaTM 2.0, and
NeuralWorks Professional II
TM.
On-the-Fly Signal Conditioning
Approach
The work presented in this report is on the level of cross-sections through single lanes, tracked and extracted by ABI software from the raw data gel image file to the sample data file. Our model, however, is projected to operate on-line, for processing of each entire line of data: 194 positions, one pass for each of the four filters per scan cycle. The processor requires a modest buffer of only three recent lines of scan data (3 x 194 x 4 x 2 = 4656 bytes) to perform the background subtraction, color separation and deconvolution operations. This small buffer would roll down the previous two lines of data as each new line of scan data is received for processing. Background Subtraction
The stability of the ABI 373A scanning photometer system, over prolonged periods of on-line data recording, enables a very simple, on-the-fly estimation of background for subtraction from the four data channels. For each scanning line of raw data, the 194 x 4 values are used to calculate the differences from the corresponding values of the previous scan. Accumulating sums of signal differences are adjusted by corresponding minimum values, which are updated throughout the run. The adjusted values are recorded in the memory buffer described above. These operations approximately double the working memory buffer required for implementation of the on-the-fly processor. We successfully used this same methodin software developed for operation of the Du Pont Genesis 2000TM fluorescence
automated DNA sequencer (Bowling, 1991; Bowling et al., 1991). The method compares favorably with anotherempirical, but slower, post-processing method, estimating background
signals for subtraction as the minimum signals in floating windows of _ 100 scans about each data point.
Neural Network Signal Conditioner
We have developed a neural network for signal conditioning of the buffered scan data, Figure 1. The specific role of the network is to transform the photometric signals in four channels to qualitative estimates of the specifically labeled oligomers. Network architecture was a significant consideration for this application, since memory size and processing speed are critical in a real-time environment. The typically large array of connections, and the computationally intensive generalized delta rule training algorithm, led us to seek an alternative to the conventional, multilayer backpropagation network. The numbers of processing nodes and connections, and the time required for training and recall can be significantly reduced by removing the hidden layer, and extending the dimensionality of the input space. A one layer network can be effectively trained using the simpler delta rule, since the separating hyperplancs generated by such a network are defined in the space of the extended input layer.
Bias N-1 N+I nocall=0000 C=1000 A=0100 G=0010 T=0001
C
A
G
T
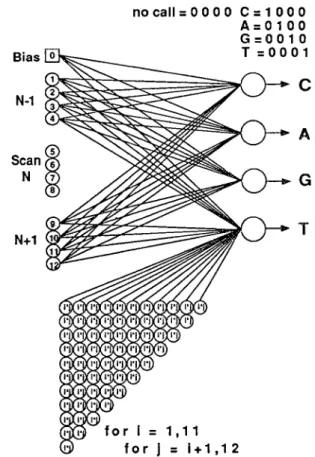
for i = 1,11 for J = i+1,12Figure 1. Single layer neural network with higher order input terms for signal conditioning data from an automated DNA sequencer. The input nodes 1 to 12 represent the four channels of photometry data from three successive scans across the sample lane. Pairwise products of the input terms comprise the 66 nodes of the higher order input array. All of the 79 input nodes are fully connected to the four nodes of the output layer (not all connections shown).
In contrast to the linear weighting produced by the connections of a generalized delta rule network, a higher order connection link, or functional link (Pat, 1989; Pat and Khatibi, 1990) acts on an dement of a pattern, or on the entire pattern itself, by generating a set of linearly independent functions, then evaluating these functions with the pattern as the argument. This approach proved to be remarkably well suited for our application.
There are four output nodes to indicate the presence or absence of credible signals associated with 3’ ddC, ddA, ddG or ddT-terrninated oligomers. Each oligomer is associated with a 3’ base-specific fluorescent label attached to the opposite 5’ primer end of the DNA strand.
There are thirteen primary input nodes for the network. Node 0 represents a bias node, which presents a fixed value of 1 to the output layer. Nodes 1 through 12 represent three adjacent scans of the four photometric data streams extracted from the ABI sample data file. Each of these primary input nodes is connected to the four nodes of the output layer. The network also generates, by calculation, higher order terms as input nodes. Specifically, we have employed the 66 pairwise products of primary input nodes 1 throughl2. These higher order input nodes are fully connected with the four output nodes. Thus there are four sets of 79 connection weights representing the processing memory of the network. Early experiments revealed no advantage, in this problem, for expansion to even higher order input terms.
Network Training
ASCII data sets for training of the signal conditioning network are constructed using background-subtracted raw data blocks, extracted from the ABI sample data files. Each scan line, with its two flanking scan lines, is assigned a binary output vector for mapping:
3’ -ddC => 1 0 0 0
3’ -ddA => 0 1 0 0
3’ "ddG => 0 0 1 0
3’ -ddT => 0 0 0 1
no call => 0 0 0 0
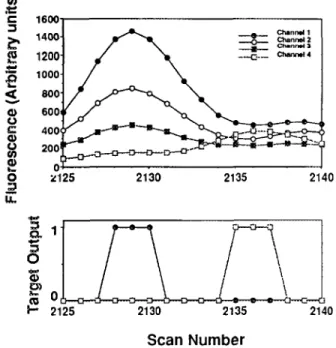
A short segment from a training set demonstrates typical input:output vector mapping. The data segment is displayed in Figure 2, with the target output indicating two nucleotides of sequence 5’-dC-dT -3’. Recall that sets of three scans are mapped to the output vectors associated with the middle scan. Neural networks and their connection weight matrices can be considered as universal function approximators. The target vector for an oligomer event could have been mapped to emulate a model oligomer peak shape, such as a Gaussian function, in which case the network’s operation would be analogous to a low-pass filter with a Fourier Transform convolution. In our network, the model peak shape more closely resembles a Dirac delta function, or Kronecker B for
the discrete space. This model strongly influences the performance of the network, towards detection of oligomers as all-or-nothing events. As described in a following section,
the relative quantities of each oligomer are evaluated as the
1600" 1400-1200" 1000-800" 6001 4O0 2OO z125 2130 2135 2140 I- 2125 2130 2135 2140 Scan Number
Figure 2. Raw sequencer data corresponding to 5’ -dC-dT- 3’, upper panel, following background subtraction. The lower panel shows the corresponding target vector streams. The training set identifies and specifies oligomers in the raw data streams, and leads to no call except in credible, peak regions of the oligomer traces.
inner product of the neural transform and the intensities of the signals in the corresponding raw data stream.
A typical training set consists of of 6400 scans, extracted from three sequencing ladders. The set was arbitrarily divided into segments of 200 scans, which were then shuffled among two files for network training and evaluation. Networks were initialized and trained through 50,000 to 1,000,000 iterations of the training data set. Performance is marginally improved with the larger number of training iterations, with no indication of overtraining, or memorization of the training examples. This may be due the the very large size of our training sets. Performance of the Network
Figure 3 illustrates a window of raw ABI sequencer data (for 5’-dA-dA-dT-dA-dC-dC-dT-dG-dG-3’) and the corresponding transform from the signal conditioning neural network. The network’s output profiles show effective color separation and discrimination among the four dyes represented in the raw photometer data. Outputs signals from the network are effectively deconvolved. The traces of the oligomers in the network-transformed data streams are centered at the same positions as they appear in the ABI raw data streams.
The low background and limited channel crossover in the network-transformed data streams facilitates peak finding. Each channel of the transformed outputs can be monitored for signals increasing above a low threshold, setting a flag to begin the process of feature extraction for a new event in that channel. When the signal abates to the threshold, the flag is returned and the evaluated features of the given oligomer event are recorded in a table for basecalling.
2500. ~, 2000.
g
1500, lOOO, ~ Channel 1Channel 2 1 ]. .._.__ c~nel : ~" 1960 1980 2000 2020 2040 1.8
lgroO 1960 2000 2020 2O4O Scan NumberFigure 3 (above). Window of 90 scans showing ABI 373ATM raw
data (upper panel) and same data ~ansformed by the neural network signal conditioner. Base-specific signals from the transformed chan-nels (lower panel) d~nonstxate effective color separation and deconvolution. Identity of base-specific oHgomers is unambiguous.
The network processes 3200 scans in 10.6 seconds or 26 seconds on a Macintosh Quadra 700 or Ilfx, respectively. Extrapolating full window scanning, 194 sets of four photometer readings per scan, would require from 0.6 to 1.3
seconds of signal conditioning per scan cycle. Since the ABI 373ATM initiates scans every 6 seconds, this prototype signal processor would interupt or delay the native process of raw data acquisition. On-the-fly signal conditioning and basecalling appears to be feasible for the ABI 373ATM and also supports improved basecaUing accuracy expected from our multivariate, contextual pattern recognition approach.
The matrix of 316 connection weights from a trained network is available for analysis. The NeuralWorks (NeuralWare, Pittsburgh, PA) shell’s "annotated ASCII" file format records each weight in order, as a floating point decimal number following the character string "<Variable>". Weights are recorded in four sets of 79, connected to the four
output nodes, in order, from the Bias node 0, primary input nodes 1 to 12, and then from the array of 66 nodes representing the pairwise products of input nodes.
Two networks were separately trained, using the two training files described above. The weight matrices were extracted from each trained network for comparison. As shown in Figure 4, the distributions of weights, as the 4 sets Figure 4 (right). Connection weights from the primary and higher order input nodes (79) to each of the base-specific output nodes. Two separate evaluations of lIained networks reveal congruent weight matrices. Weights consistently appearing with near-zero values may be pruned to increase the efficiency of the network.
60, 40! ... - ... I ¯ 5 10 15 20 25 30 35 40 45 50 $$ 60 65 70 75 80 60" 440,
8
-20 5 10 15 20 2S 30 35 40 45 50 55 60 65 70 75 80 .... ..-.. . . .. . . 5 10 15 20 25 30 35 40 45 .50 55 60 65 70 75 80 60-40,(J
-20. 5 10 1S 20 25 30 35 40 45 SO 55 60 6s 70 75 80of 79 connections, are nearly congruent for each of the independently trained networks. As expected, the strongest excitory weights are the connections from nodes 5 to output node C, 6 to output node A, 7 to output node G, and 8 to output node T. These correspond to the four primary input vector nodes, representing the middle of the three scans as a particular nucleotide peak. Significant inhibitory nodes and additional excitory nodes are congruently scattered throughout the weight matrices of both networks, as connections with particular higher order nodes.
Since the network has no hidden layer, it is easy to analyze the roles ofspecific input variables on the performance of the network. This also focuses attention on connections with weights near zero, contributing little to the performance of the network. Pruning these connections, with some additional training afterwards, can further improve the processing speed with little deterioration o fperformance. Our initial experiments with such pruned networks removed about half of the connection weights without serious loss of performance. The 3200 scan processing benchmark was reduced from 26 seconds to 19.6 seconds (Macintosh Ilfx).
Feature Extraction
Peakfinding in the individual, base-specific, translbrmed data streams is straightforward, as suggested above. The temporal order of the detected oligomers provides a first-pass estimation of the DNA sequence. Our approach to greater accuracy in basecalling exploits the contextual arrays of relative yields and relative separations of the oligomers, as a pattern recognition analysis of the sequencing ladder image.The yield and the separation of an oligomcr in a sequencing gel provide information about the 3’ nucleotide identity, based upon independent biochemical and biophysical determinants.
The yield of an oligomer is determined by the competition between chain elongation and chain termination, at each position from 3’ to 5’ along the template DNA sequence.This incorporation competition between the pools of deoxy- and dideoxynucleotides may occur at the levels of nucleotide binding to the polymerase:DNA complex, rate of addition to the 3’ hydroxyl of the growing DNA chain, or perhaps rate of exonucleolytic excision from the 3’ end of the nascent DNA chain.
The separation of an oligomer from the immediately shorter oligomer of the ladder is based on the difference of the mobilities of two successive oligomers. The greatest determinant of this is incremental length ofone nucleotide. Significant variation of the separation ofoligomers is observed, based upon con formational dynamics of the oligomers during gel electrophoresis (Bowling et al., 1990).
Nearest-neighbor nucleotide interactions have been proposed to explain the sequence contexts of the variations of oligonucleotide mobility (Bowling et al., 1990) and chain elongation kinetics (Bloom et al., 1993; Joyce et al., 1992; Echols and Goodman, 1991).
An estimate of the relative yield of the oligomer event can be made from the intensity of its signal in the data
streams.This intensity is determined from the outputs of the
signal conditioning neural network as an inner product with the raw data. This inner product is the simple sum of products of an output channel and its corresponding raw data input channel, scan by scan over the interval of significant signal from the output channel.
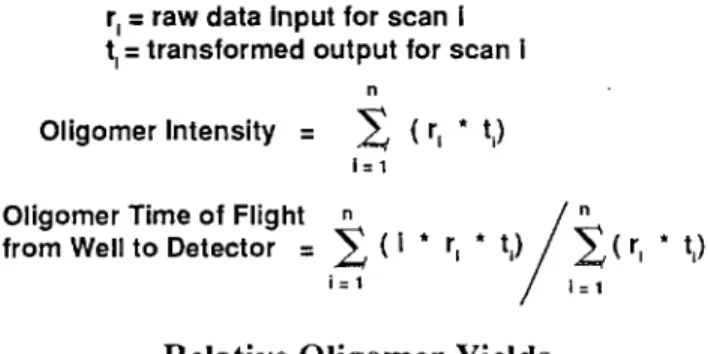
The separation of successive oligomers in the ladder is estimated as the difference in time (scan numbers, 6 seconds per scan) between their peak centers. Peaks centers arc calculated as the intensity-weigh ted averages of sc an n umbers during the period of data collection for each oIigomer event. For n scans, representing an oligomer event:
r~ = raw data Input for scan i t~ = transformed output for scan i
n
Oligomer Intensity = ~ (r E * t) I=1
OlJgomerTimeofFlight ~
)/__~
from Well to Detector = (I * r~ * t~ (r, * t])
i=1 I
Relative Oligomer Yields
DNA sequencing ladders of Sanger dideoxy-sequencing reactions show significant variances of oligomer yields. Systematic relationships of neighboring nucleotides appear to be associated with particularly strong or weak oligomer bands. Different DNA polymerases appear to have complex, idiosyncratic "rules" relating neighboring bases and oligomer intensities. Consensus opinion is that these systematic intensity variations reflect events during the in vitro synthesis of the oligomers, as determined by the template DNA sequence in the proximity of the chain elongation site (Ansorge et al.,
1987; Connell et al., 1987; Hindley, 1983; Jensen etal., 1991; Kristensen, 1988; Smith et al., 1986; Tabor & Richardson,
1987, 1989, 1989; Toneguzzo et al., 1989). Here the DNA polymerase and template DNA are intimately associated in the locale of the 3’ terminal hydroxyl group of the nascent DNA strand. Chain termination with the ddNTP increases the yield ofoligomers of the particular length associated with the site of addition. Elongation with the dNTP extends the new chain without contributing to oligomer signal at that position.
The neural network signal conditioner facilitates automated reporting of the relative yields of oligomers in sequencing ladders. We have used such data for a statistical survey of the polymerase:DNA complex in the proximity of the 3’ hydroxyl site of chain elongation. This is done by analysis of the variance of relative oligomer yields, with respect to the identities of the four nucleotides which occur at particular positions relative to the tcrmination site.
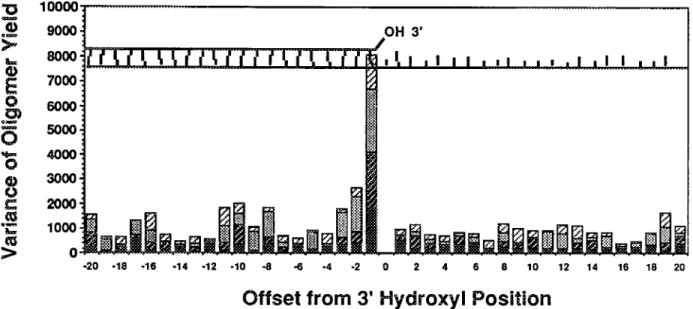
Figure 5 illustrates the results of this analysis over a range of --+ 20 nucleotides from the 3’ hydroxyl termination site. The stacked columns represent the sums of the variances of relative yields for each of the four groups of 3’-ddN terminated oligomers. The most significant variation of oligomer yields is determined by the identity of the bases at positions (n-l), (n-2) and (n-3). There appears to be minor influence of the sequence approximately 10 base pairs
10000. 9000, 8000, 7000, 6000’ 5000, 4.000, 3,000. 2000’ 1000. 0 -20 -18 -16 -14 -12 -10 -8 -6 -4 *2 OH 3’ ¢ , I,,I, I II ,, I., :__! _;___!____,:___,!____,1_____!___!___! ... 2 4 6 8 10 12 14 16 18 20
Offset from 3’ Hydroxyl
Position
Figure 5. A variance profile of the Taq DNA Polymerase in relation to the sequence context of the template DNA strand. The relative intensities of the oligomers from a sequencing ladder were segregated into four groups according to 3’ terminal nucleotide. Intensity values were I~eated as percentages of the meanintertsity of those oligomers having the corresponding 3’ terminal nucleotide. Separately, the variance of relative intensity was determined for the four subgroups of oligomers which have dA, dG, dC or dT at the indicated offset position. The stacked column histogram bundles the four variances determined at each position, for the group of 3’ dT, dG, dC and dA-terminated oligomers, top to bottom. Each of the 16 categories typically have 15 to 30 samples from a single ladder. upstream from the termination site. This analysis of the
distribution of variance was performed with two different M13 phage DNA sequencing ladders, with different stock reagents for the synthesis reactions. The average oligomer
signals for the four base-specific reaction products in the ladders differed significantly. Nevertheless, the detailed distributions of the variance of average yield, as percentages of the entire ensemble’s averages for ddA, ddC, ddG and ddT oligomers, was virtually identical in both experiments.
These results reflect the interaction of Taq DNA polymerase with the DNA template and nascent DNA chain under reactions conditions including elevated temperature used in thermal cycling sequencing protocols. We are very interested in evaluating this statistical probing of different DNA polymerases under a variety of reaction conditions.
Relative Oligomer Separations
The reptation, or end-on migration of single-stranded DNA through the polyacrylamide gel matrix (Bean & Hervet,
1983a, 1983b; Edmonson & Gray, 1984; Hervet and Bean, 1987; Lerman & Frisch, 1982; Lumpkin & Zimm, 1982), allows subtle conformational differences to affect oligomer mobility. This introduces significant variation in the separation of incremental oligomers from one another. In sequencing ladders separated by gel electrophoresis these differences are determined by nearest neighbor interactions among the 3’ terminal two to three nucleotides of the oligomers (Bowling et al., 1991).
The correlation of oligomer separations with 3’ terminal DNA sequences was originally characterized in sequencing ladders analyzed with the Du Pont Genesis 2000TM system. The four succinyl-fluoroscein dye derivatives used as
base-specific dideoxyterminators differ only slightly in their chemical structure (0 to 4 methyl groups on the fluorophore, Prober et al., 1987). The separation:sequence correlations were consistently observed, regardless of the placement of the four labels at the 3’ ends of oligomers in single ladders, or with single labels placed at the 5’ primer end of the oligomers. Consistent separation behavior has also been observed (unpublished results of this laboratory, and examinations of demonstration data provided by manufacturers), with:
l) radiolabeled oligomers in static view manual sequencing gels,
2) direct blot temporal view ladders with radiolabeled oligomers (BetaGen AutoTrans 350TM ; Pohl, 1987),
and
3) raw data from automated sequencers with single fluorescent label, 4 lanes (Millipore BaseStation
TM,
Pharmacia A.L.F.TM). TM, and LI-COR Model 4000 The four different fluorescent dyes employed as labels in the ABI system impose additional complexity on the analysis of oligomer separations in sequencing ladders (Smith et al., 1986; Connell et al., 1987). Adjustments of the dye-nucleotide chemical linkages and software corrections are attempts to compensate for dye-related mobility artifacts. However, physical reality is further masked by the imposition of nearly uniform spacing of the oligomers in the ABI processed and basecalled display traces.
Our on-line signal conditioning neural network could accurately track the time of flight, from well to detector, for each of the oligomer events in the cumulative feature table generated during a sequencing run. The output of the neural network signal conditioner does not alter the temporal
separations of oligomers reflected in the raw data streams. As indicated in the table below, the average relative separations of oligomers in the ABI system, determined from our signal conditioning system, differ significantly from the results reported earlier by Bowling et al. (1991).
Average Oligomer Relative Separations mean __ standard deviation (samples)
3’ nucleotlde D.U_BOJ]I ABI
-ddA 0.956 4- 0.126 (85) 1.136 _+ 0.234 (62) -ddC 0.815 4- 0.163 (95) 1.084 4- 0.278 (68) -ddG 1.049 ___ 0.150 (77) 0.780 +_ 0.251 (76) -ddT 1.177 4- 0.108 (90) 1.028 __ 0.264 (65) The range of average relative separations in each system is about the same, ___ 16% to 18%, however the variance associated with the relative separations is about two times greater with the ABI data. Of even greater significance is the different order of relation between the 3’ dideoxynucleotides and average relative separation:
Slowest ¯ Fastest
DuPont: -ddT --> -<tdG -> -ddA -> -ddC ABh -ddA --> -ddC --> -ddT --> -ddG The correlations of the relative separations are similarly divergent with regard to the terminal two 3’ nucleotides of the oligomers. The most extreme classes observed are:
Slowest Fastest
Du Pont: 3’-dCddT (1.39) 3’-dT-ddC (0.77)
ABh 3’-dGddA (1.43) 3’-dA-ddG (0.62)
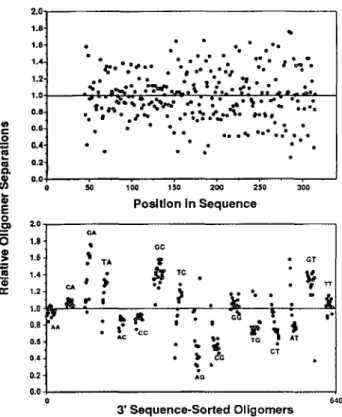
3’-dGddC (1.44) 3’-dC-ddG (0.56) Figure 6 illustrates that the variance in relative oligomer separations does not change significantly from shorter to longer oligomers of the sequencing ladder. The lower panel of Figure 6 shows that the relative oligomer separations are strongly clustered when sorted into 16 categories, based on their 3’ dinucleotide sequences. Although the pattern of separations with respect to 3’ sequence is dramatically different than observed in the Du Pont and general cases, the clustering is especially strong for 9 of the 16 classes of ABI separation groups. In this system, relative oligomer separation is a more complex and AB I-specific parameter for pattern recognition-based basecalling.
The differences in the separation properties ofoligomers labeled with the ABI fluorophores most plausibly result from the different effects each dye has upon the mobilities of the oligomers. The entire -dG and -dT ladders appear to be offset (faster) with respect to oligomers labeled with the other dyes. Correspondingly the -dA and-dC ladders appear to be retarded by their fluors. The magnitudes of the dye-related offsets appear to be greater than the effects that can be attributed to
2.0-in i~ 0.6-o "~ 0.4: 0.2-¢~ 0.0o E 0 0 L$ J >0 1.6 0~ I~ 1,4 1.2 1.0 0.8 0.6 0.4 0.2 0.0 Posltlon in Sequence
.;
TA°°
~ ¯ GT ~ TC ¯ I CA ¯ ¯¯
.°°
¯ ~t CT Aa 0 640 3° Sequence-Sorted Oligomers Figure 6. Relative separations of o/igonucleotides in anAB[ 373ATM
DNA sequencing ladder. Peak center separations were divided by a third-order polynomial fit to the distribution of separations as a function of oligomer chain length. The upper panel reveals the large variance of relative separation, with no relation to length (position in the sequence). The lower panel displays the same oligomer set as clusters of oligomers in the 16 categories determined by the 3’ terminal dinucleotide sequences. Nine of the 16 categories reveal very uniform distributions of relative separation. The ABI dye-mobility artifact represents another informative determinant of the separation parameter.
neighboring nucleotide interactions at the 3’ (unlabeled) ends of the oligomers. But the latter, more general effects are not altogether missing. The relative separations of the oligomers which end in two identical bases, as 3’-dA-ddA, 3’-dG-ddG, 3’-dC-ddC, 3’-dT-ddT, have the same relative order and magnitude in ladders of the AB I and Du Pont systems. In each of these four cases, the specific offsets attributable to the same fluorophore at the 5’ primer ends should be nearly equal, and thus should not contribute to the average relative separations of these oligomers.
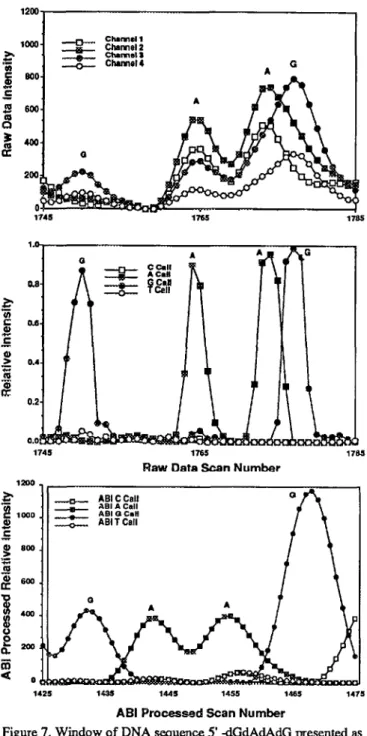
Figure 7 illustrates the significantly different manner in which the raw photometry data of the ABI sample data files are handled by our neural network signal conditioner and by the ABI-proprietary, basecalled display transform. The four oligomers of the sequence 5’-dG-dA-dA-dG-3’ in the neural network transform (middlepanel) superimpose on the p.’+tently non-uniform spacing of these oligomcrs in the raw data streams (upper panel). The ABI display transform of the same data (lower panel, ABI-modified scale of scan numbers) presents these oligomers with nearly equal spacing. A cursory examination of raw and processed data streams, from other automated sequencers and densitometric film scanners,
1200 .
~
800, Channel 1 Channel 2 Channel $ Channel 4 600, 400. 2O0 1745 G 1765 1785 1.0 0.8-01r" 0.6. G) > o.4 0,2. o.ol ~ 1745 1200~" .---o--- ABI C Call o/I~
ABI A Call
1000 ~ AB, G C.. ,~ ,.---o.-- ABI T Call
>~ s0o
2oo
o
1425 14.35 1445 1455 1465 1475
ABI Processed Scan Number
Figure 7. Window of DNA sequence 5’ -dGdAdAdG presented as streams of raw ABI 373ATM sequencer data (upper panel), trans-formed data from the signal conditioning neural network (middle panel), and transformed data from the ABI-processed data blocks (lower panel). The exlraordinary difference of separations of the -dG-dA- and the -dA-dG- oligomer pairs is evident in the raw and neural network processed traces. The -dG ladder is overall acceler-ated with respect to the-dA ladder. The ABI processed traces appear more uniform, following "correction" for dye-mobility artifacts. suggests that it is a common practice to Iransform raw data to more uniformly interleaved arrays ofoligomer signals. In part this may reflect algorithms in place to ensure proper registry of parallel lanes in single label systems. The benefits of more secure sequence order and aesthetic display may be at the cost of the informative, systematic oligomer separations.
Future Work
We have two long range goals for refinement of the prototype neural network signal conditioner. The first is to provide greater basecalling accuracy from existing archives ofAB1373ATM-generated data. The second goal is to extract the biochemicaUy and biophysically interesting parameters of separations and intensities from these sequence f’des, providing a significant database for detailed sequence -structure - function studies of DNA.
Our neural network software can be implemented in hardware, as processor beards or dedicated chips, in order to rezliT~e increased accuracy and throughput in automated DNA sequencing. This would provide a practical basis for the data handling interfaces required by the next generation of sequencing platforms.
We are developing second stage software for basecalling, a neural network which translates the feature table of informative parameters generated by the signal conditioner, into DNA sequence files. When both modules are completed and fully interfaced, an evaluation of the performance of pattern recognition basecalling will be undertaken. This first requires simple assessment of basecalling errors from a collection of samples with known sequences. Second, the large-scale assembly process will be evaluated, using sequences generated by our two-stage neural networks. For this purpose we have downloaded over 1000 ABI sample data files for this analysis, representing a sequenced yeast cosmid clone (about 43 Kbp) from the Stanford University Yeast Genome Project.
This work has revealed features of data acquisition and data structure which are unique to the ABI DNA sequencing system and reagents. Nevertheless, the foundation of pattern recognition for automated basecalling appears to be generic. Other platforms, including new systems under development, should benefit from adaptation of our approach. Thin gels and capillary array sequencers can accelerate the presentation of raw sequencing data for basecalling by at one to two orders of magnitude. On-line, accurate basecalling software for these instruments will enhance performance, and will be an essential core component of their operating systems.
The raw data product of automated DNA sequencers is a complex, but highly informative image of sequencing ladders. Optical computing techniques are ideally suited for this type of classification problem (Abu-Mostafa, Y. S. and Psaltis, D., 1987; Casasent, D., 1991). We have undertaken a research collaboration to explore genomic applications of this technology, in particular for high speed, pattern recognition-based basecalling. Archives of ABI sample data files are processed with our signal conditioner to generate pseudofluorogram ladder images as input for analysis with an Optical Correlator developed by Teledyne Brown Engineering (TBE, Huntsville, AL; Temmen and Hester, 1990). Correlation analysis and sequence determination can be performed with these images, using holographic filters for specific sequence elements. The intrisically parallel and nearly instantaneous feedback of the correlator will support these very large-scale, high-speed data acquisition challenges of the future.
Conclusions
1) A neural network can be used as an effective signal conditioner for processing the raw data generated by an automated DNA sequencer.
2) The prototype signal conditioning neural network can extract multiple informative parameters from the image data generated by the sequencer, and support a pattern recognition-based determination of DNA sequences on-line.
3) A two stage model of neural networks, for signal conditioning and pattern classifications of DNA sequences, can be implemented with contemporary instruments. The model can support the data processing required by higher performance sequencing instruments now under development.
4) The relative intensities of oligomers in the sequencing ladders provide information for the sequence determination, and for analysis of the biochemistry of DNA synthesis in
vitro.
5) Relative oligomer separations are informative with regard to determination of DNA sequences. One determinant of separations is based upon neighboring nucleotide interactions, at the 3’ends ofoligomers undergoing sequencing gel electrophoresis. The specific fluorescent dyes used in the ABI sequencing system mask some of these effects and exacerbate others.
Acknowledgments
We appreciate the enthusiastic cooperation of the members of the Stanford University Yeast Genome Project, including David Botstein, Ron Davis, John Mulligan, Michael Walker, Kevin Hennessey (now at Applied Biosystems, Foster City, CA), and George Hartzell (now at Department of Computer Science, University of California at Berkeley). Thanks also to Dr. Alvin Strauss, Chair of Mechanical Engineering at Vanderbilt University, who has contributed to the success of this project from the very beginning.
References
Abu-Mostafa, Y. S. and Psaltis, D. (1987) Optical Neural Computers,
in Scientific American 256, 88-95.
Ansorge, W., Sproat, B., Stegemarm, J., Schwager, C. and Zertke, M. (1987) Nucleic Acids Res. 15, 4593-4602.
Bean, C. P. and Hervet, H. (1983) Biophys. J. 41, A289. Bean, C. P. and Hervet, H. (1983) Bull. Am. Phys. Soc. 28, 444. Beck, S. and Pohl, F. (1984) EMBO Journal 3, 2905-2909.
Bloom, L. B., Otto, M. R., Beechem, J. M. and Goodman, M. F. (1993) Forthcoming.
Bowling, J. M. (1992) Ph.D. Dissertation, Vanderbilt University, NashviUe, TN. March 1992.
Bowling, J. M., Bruner, K. L., Cmarik, J. L. and Tibbetts, C. (1991)
Nucleic Acids Res. 19, 3089-3097.
Casasent, D. (1991) Photonics Spectra, 134-140, November-91. Cormell, C., Fung, S., Heiner, C., Bridgham, J., Chakerian, V., Heron, E., Jones, B., Menchen, S., Mordan, W., Raft, M., Recknor, M., Smith, L., Springer, J., Woo, S. and Hunkapiller, M. (1987) BioTechniques 5, 342-348.
Echols, H. and Goodman, M. F. ( 1991 ) Ann. Rev. Biochem. 60, 477-.511.
Edmondson, S. P. and Gray, D. M. (1984) Biopolymers 23, 2725-2742.
Hervet, H. and Bean, C. P. (1987) Biopolymers 26, 727-742. Hindley, J. (1983) DNA Sequencing, in Laboratory Techniques in
Biochemistry and Molecular Biology (T. S. Work and R. H.
Burdon, eds.) Elsevier Biomedical Press, Amsterdam. Huang, X. C., Quesada, M. A. and Matties, R. A. (1992) Analytical
Chem. 64, 967-972.
Innis, M. A., Myambo, K. B., Gelfand, D. H. and Brow, M. A. D. (1988) Proc. Natl. Acad. Sci. USA 85, 9436-9440.
Jensen, M. A., Zagursky, R. J., Trainor, G. L., Cocuzza, A. J., Lee, A. and Chen, E. (1991)DNA Sequence,.
Joyce, C. M., Sun, X. C. and Grindley (1992) J. Biol. Chem. 267, 24485-24500.
Kanlbara, H. and Takahashi, S. (1993) Nature 361,565-566. Kristensen, T., Voss, H., Schwager, C., Stegeman, J., Sproat, B. and
Ansorge, W. (1988) Nucleic Acids Res. 16, 3487-3496. Lerman, L. S. and Frisch, H. L. (1982)Biopolymers 21, 995-997. Luckey, J. A., Drossman, H., Kostichka, A. J., Mead, D. A., D’Cuhna, J., Norris, T. B. and Smith, L. M. (1990) Nucleic Acids
Res. 18, 4417-4421.
Lumpkin, O. J. and Zimm, B. H. (1982) Biopolymers 21, 2315-2316. Pao, Y.-H. (1989) Adaptive Pattern Recognition attd Neural
Networks. Addison-Wesley, New York.
Pao, Y.-H. and Khatibi, F. (1990) United States Patent 4,979,126. Prober, J. M., Trainor, G. L., Dam, R. J., Hobbs, F. W., Robertson,
C. W., Zagurski, R. J., Cocuzza, A. J., Jensen, M. A. and Baumeister, K. (1987) Science 238, 336-341.
Sanger, F., Nicklen, S. and Coulson, A. R. (1977)Proc. Nail. Acad.
Sci. USA 74, 5463-5467.
Smith, L. M., Sanders, J. Z., Kaiser, R. J., Hughes, P., Dodd, C., Cormell, C. R., Heiner, C., Kent, S. B. H. and Hood, L. E. (1986)
Nature 321,674-679.
Swerdlow, H. and Gesteland, R. (1990) NucleicAcidsRes. 18, 1415-1419.
Tabor, S. and Richardson, C. C. (1987) Proc. Natl. Acad. Sci. USA 84, 4767-4771.
Tabor, S. and Richardson, C. C. (1989) Proc. Natl. Acad. Sci. USA 86, 4076-4080.
Tabor, S. and Richardson, C. C. United States Patent No. 4,962,020: October 9, 1990.
Temmen, M. and Hester, C. (1990). SPIE Proceedings 1215, 422-431.
Tibbetts, C. and Bowling, J. M. (1991). United States Patent Application, pending.
Tibbetts, C., Bowling, J. M. and Golden, J. B. III (1993). Chapter included inA utornated DNA Sequencing and Analysis Techniques
(J. Craig Venter, Ed.) Academic Press.
Toneguzzo, F., Beck, J., Cahill, P., Ciarkowski, M., Page, G., Glynn, S., Hungerman, E., Levi, E., Ikeda, R., McKermey,K., Schmidt, P. and Danby, P. (1989)BioTechniques 7, 866-877.