SURFACE
SURFACE
Syracuse University Honors Program Capstone
Projects Syracuse University Honors Program Capstone Projects
Spring 5-1-2006
Credit Card Interest Rates: Does Race and Gender Matter?
Credit Card Interest Rates: Does Race and Gender Matter?
Brian HechtFollow this and additional works at: https://surface.syr.edu/honors_capstone
Part of the Economic History Commons, Income Distribution Commons, and the Other Economics Commons
Recommended Citation Recommended Citation
Hecht, Brian, "Credit Card Interest Rates: Does Race and Gender Matter?" (2006). Syracuse University Honors Program Capstone Projects. 638.
https://surface.syr.edu/honors_capstone/638
This Honors Capstone Project is brought to you for free and open access by the Syracuse University Honors Program Capstone Projects at SURFACE. It has been accepted for inclusion in Syracuse University Honors Program Capstone Projects by an authorized administrator of SURFACE. For more information, please contact surface@syr.edu.
Introduction
Consumer credit card use is an ever growing part of life in the United States. The interest rate that a consumer pays on credit transactions is the price of the credit. This paper looks at the interest rate that different card holders pay to determine if there are qualities or behaviors of the actors in the market that create an inequality for certain groups.
Do women, all else being equal, pay for consumer credit at a higher interest rate then men? Do minorities pay more then whites for credit? And if there are inequalities what are the factors that contribute to them? Are there characteristics of one group that are weighted heavier than for others? Do Hispanics pay a higher price for credit than do blacks? Are certain financial characteristics weighed differently in evaluating different groups of credit card users? Is a woman with a troubled financial past treated the same as a man with a troubled financial past?
It is important to know whether there is unevenness in the cost of using a credit card that women and minorities face for several reasons. Higher interest rates mean the cost of accumulating consumer credit card debt is higher. Because of the important role that consumer credit plays in personal finance it is important to know if there are options available to some groups that are not feasible or are more costly to other groups.
Data used comes from the 2001 Survey of Consumer Finances, which contains information on the financial characteristics of different card holders and
allows the factors that contribute to their interest rate to be evaluated and weighed.
The market for credit cards is a relationship between borrowers, who demand credit, and banks, who supply credit. Consumers demand a credit limit, which is the total amount of money they can “charge” to an account, and they demand an interest rate. Lending banks supply a credit limit and an interest rate.
To evaluate the role of race and gender I will model the factors that banks consider when offering a credit rate and the factors that borrowers consider when accepting a credit rate offer. It is a function involving the information lenders have about borrowers and characteristics that influence a borrower’s decision making process.
Unlike in other branches of borrowing and lending, such as mortgages and small business lending, race and gender are not directly observed by banks so discrimination and prejudice are not easily explainable factors to consider nor are they factors that can be explicitly proven, instead it is the presence of some market feature or characteristic about certain groups that would explain the
differences while the possibility for discrimination remains. It is possible to make inferences about an applicant based on a name, an address or a zip code, all of which can be indicators of a race or gender. Moreover, the complex behaviors of powerful banks can create conditions ripe for discrimination.
Institutional Structures
Consumers can use a credit card as a means of payment for goods and services. The lending bank pays the seller and the credit user is billed by the bank for the total amount of the purchases made with the card in a given month. If the consumer pays the full amount within a grace period, usually 25-30 days, then no interest is charged. The use of the card is basically free in this instance. This is called “convenience” usage. The card is used instead of cash, but not for the purpose of buying on credit and accumulating debt. Credit card bills usually do not require that the entire balance be paid each month however. Usually only a small monthly payment of three percent or five percent is required. The rest of the balance then becomes subject to interest charges. Lending banks make money when a borrower chooses not to pay off the entire balance at the end of a given month and then allows interest to accumulate on the debt. For this service the consumer pays in the form of the interest rate, which varies from borrower to borrower. (Russell, 1975) Credit allows consumers to make purchases and pay in installments, not needing all the money at once. Accordingly, if race and gender are factors in determining an interest rate, the price to borrow, then there are serious issues of fairness and equality in the market that would need to be addressed.
Visas and MasterCards are issued to consumers by individual financial institutions, not directly from the card company’s themselves. The individual banks make up the membership associations, which in turn own companies like Visa and MasterCard. In 2000 there were over 6,800 different issuing banks in
the United States. They independently set the rates and terms on which cards are issued (Lee and Hogarth, 2000). The scope and role of credit cards in the United States has been expanding. In 1999, over 2.8 billion credit solicitations were mailed to American consumers. Between 1994 and 1998 the amount of money that the credit card industry spent on advertising doubled from $425 million to $870 million (Manning). More and more Americans have been enticed to use credit for more and more reasons. Credit cards now play an increasingly more important role in the American economy, as in 1998 the average number of credit cards held by the average card holder was 4.1.
Traditionally different lenders competed with one another by making reductions in annual fees, those associated with being a cardholder, regardless of the number and size of transactions. In the 1990s annual fees became less relevant and the primary tool banks used to compete with each other was the interest rate (Lee and Hogarth, 2000). In recent years the market has become more concentrated, with fewer, larger creditors. In 2004, the top four credit card issuing banks controlled 64 percent of the market, led by Bank of America with 21 percent J.P. Morgan Chase with 20 percent and Citigroup with 17 percent. In 1997, the top four terms in the market had a 42 percent share. (Nader)
A lender makes a decision on how much credit, and at what credit rate, to offer based on the information in the credit application and a credit report. A typical application asks for an applicant’s name and address, the amount of time at their current residence, the applicant’s average monthly housing payment, a phone number, birthday and year, household income and employment status.
A credit report contains information on an applicant’s credit history. It tells the bank if the applicant has ever declared bankruptcy, ever been late on a credit card payment, the amount of credit cards held by the applicant and the debt history, by month, for each card the applicant holds. These are the factors that a financial institution has available to consider when offering an interest rate to an applicant. Race and gender are not on the list.
Interest rates and credit limits are offered initially in response to a credit card application. In general, interest rates are determined along with a measure of risk. Consumers who are a greater risk, more likely to default or be delinquent on a payment, are charged more for credit. (Black and Morgan, 1998) As a
consumer uses the card, develops a credit history and pays bills, the interest rate is regularly being reviewed and subject to change by the bank. A consumer’s level of risk is regularly changing as their financial circumstances change. “We earn the credit card interest rate we receive.” This is according to a newspaper column written by the president of the American Bankers Association, a banking industry group. Credit card interest rates are changed, that is credit cards are re-priced, to take into account changes in a consumer’s financial characteristics and behaviors over time. Like with car insurance, good drivers pay less than bad drivers, borrowers who represent a high risk to lenders pay more than those who are of low risk. As risk changes over time, so do interest rates. A pattern of missed payments, increased debt levels and applications for additional credit cards all tend to lead to increased credit card interest rates (Yingling, 2005).
Related Research
Previous research on these issues can be divided into two categories. One branch examines the development and structure of the market for credit cards and how banks and lenders make decisions. The second branch of research looks at the role of race and gender as factors in different financial transactions. It also addresses the possibility that there is a role for discrimination in lending markets.
The scope of consumer credit card use increased from the 1980s into the 1990s (Yoo, 1997). By 1996 the amount of outstanding consumer credit card debt reached $1,164 billion, rising nearly 12 percent a year during the mid 1990s. Consumer credit was rising to the point where analysts were concerned about individual households holding too much debt. The higher an interest rate, the quicker and more serious is the compounding of the debt.
Over the past 25 years consumer credit has “become the lifeblood of the U.S. economy.”(Manning, 2000) The growth of consumer credit has given Americans more options. Individuals have more economic freedom and are able to spend more money than they might have at any given moment. Investment in the stock market and real estate is made easier as credit cards make more money available to individuals in the short term. Workers are not tied to their jobs as tightly as they had been before, as they can survive temporary interruptions in their income, turning to credit as a source of money during tough times. Other shocks like unforeseen healthcare costs are lessened by the availability of credit.
Banks have also become more powerful in influencing the U.S. economy because of their role in supplying credit limits and credit rates (Manning, 2000).
Since the early 1980s real interest rates on credit cards have increased. The spread of credit card rates, which is the difference between a credit rate and the cost to banks of borrowing money, as determined by the Federal Reserve, has increased drastically, from 1.4 percent in 1981 to 14.3 percent in 1992. In that same time period corporate loan rates and automobile financing rates changed little. Banks have also increased their profits by increasing late fees, those charged for late payment of a minimum due balance. As interest rates overall have become higher, consumer credit has become more expensive. If, with these increases, some groups are facing even higher interest rates there is worry that this important financial tool will become too expensive or too fiscally dangerous for certain consumers.
Black and Morgan (1998) looked at the change in demographics and characteristics of cardholders as the market changed from the 1980s to the 1990s. They found that individuals entering the credit card market for the first time, new cardholders, earned less money, held more debt relative to their income and were riskier customers for lenders compared to those with established credit records. Overall, they found that with time the credit card market featured more
cardholders, with higher limits, who were borrowing more money on credit. As credit cards became more important and more commonplace in the American economy a wider range of people entered the market. The growth of the market underscores the importance of credit cards as financial tools and highlights why
charging certain groups more is disruptive to their finances and ability to succeed in the American economy.
In trying to explain the relationship between credit card debt and credit card limit, Castronova and Hagstrom (2004) modeled the relationship between borrowers and lenders as a two-stage least squares procedure, with data from the 1998 Survey of Consumer Finance. The two stages were receiving a credit limit and then using some portion of the available limit. The conventions they
followed and the assumptions they used for the paper are a good framework for understanding the behavior of financial institutions.
Castronova and Hagstrom (2004) consider a credit limit to be a function of “all information known to the individual and to the credit lending institutions through credit applications and credit reports.” There are both supply effects and demand effects working simultaneously. As they use this information to explain a credit limit, this paper will use a similar method to explain an interest rate,
looking also at the role of race and gender.
They classified the most relevant variables as being whether an individual has declared bankruptcy, whether he has been more than two months late on a payment, whether he regularly pays off an entire balance, and his occupation. Marital status and years of education were also considered. They also evaluate self employed individuals as a separate group because credit card use overlaps from consumer needs to business needs. Using the data they combined the supply and demand effects together, so as it represent all of the market forces at work in the consumer credit card market.
In addition to understanding the financial evaluation and interaction between lenders and borrowers, there is also previous literature on race and gender being factors in financial transactions. Lyons (2003) looked at changes over time in the ability of different groups to obtain a desired amount of credit. The gap between what an applicant wanted and what they were offered was wider for women in 1983 than for men. By 1998, Lyons found, the gap widened. One explanation Lyons cited for the widened gap between men and women was that men have stronger attachments to the labor force and stronger financial portfolios, making them more credit worthy.
Whites, compared to blacks, have had more success in obtaining a desired amount of credit Lyons found. From 1983 to 1998 blacks were able to reduce the gap in available credit, compared to whites. Intentional efforts to provide credit opportunities to minorities were a way of explaining this development.
Dymski (1995) traced how discrimination in certain financial areas, like employment, had a cyclical effect on the characteristics of black credit card applicants and led to them appearing less creditworthy than whites. Lower wages and lower earnings put them in a position to appear negatively to lenders.
Effectively, less money coincides with having characteristics that are less favorable to lenders.
Cavalluzzo and Cavalluzzo (1998) looked at the market for small business lending to see if there was discrimination against women or minorities. They were able to create a measurement for the amount of discrimination present. They
measured both prejudicial discrimination and statistical discrimination. They found women, blacks and Hispanics were less likely to receive a loan than white men. Overall, they found that the demand for a loan was similar across groups but that the supply was different.
Min and Kim (2003) used a tobit approach to modeling the market for debt in the credit card industry, combing characteristics of borrowers that are on both the supply and demand side of the market. Credit card debt was measured as a function of the interest rate, income, an individual consumer’s tastes on
borrowing, information on a borrower’s other liquid assets, risk tolerance and environmental factors. Lower income families are more restricted in their access to credit and thus less sensitive to increases in interest rates, they found
Theory
Race and gender are not among the explicit financial and demographic characteristics that banks consider when offering an interest rate or when evaluating an interest rate adjustment for an existing customer. However, it is still possible for race or gender to play a role in determining equilibrium market interest rates. Even though they are not explicitly a factor, banks don’t ask for them, and customers don’t base their own decisions on their race or gender, it doesn’t mean that these characteristics do not impact the market. A bank that is profit seeking would want to offer the highest rate to an applicant that he or she would accept. It is thus unlikely, and unexpected, that a bank would evaluate an application, come to a conclusion on an appropriate interest rate to offer and then
add a few percentage points out of hate or an innate feeling that the applicant’s race or gender makes him less trustworthy or reliable. It is through market forces and interactions that interest rates are determined; however there is room for inequalities or inefficiencies caused by group membership to affect the market. It is possible that some kind of inequality or discrimination exists on top of the market forces that exist in the world of consumer credit card interest rates.
With all the information in hand, banks offer and amend credit card interest rates through a constant and complex system. Credit rates and credit limits are offered by a bank based on information available to them about a credit card applicant. Information comes from a credit card application and from information in a credit report. Lenders use this information to create a credit score for an applicant and make their decisions based on the score.
The Federal Trade Commission describes a credit score as an important tool used to create an even playing field in the market for credit.
“Credit scoring is based on real data and statistics, so it usually is more reliable than subjective or judgmental methods. It treats all applicants objectively. Judgmental methods typically rely on criteria that are not systematically tested and can vary when applied by different individuals.” (FTC)
The size of the credit card market, and the number of applications lenders receive, have made automation the only feasible way to evaluate credit card applications, according to Thomas (2000). Scores are used in two ways. One is to identify the risk of a particular applicant. The second is not wholly to avoid risky borrowers, those most likely to default, but to identify the customers who are most profitable to a bank. Moreover, the automation of credit scoring is a
device used to help firms comply with the Equal Credit Opportunity Acts, federal laws passed in 1975 and 1976, which outlawed discrimination in granting credit. However, if credit scoring works as well as the FTC suggests, there would be no need to investigate inequalities in the market. Whether it be because of
discrimination or just a market inefficiency there is the possibility that some groups are victims of higher interests rate in the consumer credit card market. The automation process is not absolute. There is still room for discrimination or inequality in the market. There might be less bank competition for and in black neighborhoods, making giving banks an added edge over black borrowers that banks don’t have in neighborhoods where there is more competition. Moreover, different search techniques by certain groups might lead to them identifying themselves differently to banks, as more susceptible potential customers.
Thomas (2000) identified five categories that had traditionally gone into the judgmental approach to credit granting, before credit scoring. The factors upon which the applicant was judged were: the character of the applicant, the applicant’s capital, the applicant’s collateral, the applicant’s capacity for repayment and the condition of the market. Today the variables that go into a score are somewhat similar to the old subjective ones, but a score formula varies and is calculated in a complex and private algorithm.
A lender makes a decision on what credit rate to offer based on the information in the credit application and a credit report. Moreover, a lender is regularly reviewing the credit report and payments that current cardholders have and adjusting interest rates accordingly. A typical application asks for an
applicant’s name and address, the amount of time at their current residence, the applicant’s average monthly housing payment, a phone number, birthday and year, household income and employment status. Time at a current residence speaks to stability in an applicant’s life. Housing payments and income are indicators of ability to service a debt.
A credit report contains information on an applicant’s credit history. It tells the bank if the applicant has ever declared bankruptcy, has ever been late on a credit card payment, the amount of credit cards held by the applicant and the debt history, by month, for each card the applicant holds. These are the factors that a financial institution has available to consider when offering an interest rate to an applicant. Race and gender are not on the list. Bankruptcy, though
imperfect, is an indicator of an applicant’s level of reliability and responsibility in dealing with debt. The more cards an applicant holds the more debt the applicant is able to take on, and thus the lower the applicant’s ability to service a debt.
Credit card interest rates are the result of factors that influence the supply of credit, the interest rate a bank demands when offering a specific quantity of credit, how much the bank is selling the credit for. Also considered are factors that influence the demand for credit, the interest rate at which a consumer will accept and use a given amount of credit. The confluence of these supply factors and demand factors are important in understanding how factors, including group membership influence credit card interest rates. On the demand side, a woman who did receive a credit interest rate offer that she believes to be too high, or higher than available elsewhere, would not accept it because of the fact she is a
woman. However, other factors may lead an individual to accept and use a credit rate that is too high. It may be that one group of applicants has less formal education than another and to that end doesn’t know about all of the options available to a cardholder. It may also be that one group puts less effort or importance into obtaining or using a credit card with a given interest rate.
Because the credit card market is concentrated in the hands of a few dominant banks, the supply side of the market is very powerful. The banks have a lot of control in influencing the market. Banks are trying to make as much money as possible when offering a credit card interest rate. They seek customers who will spend money, defer paying the full amount owed and accumulate interest on their account. They do not want customers who will default on their debt and not pay them back.
Banks also adjust interest rates once a consumer is a customer. When an existing customer appears to be positioning himself in a way that suggests overspending or default, a lender will raise the interest rate charged. A higher interest rate will be profitable for the bank in the short run and also aims at slowing the cardholder’s spending, by making the credit more expensive. In general, riskier borrowers are charged higher interest rates to offset the cost of this risk for the bank. However, it is possible that certain groups by their nature have characteristics that lead them to appearing riskier or that, in general, banks
consider certain races or genders to carry added risk. Different group, as they might have different demand curves for credit, might also face different supply curves for credit card interest rates.
In Figure 1 below the supply and demand for credit is shown. The horizontal axis measures the quantity of credit as a share of the capacity to pay.. This is a scaled measure of an amount of credit. Credit limit would not be appropriate because as wealth increases a stable credit limit becomes less
burdensome on a payer and less risky for a lender. The vertical axis measures the interest rate, expressed as basis points above the prime rate.
The line D1 represents a demand for credit. When the interest rate is higher, an individual would demand less credit relative to their income. At a higher interest rate borrowing money is more expensive. Microeconomics says that for a normal good as the price goes up the quantity demanded goes down.
Different individuals demand credit in different ways and because of this different individuals have different demand curves for credit. Someone who just
lost their job and is in need of cash would likely be more willing to pay at a higher interest rate than someone with a lot of savings and a steady income. Some people have strong negative attitudes towards credit. They think that borrowing money is fundamentally wrong. Other individuals might have much more liberal views towards credit and are willing to spend and spend using credit without ever really have a legitimate plan or way to pay back the money. Group membership might also be a factor that shifts a borrower from one demand curve to another demand curve. Line D2 is a shift outward from D1. An individual with demand D2 is willing to pay more for a given amount of credit than the individual on D1. Someone on D2 might be poorer and in more willing to pay, might be less
educated and thus have less knowledge about the credit market, might just be indifferent towards prices or might be effected by group membership. It might be that the difference between D1 and D2 is level of education or it might be that it is the difference between a man and a woman or a white person and a black person. Consumers, in general, tend to underestimate the extent to which they will use a credit card, and for that reason consumers tend to limit the scope of their search for the best rate. (Lee and Hogarth, 2000) There may also be a
psychological dislike for rate searching that reduces the extent of the search. This search style could be differently defined amongst different groups. The consumer search for a credit card often includes examining different offers, consulting with friends and family, reviewing news articles, watching advertisements, looking at mailings and talking with independent experts. Different individuals carry out these steps to different degrees. In general, different groups may tend to execute
these searches in different ways, changing the curve for credit card interest rates demanded. There may be definable differences or unobservable differences. If search activity, on average, is lower for blacks, Hispanics or women, their demand for credit will be different than the demand of a white man; they will accept a higher interest rate for a given amount of credit. Attitudes toward credit and credit shopping can be asked, but a true measure of shopping effort and shopping skills is not measurable and thus one unexplainable reason why group membership might matter even though it is not explicitly considered by banks when offering credit and a credit card interest rate.
The demand for credit is influenced by the interest rate, characteristics of the borrower and race and gender. Borrower characteristics include age, income, attitudes towards borrowing, education and time spent shopping for the best deals, that is how much time and effort is made looking at different offers and available offers. Qd= ad+β1dR+β2dC+β3dG Where Qd is the quantity of credit demanded,
R is the interest rate demanded, C is the borrower’s characteristics that impact their demand, G is the group membership of the borrower and ad is the constant.
The supply of credit comes from the lending institutions. The supply curve for credit is upward sloping. For a normal good as the price increases the supply goes up. When credit is more profitable, more expensive, firms would offer more of it. From S1 to S2 the credit supplied shifts inward, that is at any given level of credit the interest rate would have to be higher on S2 than on S1. Banks might place different borrower on different supply curves based on the
different characteristics of a borrower. Someone with a lot of bankruptcies might face S2 over S1, that person is viewed by the bank as more of a risk than someone with a clean past. In the same way group membership could be a factor that places a consumer on curve over another. It could be because of a taste for discrimination by credit card lenders, it could be because those consumers have less options and can be manipulated more by banks or it could be that the composite of their behavior makes one group appear differently than another.
The supply of credit comes from the information that lenders have about applicants from their applications and credit reports. It includes many of the same features that impact a demand. The interest rate, characteristics of the applicant and potentially race and gender are all among the factors that influence how much credit is offered by a bank. Qs = as+β1sR + β2sC+ β3sG Where Qs is the credit
supplied, Ris the interest rate supplied, Cis the personal characteristics that are explicitly considered by a
Point 1 is an initial equilibrium, where credit supplied is equal to credit demanded and a given interest rate is in place. The other points show the effects of different groups having different demand curves or facing different supply curves. An interest rate is determined from supply factors and demand factors but it could be that a card applicant is on a worse (or better) demand curve or on a worse (or better) supply curve. An applicant can also be affected by both curves.
The credit card market is in equilibrium when the quantity of credit demanded is equal with the quantity supplied. At the equilibrium point both borrowers and lenders are satisfied with the market conditions. When demand is
stronger than the supply a market shortage exists and lenders have added power. When supply is stronger than demand a market surplus exists and borrowers have more power in the market.
If it is only that supply factors are affecting an applicant, a movement occurs from point 1 to point 2. Because some supply forces are at work, this applicant would now have access to less credit, and at a higher interest rate Likewise, if it is the cardholder has the characteristics that lead to the higher demand, they would end up with more credit and at a higher interest rate: a movement from 1 to 4. If it is supply and demand together, the cardholder is at point three, more credit at a higher interest rate. This is relevant because it interest rate differences can be caused by only demand factors: borrowers behave differently, only supply factors: borrowers are treated differently or by supply and demand factors both causing changes in the interest rate. Which one of these three categories cause an interest rate to be changed between groups cannot be isolated in a reduced form equation. Supply effects cannot be separated from demand effects.
bank and Grepresents group membership, as it is effected on the supply side. By setting Qs =Qd market equilibrium can be found. Moreover, by rearranging both sides of the equation the interest rate can be calculated, in a reduced form, as a function of the supply and demand effects of the other characteristics, the supply of credit and of group membership. Solving for the interest rate:
(1) R = [as-ad + (β2s -β2d )(C) + (β3s –β3d )(G)]/ (β1s-β1d),
where R is the equilibrium interest rate.
This reduced form equation suggests an estimating equation for credit card interest rates in the form:
(2) R BiCi M BjRacej e j N i + + + =
∑
∑
= =1 1 α ij (3) R= +∑
iN BiCi+BjGenderj+e =1 α ijIn equation (2) and (3) the credit card is a linear function of personal and local market characteristics, plus race and gender. The error term, e ij, reflects random effects not observed by the econometrics.
Supply and demand effects working together result in different interest rates for different groups, while controlling for relevant supply and demand factors. Specifically, are race and gender factors that influence a credit card interest rate that a consumer has? All else being equal do men have lower interest rates then women? Do women have lower interest rates then men? All else being equal do blacks pay more for credit then do whites? Do Hispanics?
In equations (2) and (3) βj is the coefficient for group membership, be it race or gender. In theory, since banks don’t officially consider group membership and consumers would want the lowest interest rate possible regardless of group membership, then βj should be zero. It should not matter. This leads to a null hypothesis that βj is zero and an alternative hypothesis that it is not.
H0: βj = 0 H1: βj ≠0
If Bj is not significantly different from zero then the null hypothesis is supported
by the evidence; group membership is not a factor. If it is not statistically significant from zero then the alternative hypothesis cannot be rejected; group membership is a factor.
Method
The reduced form equation allows the credit card interest rate market to be modeled using relevant data, the information that banks have about borrowers when determining an interest rate and the characteristics of individuals that influence their behavior in the credit card market. Using household level data, I estimate equations (2) and (3) to see if group membership is a factor in the interest rate charged on a consumer’s credit card. Moreover, I estimate the weights applied to see if different groups are treated differently when an interest rate is determined.
A credit card interest rate is a censored variable. An interest rate can never be negative so it is not continuous or normally distributed around zero. To account for this distribution, I use a tobit model to estimate equations (2) and (3). A tobit model accounts for the significant jump in occurrences after zero for the independent variable. This is true here for interest rates are never negative and thus start only above zero. Tobit finds an index function for the relevant variable and fits it into a normal function (Ramanathan, 2002).
Previous work on modeling the credit card market has used both linear and non linear forms (Thomas, 2000). Both methods have yielded similar results,
although they both have been sensitive to variables that are too strongly correlated with one another. Researchers have successfully used household characteristics and linear regressions to evaluate different aspects of the market.
Castronova and Hagstrom (2004) model the market for credit limits using a tobit procedure. They posit that the supply of a credit, measured as a consumer’s credit limit, is a linear function of income, age, occupation, time at current job, level of education, total current credit card indebtedness, past bankruptcies and race and gender. These were the characteristics available to them that they used to replicate the decision making process that banks undergo. They did not have credit scores so they effectively created their own based on the information available. My study uses a similar set of control variables, adopting Castronvoa and Hagstrom’s approach to credit score determinants. My covariates are income, age, employment status, years at a current job, years of education, marital status, total amount of credit card debt, past bankruptcies, whether a consumer owns their own business, whether the consumer owns their own home, variables about attitudes on borrowing and about effort put into shopping for credit. I discuss each of these below. .
Income determines a borrower’s capacity to service his debt. A higher income makes a default less likely and the need of a bank to offset the risk with a higher interest rate is reduced (Black and Morgan 1998). Income, I predict, will have a negative coefficient, because higher income suggests lower credit risk.
Age, I predict, will carry a negative coefficient also. In general, older people can be considered more stable and more dependable; although the older
someone gets the more opportunities they have to sour their credit record, so age is not a perfect indicator of credit worthiness. Older people have earned more extensive credit histories and therefore their behavior is easier to predict.
An applicant’s time at a current job attests to financial stability. A long time at one’s job suggests that a credit applicant is less of a risk to lose a job or for there to be major changes to an applicant’s financial status. More stability suggests less risk and thus a lower interest rate.
Education level I also predict to have a negative coefficient. More educated individuals will understand the market better and be expected to make better more informed decisions about their interest rate.
I predict that total indebtedness will have a positive coefficient. That is, with more credit card debt comes a higher interest rate. More debt means speaks to both a borrower’s behaviors and a borrower’s ability to pay.
Past bankruptcies, I predict, will also have a positive coefficient.
Borrowers who have a checkered past, have declared bankruptcy, will be viewed as a higher risk than someone who has not declared bankruptcy.
An applicant who owns his or her own business, I predict, will have a higher interest rate because their resources are being stretched further and the risk involved in operating a business is usually perceived to be rather high. The possibility that the business would fail and the debt can be serviced is an added danger of these individuals.
Borrowers who own their own homes are likely to be considered more dependable and more stable customers and I expect they will receive lower
interest rates on for their credit cards. Home owners are tied to a location from which they can be contacted by creditors and expected to lose more by defaulting.
Likewise, I expect that those with more realistic attitudes towards
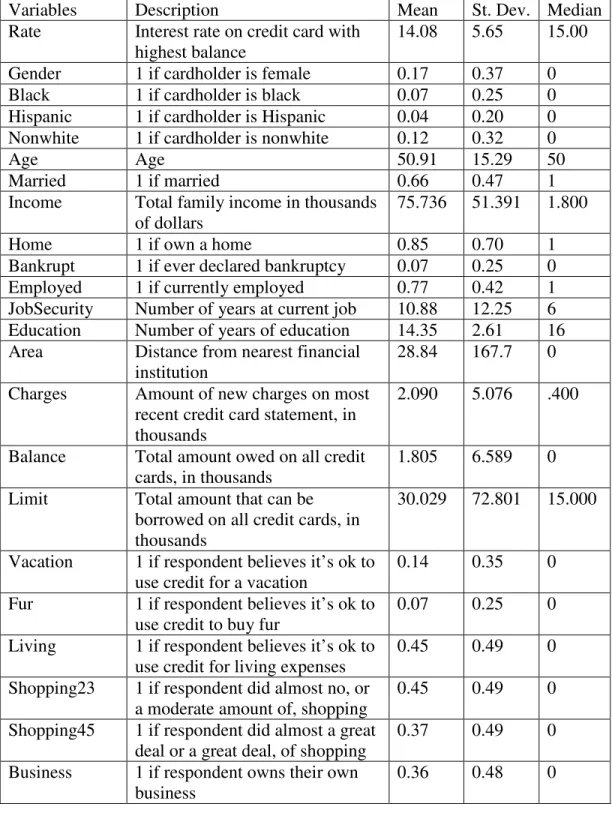
borrowing, who shop more, will receive lower interest rates than those who shop less and have poor attitudes about credit. A summary of all the relevant variables as well as their means, standard deviations and medians is in appended Table 1.
The reduced form equation of the market for interest rates encompasses the personal characteristics of a credit card applicant and the factors that lead to them to using a credit card with a given interest rate. These are the ‘C’
characteristics in equation (2). Age, income and level of education are factors that influence the decision making process of an applicant. Local market characteristics, such as level of competition among local banks, may also be important in determining a consumer’s interest rate, however, zip codes,
neighborhoods and addresses are not available in the public data set. The distance an applicant lives from the nearest financial institution is an indicator of the ability of a consumer to compare rates.
An applicant who “shops around” more for a credit card would also be expected to have a lower interest rate than similar individuals who do not. The equation includes variables that measure the amount of shopping that an applicant claims to do, ranging from very little to a great deal of shopping. The more shopping that goes on the lower the rate would expected to be.
Individuals also have different attitudes on credit borrowing and thus would borrow in different ways. Some people would borrow only under the most
dire circumstances, while others would fund a vacation or a luxurious fur coat with credit. The circumstances under which a consumer seeks a credit card would be an impact on the consumer’s demand curve. The equation includes variables that measure how a borrower classifies his or her feelings about credit.
Race and gender could also be characteristics that impact the thinking and behavior of an applicant. Recognizing a name as being a man’s name or a
woman’s name, being a Hispanic name or being a name that is traditionally African-American is one way that race or gender could impact an interest rate.
There are two ways I can evaluate the market. First, a tobit regression is executed, looking at all of the applicants in the data sample, and using the variables listed above, including race and gender. If race and gender carry statistically significant coefficients there is evidence that these groups are paying higher rates, all else equal. Second, I will estimate the interest rate tobits
separately for each race and gender. This procedure allows me to show which characteristics are weighted differently or potentially prejudicially by banks.
I hypothesize that despite that fact that banks don’t explicitly consider race and gender and that individuals should all want the lowest possible rate, holding all else constant, women and minorities have higher credit card interest rates than do men and whites. This would be due to different demands and supplies
working together simultaneously to create a different market equilibrium for the different groups.
Specifically, I estimate the following regressions: (4) = +
∑
N= i R 1 α βiCi + ei (5) = +∑
= +∑
M= j N i BiCi R 1 1 α βj Racej + eijwhere R is the interest rate, a is the constant, C is all the demographic and financial characteristics known to the lender and the borrower, with the (β) representing the coefficient and e is the error term.
A second way to look at the data is to divide the sample into groups and look at the specific characteristics that banks consider. We can use these estimates to show whether or not there is a different treatment of a particular group. The first series would have one group comprised of males, the second comprised of females. The variables in the regression include all of the relevant financial and personal characteristics listed above, except for race and gender. The two regressions should produce consistent coefficients if personal
characteristics are weight the same for both genders. Income should have the same impact on a woman’s interest rate as it does on a man’s interest rate. Likewise education, age, job status and credit history should all be the same for men and women. The betas, if gender were not to matter, should be the same for each variable in the regression. Differences in the betas suggest that a given financial or demographic characteristic is weighed differently when looking at men or women. The same procedure is applied to evaluate difference for different races.
To see if the differences in treatment come from measurable characteristics or from immeasurable and unexplainable differences in the
coefficients a Oaxaca Decomposition is used. The Oaxaca procedure shows if the interest rate differentials between groups are due to differences in previous
behavior and endowments, like more wealth, more education and less
bankruptcies, or from some type of unexplained discrimination, represented by differences in coefficients. (Oaxaca and Neuman 2005)
To execute the Oaxaca Decomposition, I compare two groups to each other. I run one tobit for males and one for females, then subtract the female results from the male results. This separates the explained from the unexplained and shows which characteristics may lead to differences in treatments.
R males-R females=
(am + βm Cm) - (af + βf Cf ) =
βm (Cm - Cf) + (am - af) + (βm-βf) (Cf)
The first part of the last equation is the explained portion, measuring the part of the interest rate that can be explained by differences in personal characteristics. The second part is the unexplained portion. Interest rate variation is coming from different treatments to the same characteristics. If each group were treated the same way then the results of subtracting the coefficients should be negligible, effectively zero.
The possibly discriminatory differences are where the policy significance lies. If different interest rates exist because groups have different observable and measurable characteristics the credit card industry. However, if it is unobservable and discriminatory that suggests that being a member of a group, a race or gender, is correlated with having to pay more for consumer credit. If the same
characteristics are weighted differently by race or gender then there is the possibility of discriminatory practices.
Data
The data for this paper comes from the 2001 Survey of Consumer Finances (SCF). It is a triennial survey of households conducted by the Federal Reserve Board in cooperation with the Statistics of Income Division of the Internal Revenue Service (Bledsoe, 2003). The data was gathered through interviews with about 4,400 families between June and December of 2001. The sample was selected from two groups, one a random sample based on geographic area, another a random sample based on wealth, selecting more families of higher wealth.
The sampling was done in two parts because of the uneven distribution of assets in the United States. Wealthier families hold more assets and to account for this difference they are included in a higher proportion than poorer families. Additionally, the absolute wealthiest Americans, those listed in the Forbes list of 400 wealthiest Americans, are excluded from the sample because their privacy could not be ensured. Table 1 includes Variable names, descriptions, means and standard deviations (for credit card holders).
The most recent survey was conducted in 2004 but those results were not publicly released soon enough for this project. The data in the survey is based on the responses of those questioned. There is no guarantee that the responses are entirely accurate or that the responses included the entire scope of the information
available to banks in a credit report. The respondents could intentionally or accidentally give inaccurate responses to the questions, however, a multiple input technique was developed to deal with inaccurate responses, non- responses and imputation errors. The SCF data is five times larger then the actual sample. The SCF essentially includes made up respondents based on the results of the survey. Accordingly, there are some 22,000 responses in the survey data of the 4,400 original families.
Regression results come from tobit operations carried out using the Stata 9 software program.
Results
The tobit results were unambiguous and consistent for several different evaluations of interest rates in the credit card market. Gender carried a negative coefficient. That is, all else equal, being a woman leads to a lower interest rate then a man. However, the statistical significance of those results were mixed. Some T-values, I in differently formed regressions, were higher then others, but they were regularly negative. The results for race tell a different story. Blacks, all else equal were found to have higher interest rates then whites. The coefficients for black were positive and significant in all of the tobit regressions. Hispanics, like women, had negative coefficients, lower interest rates, but the results were not statistically significant in several of the regressions.
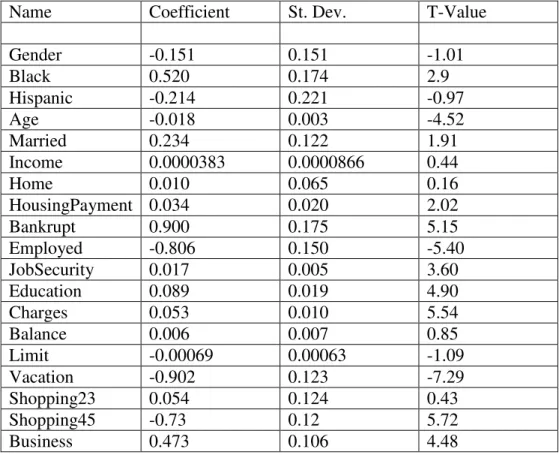
The results when regressing all of the variables individually were mixed and somewhat inconsistent with intuition. These results are listed in Table 2.
However, by replacing the income and credit limit variables with a scaled
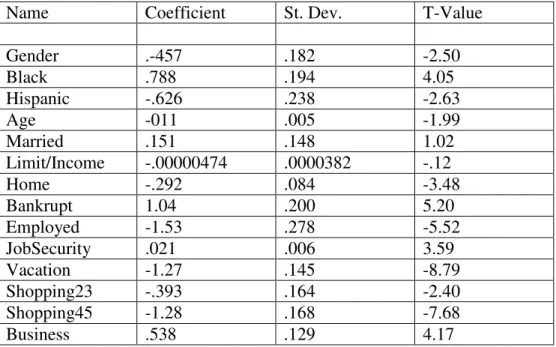
measure of ability to service debt, credit limit divided by income, more reasonable and expected results followed. These results appear in Table 3. Removing some of the variables, because they are overly related to each other or because they aren’t properly relevant, provides more meaningful results. More significant, but similar results are listed in Table 4, which excludes more variables.
Older people, who own homes and are employed had lower interest rates. Individuals who carried higher balances on their credit cards and had more new charges had higher interest rates. Cardholders who had declared bankruptcy in the past also had higher interest rates. Married people had higher interest rates then non-married. One explanation might be that married people, holding income constant, have less disposable income then non-married people. The same
income has to go farther and thus they are less able to service their debt.
Cardholders with higher housing payments also had higher interest rates. Again, holding income constant more money on living expenses makes servicing a credit card debt higher and thus makes the borrower riskier.
The results of the attitude questions were also interesting. Respondent’s who said that they believed it was appropriate to use a credit card to finance an vacation had lower interest rates then those who said that it wouldn’t be
appropriate. One explanation might be that people who have more liberal views on the appropriateness of credit are individuals who know how to use credit properly. They have used credit well in the past, have gained good standing and continue to believe that credit use is ok. Conversely, individuals who have had
credit problems in the past are more likely to hold negative views on credit and also have higher interest rates.
Individuals who shopped more when looking for a credit card had lower interest rates then individuals who shopped less. These demand side variables yielded statistically significant results that were consistent with intuition. Respondent’s who owned their own businesses also had higher interest rates.
Income, measured in thousands of dollars, yielded a very small and insignificant positive coefficient. Credit Limit yielded a very small and insignificant negative coefficient. When the Limit/Income function was substituted for the separate variables a small, positive, insignificant coefficient followed. This suggests that the amount of money that a individual has is less important then that individual’s behavior as a borrower. A poor man who has a history of timely payment is more attractive then a wealthy man who is constantly pushing the envelope, borrowing more and paying less.
There were two surprises in the results. The JobSecurity variable and the Education variable both had positive coefficients. That is, all else equal, those with more time at their current job and more education had higher interest rates. Intuition says that more educated individuals would understand the market better and make more rationale and responsible decisions. Those with more time at their job were expected to have a more stable income and would be less likely to have a fluctuation in their lifestyle. These characteristics were expected to have negative coefficients, lower interest rates, but were positive.
Banks can easily explain why people with bankruptcies in their past have higher interest rates. They can explain why people with more total debt have higher interest rates. They are riskier borrowers. There is no explanation for why blacks would have higher interest rates just for being black.
The results of this paper suggest that discrimination can not be ruled out as a factor in the market for credit card interest rates.
This inequality in the market yields several policy implications. First, it is not known whether these circumstances are caused by demand factors or supply factors. Are blacks just more willing to accept a higher interest rate then whites? Are banks finding a way to discriminate against blacks or take advantage of them? Are all these factors working together? What is known from the results of this project is that the current market structures are not perfect and that it is allowing blacks to overpay for consumer credit cards. Accordingly, it might be necessary for some groups to reevaluate their techniques for obtaining and using credit while banks reevaluate their procedures for offering interest rates based on the relevant and appropriate financial characteristics of potential borrowers.
Bibliography
Black, Sandra E. and Morgan, Donald P. “Risk and the Democratization of Credit Cards. Federal Reserve Bank of New York. 1998.
Blanchard, Lloyd, Zhao, Bo and Yinger, John. “Do Credit Market Barriers Exist for Minority and Women Entrepreneurs?” Center for Policy Research
Working Paper No. 74. Maxwell School of Syracuse University,
December, 2005.
Bledsoe, Ryan and Fries, Gerhard. “Editing the 2001 Survey of Consumer Finances.” Federal Reserve Board
Castronova, Edward and Hagstrom, Paul. “The Demand for Credit Cards: Evidence from the Survey of Consumer Affairs.” Economic Inquiry, 42
(2) April 2004, 304-18
Cavalluzzo, Ken S and Cavalluzzo, Linda C. “Market Structure and
Discrimination: The Case of Small Businesses.” Journal of Money, Credit and Banking. 30(4) 1998, p 771-92
Dymski, Gary Arthur. “The Theory of Bank Redling and Discrimination: An Exploration.” Review of Black Political Economy, 23 (2) Winter 1995,
p.37.
Federal Trade Commission. “Facts for Consumers.” From:
<http://www.ftc.gov/bcp/conline/pubs/credit/scoring.htm> updated August 2005, Accessed November 2005.
Lee, Jinkook and Hogarth, Jeanne M. “Relationships Among Information Search Activities When Shopping for a Credit Card.” The Journal of Consumer
Affairs, 34 (2) 2000, p 330-60.
Lyons, Angela C. “How Credit Access Has Changed Over Time for U.S. Households.” The Journal of Consumer Affairs, 37(2) Winter 2003,
231-55.
Manning, Robert D. Credit Card Nation: The Consequences of America’s Addiction to Credit. Basic Books: New York, 2000.
Nader, Fouad, “The Credit Card Industry.” The Adrenale Corporation, July 2005. Oaxaca, Ronald and Neuman, Shoshana. “Wage Differentials in the 1990s in
Israel: Endowments, Discrimination and Selectivity.” International Journal of Man Power, V26, (3), 2005, 217-235.
Russell, Thomas. The Economics of Bank Credit Cards. Praeger Publishers, New York: 1975.
Thomas, Lyn C. “A Survey of Credit and Behavioral Scoring: Forecasting Financial Risk of Lending to Consumers.” International Journal of
Forecasting, 2000, p. 149-72.
Yoo, Peter S. “Charging up a Mountain of Debt: Households and Their Credit Cards.” Federal Reserve Bank of St. Louis Review, 79(2), March/April
1997.
Table 1. Descriptive Statistics of Variables
Variables Description Mean St. Dev. Median
Rate Interest rate on credit card with highest balance
14.08 5.65 15.00 Gender 1 if cardholder is female 0.17 0.37 0 Black 1 if cardholder is black 0.07 0.25 0 Hispanic 1 if cardholder is Hispanic 0.04 0.20 0 Nonwhite 1 if cardholder is nonwhite 0.12 0.32 0
Age Age 50.91 15.29 50
Married 1 if married 0.66 0.47 1
Income Total family income in thousands of dollars
75.736 51.391 1.800
Home 1 if own a home 0.85 0.70 1
Bankrupt 1 if ever declared bankruptcy 0.07 0.25 0 Employed 1 if currently employed 0.77 0.42 1 JobSecurity Number of years at current job 10.88 12.25 6 Education Number of years of education 14.35 2.61 16 Area Distance from nearest financial
institution
28.84 167.7 0 Charges Amount of new charges on most
recent credit card statement, in thousands
2.090 5.076 .400
Balance Total amount owed on all credit cards, in thousands
1.805 6.589 0 Limit Total amount that can be
borrowed on all credit cards, in thousands
30.029 72.801 15.000
Vacation 1 if respondent believes it’s ok to use credit for a vacation
0.14 0.35 0 Fur 1 if respondent believes it’s ok to
use credit to buy fur
0.07 0.25 0 Living 1 if respondent believes it’s ok to
use credit for living expenses
0.45 0.49 0 Shopping23 1 if respondent did almost no, or
a moderate amount of, shopping
0.45 0.49 0 Shopping45 1 if respondent did almost a great
deal or a great deal, of shopping
0.37 0.49 0 Business 1 if respondent owns their own
business
Table 2. Tobit: Including all Relevant Variables
Name Coefficient St. Dev. T-Value
Gender -0.151 0.151 -1.01 Black 0.520 0.174 2.9 Hispanic -0.214 0.221 -0.97 Age -0.018 0.003 -4.52 Married 0.234 0.122 1.91 Income 0.0000383 0.0000866 0.44 Home 0.010 0.065 0.16 HousingPayment 0.034 0.020 2.02 Bankrupt 0.900 0.175 5.15 Employed -0.806 0.150 -5.40 JobSecurity 0.017 0.005 3.60 Education 0.089 0.019 4.90 Charges 0.053 0.010 5.54 Balance 0.006 0.007 0.85 Limit -0.00069 0.00063 -1.09 Vacation -0.902 0.123 -7.29 Shopping23 0.054 0.124 0.43 Shopping45 -0.73 0.12 5.72 Business 0.473 0.106 4.48
Table 3. Tobit: Using a Ratio of Credit Limit/Income
Name Coefficient St. Dev. T-Value
Gender -0.446 0.182 -2.45 Black 0.825 0.195 5.46 Hispanic -0.530 0.243 -2.18 Age -0.012 0.005 -2.31 Married 0.132 0.148 0.90 Limit/Income 0.00000942 0.0000382 -0.25 Home -0.314 0.084 -3.73 HomePayment 0.041 0.019 2.11 Bankrupt 1.09 0.200 5.46 Employed -1.56 0.278 -5.63 JobSecurity 0.021 0.006 3.66 Education 0.036 0.023 1.57 Charges 0.056 0.011 4.91 Balance 0.020 0.010 1.98 Vacation -1.30 0.146 -8.96 Shopping23 -.367 0.164 -2.24 Shopping45 -1.27 0.167 -7.61 Business 0.371 0.133 2.79
Table 4. Tobit Using Limit/Income, Excluding Charges, Education and Balance
Name Coefficient St. Dev. T-Value
Gender .-457 .182 -2.50 Black .788 .194 4.05 Hispanic -.626 .238 -2.63 Age -011 .005 -1.99 Married .151 .148 1.02 Limit/Income -.00000474 .0000382 -.12 Home -.292 .084 -3.48 Bankrupt 1.04 .200 5.20 Employed -1.53 .278 -5.52 JobSecurity .021 .006 3.59 Vacation -1.27 .145 -8.79 Shopping23 -.393 .164 -2.40 Shopping45 -1.28 .168 -7.68 Business .538 .129 4.17