Booktrust Reading Habits
Survey 2013
A national survey of reading habits and attitudes to books
amongst adults in England
Prepared by: Alasdair Gleed, Research Director DJS Research Limited
Tel: 01663-767857
Email: agleed@djsresearch.com Website: http://www.djsresearch.co.uk
Table of Contents 1
Table of Contents
Executive Summary ... 2 1. Introduction ... 5 2. Reading Books ... 8 3. Enjoyment of Reading ... 14 4. Attitudes to Reading ... 20 5. Reading Preferences ... 286. Reading Through The Generations ... 32
7. Reading, Wellbeing and Deprivation... 37
Executive Summary 2
Executive Summary
Introduction
Booktrust is the UK’s largest reading charity. Booktrust believes that no-one should miss out on the life changing benefits that reading can bring. Initiatives such as the national flagship programme ‘Bookstart’ give free books to families at key stages in their children’s lives.
This report presents the results of an England-wide survey of the reading habits of 1500 adults. It examines the relationship between reading habits, attitudes to reading and demographic factors. The findings highlight the need to pursue initiatives to encourage reading (a) from an early age and (b) in disadvantaged areas.
Headline statistics
Significant minorities of adults in England have negative attitudes towards reading:
Nearly a fifth (18%) never read physical books, and 71% never read e-books.
A fifth (20%) never buy physical books at all (in a shop or online).
36% often start a book but get bored and 35% cannot find the time to read.
56% think that the internet and computers will replace books in the next 20 years, the proportion with this view rises to 64% of 18 to 30 year olds.
27% prefer the internet and social media to reading books, rising to 56% among 18-30 year olds.
45% prefer television and DVDs to reading.
However, substantial sections of the population have more positive attitudes to reading:
76% say that reading improves their life, and the same number says it helps to make them feel good.
28% of adults read physical books every day, with a further 22% reading them at least weekly.
76% prefer to read physical books, only 10% prefer e-books.
Nearly half (49%) enjoy reading books very much. A further 23% enjoy reading books quite a lot.
More than half own upwards of 50 books, with around 200 owned on average.
Reading, wellbeing and deprivation
People who read books regularly are on average more satisfied with life, happier, and more likely to feel that the things they do in life are worthwhile.
More frequent book readers tend to live in areas of lower deprivation with fewer children living in poverty, while respondents who never read books tend to live in areas of higher deprivation and more children living in poverty.
Executive Summary 3
Reading and socio-economic group
On average, the higher the socio-economic group1that someone is in, the more often they read:
27% of DEs neverread books themselves, compared with 13% of ABs.
62% of ABs read daily or weekly, compared with 42% of DEs.
Although most of those who read books say this improves their life and/or makes them feel good, this is more pronounced for higher social-economic groups:
83% of ABs feel that reading improves their life, compared to 72% of DEs.
85% of ABs say reading helps to make them feel good, compared to 69% of DEs. ABs also own more books: an average of 376, compared with an average of 156 for DEs.
In terms of attitudes to digital technology, the lower their social-economic group, the more likely people are to think that the internet and computers will replace books and to prefer TV, DVDs, the internet and social media to reading books.
While the research indicates that those who read more books have a higher socio-economic status than those who do not read, further research would be necessary to identify causality.
Reading history
There is a significant link between reading history, reading habits and reading attitudes. Respondents whose parents encouraged them to read whilst growing up read more as adults. Similarly, those who enjoyed reading at school read significantly more books now than those who did not.
In addition, 89% of respondents whose parents read to them as children read regularly to their own children, compared to 72% of respondents whose parents didn’t read to them.
Reading, demographics and the digital age
Across all age groups, women are more frequent readers than men and tend to be more positive about books. Men are more likely to admit they find reading boring and can struggle to find things to read that are interesting to them.
The groups of respondents who read least frequently are more likely to be male, aged under 30, have lower levels of qualifications and have lower levels of happiness and satisfaction with their lives.
Amongst both women and men, the over 60s read most and the 18 to 30s read least. This difference is most prominent for females: only 18% of women under 30 read every day, compared with nearly half (48%) of women over 60.
Available time is a factor; retired over 60s are likely to have more spare time to read. Other age groups (particularly 30 to 59 year olds) would like to read more but are often too busy.
1
Executive Summary 4
Technology is another factor; under 30s (especially men) are much more likely to prefer technology to reading books, often agreeing that the internet and computers will replace books in 20 years. They prefer TV, DVDs, the internet and social media to books.
The difference in views is perhaps best summarized in comments from respondents themselves. When asked why they didn’t enjoy reading, one respondent said:
“The fact that it is 2013 not 1813. We have electricity now so we can buy DVDs and watch television rather than read books. Books are for an older generation, younger people on the whole do not read books.”[Male, 30-44 years]
When asked why they did enjoy reading, one respondent said:
“I enjoyed and started at school and never stopped. A better alternative to TV as you can learn more about the characters and subjects.” [Male, 60+]
Conclusion
Overall, the research highlights four justifications for initiatives to encourage reading for pleasure from an early age, particularly among disadvantaged groups:
People who read books are significantly more likely to be happy and content with their life.
Most people who read books feel this improves their life. It also makes them feel good.
People who were read to and encouraged to read as children are significantly more likely to read as adults, both to themselves and to their own children.
Introduction 5
1. Introduction
Background and Objectives
Booktrust is the UK’s largest reading charity. Booktrust believes that no-one should miss out on the life changing benefits that reading can bring. Initiatives such as the national flagship programme ‘Bookstart’ give free books to families at key stages in their children’s lives. With over 90 years of expertise in recommending books, they run literary prizes, manage creative reading projects, and fundraise for disadvantaged children, through the Children’s Reading Fund.
In August 2013, Booktrust commissioned DJS Research, an independent research company, to carry out a quantitative research project investigating reading habits and attitudes of adults in England, and to examine the relationship between reading habits, attitudes to reading and demographic factors such as socio-economic group, age and gender.
Introduction 6
Research Methodology
DJS worked with Booktrust to develop a questionnaire covering the areas highlighted on the previous page, which took respondents around ten minutes to complete.
We carried out a nationally representative survey of adults in England by telephone; 1,500 interviews were conducted across the regions of England. We took a quota sampling approach to ensure that the sample was representative of the population and allowed for analysis by demographic group (e.g. gender, age, socio-economic group – ‘SEG’). All differences by demographics and segment highlighted in this report are statistically significant unless otherwise stated.
To add another dimension to our analysis, survey results were linked with pre-existing national data about the socio-economic situation of the area in which respondents were located (using postcodes):
The English Indices of Multiple Deprivation (IMD) which provides a relative measure of deprivation at small area level across England. Areas are ranked from least deprived to most deprived on different dimensions of deprivation (income; employment; health; education; crime; barriers to housing and services; and living environment) and an overall composite measure. IMD rank is a number ranging from 1; the most deprived to 32,000 the least deprived area.
The Income Deprivation Affecting Children Index (IDACI) which is a similar index of deprivation which measures in a local area the proportion of children under the age of 16 that live in low income households.
In order to understand how reading habits and attitudes vary amongst different types of people, a segmentation of the data was carried out using cluster analysis.
‘Cluster analysis' is a statistical technique that can be applied to data that exhibits “natural” groupings. Cluster analysis sorts through the raw data and groups respondents into ‘clusters’ or ‘segments’.
Each segment is a group of relatively homogeneous respondents that share common characteristics. They are also dissimilar to those outside the segment, particularly those in other segments. Once the segments are identified they can then be profiled in terms of their demographic characteristics.
Data was firstly segmented into four groups based on reading habits and reading frequency. These were then split further into nine segments based on attitudes to reading and ‘reading history’ (e.g. if they read as a child and their parents attitudes to reading).
The segments are briefly summarised overleaf. Reading frequency decreases across the segments with segment 1 (‘Bookworms’) containing the most frequent readers and segment 9 (‘Don’t read’) having the highest proportion of respondents who never read any formats.
Introduction 7
Segment 1: ‘Bookworms’ (6%)
Bookworms devour paperback, hardback and e-books, getting through 12 books a month. They have an average of nearly a thousand (994) books in their house.
They are more likely than average to be aged over 60 (and retired), female, and highly educated. Segment 2: ‘Love to read’ (15%)
They read 3 or 4 books per month making them the second most regular book readers.
They are likely to be from families with children, in professional B/C1 socio-economic groups and to have grown up in houses with lots of books and parents who encouraged them to read.
Segment 3: ‘The magazine generation’ (14%)
This group reads books nearly as often as segment 2 (around 3 a month) and is also most likely to read magazines.
Despite being frequent readers they do not seem to love reading books like segments 1 and 2. They are more likely than segments 1 and 2 to agree that the internet will replace books in the next 20 years.
They are more likely to be in the younger (18-44) age groups and male. Segment 4: ‘Given the chance…’ (8%)
This segment reads a couple of books a month on average, they enjoy reading books (including e-books), and many state that they would read more if they had the time.
They are particularly likely to steal a chance to read whilst on holiday or on public transport.
Likely to be married with dependent children, and female. Segment 5: ‘Joe average’ (17%)
This segment reads one or two books a month on average; they are reasonably positive about reading but less enthusiastic than segment 4 (so they lie right in the middle of the segments).
Their demographic profile is not clearly defined (also quite ‘average’) – the segment comprises a mix of genders and ages, as well as people with and without children.
Segment 6: ‘Reluctant readers’ (10%)
This segment reads nearly one book a month on average with a preference for biographies, sports and special interests/ hobbies.
They have less positive attitudes to reading in general: they are more likely than average to agree that reading is boring and hard work.
This segment has the highest proportion of males and a high proportion of 18-29 year olds without children.
Segment 7: ‘No time to read’ (10%)
This segment doesn’t read books often or have many books in their home.
Despite this they are fairly positive about reading books, and would read more given the time.
The segment includes a significantly higher proportion of females than the other infrequent reader segments, and is also more likely to contain those with dependent children.
Segment 8: ‘Don’t like reading’ (11%)
This segment don’t tend to enjoy reading books, with nearly half never reading paperback or hardback books, and nine out of ten never reading e-books.
This is a younger segment with a relatively high proportion of 18-29 year olds, and males. They are also more likely than average to be from DE Socio-Economic group.
They are also more likely to have grown up in homes where parents did not enjoy reading or encourage them to read, and to have not enjoyed reading at school.
Segment 9: ‘Don’t read’ (10%)
This segment has very low levels of reading. Three quarters do not read any books in a typical year. Many were not read stories to by their parents and did not enjoy reading at school.
They are more likely to be younger (particularly 18-29 age group) and over two-thirds are male. They are also more likely than average to be from DE Socio-Economic group, and to have no qualifications.
2. Reading Books 8
2. Reading Books
Reading Frequency
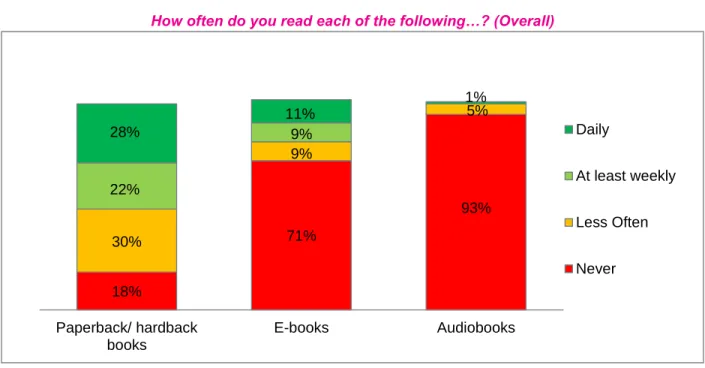
Respondents were asked how often they read/listen to books in different formats (hard copy, e-books and audiobooks) – here we focus on reading for themselves, not with their children (which is examined separately later on). The overall responses are summarized in fig. 1, below:
Fig. 1: Frequency of Reading Different Book Formats
How often do you read each of the following…? (Overall)
28% stated that they read hard copy books every day, with a further 22% reading them once or twice (10%) or several times (12%) a week. Nearly a fifth (18%) never read hard copy books.
Reading of e-books is much more limited, with 71% stating that they never read them, and even higher numbers (93%) don’t listen to audiobooks.
In total, 14% do not read any formats of books.
Fig. 2 (overleaf) examines reading frequency for hard copy books by Socio Economic Group (SEG).2
2
SEG is a classification based on occupation which allows a household to be classified according to the occupation of the Chief Income Earner. It is based on a number of questions around their occupation, the type of organisation they work(ed) for, role, job title, managerial responsibilities and qualifications. The SEG classifications are as follows:
A) High managerial, administrative or professional; B) Intermediate managerial, administrative or professional; C1) Supervisory, clerical and junior managerial, administrative or professional; C2) Skilled manual workers; D) Semi and unskilled manual workers; E) State pensioners, casual or lowest grade workers, unemployed with state benefits only.
18% 71% 93% 30% 9% 5% 22% 9% 28% 11% 1% Paperback/ hardback books E-books Audiobooks Daily At least weekly Less Often Never
2. Reading Books 9
Fig. 2: Frequency of Reading Books (Hard Copy) by SEG
This analysis suggests that the higher the SEG, the more often an individual reads books – for example 27% of DE SEGs never read books themselves, compared with 13% for AB SEGs. Conversely 62% of ABs read daily or weekly, compared with 42% of DEs.
Fig. 3 (below) looks at frequency of book reading by age group for females and males: Fig. 3: Frequency of Reading Books (Hard Copy) by Age and Gender
Across all age groups, females are more frequent readers than males. Amongst both females and males, the oldest age group reads most and the youngest age group reads least:
Amongst males, only 14% of under 30s read every day, compared with nearly 31% of over 60s.
For females 18% of under 30s read every day, compared with nearly half (48%) of over 60s.
We also carried out similar analysis to compare those with children of different ages and those without children (see fig. 4 overleaf):
13 17 27 24 31 31 28 22 20 34 29 22 0 20 40 60 80 100 AB C1C2 DE Daily At least weekly Less often Never
%
18 17 17 11 23 23 18 21 41 27 32 21 40 28 32 27 24 24 20 21 23 26 22 21 18 31 32 48 14 22 27 31 0 10 20 30 40 50 60 70 80 90 100 Aged 18-29 Female Aged 30-44 Female Aged 45-59 Female Aged 60 and over Female Aged 18-29 Male Aged 30-44 Male Aged 45-59 Male Aged 60 and over Male Daily At least weekly Less often Never%
2. Reading Books 10
Fig. 4: Frequency of Reading Books (Hard Copy) by Ages of Children
Those with children under three are the least frequent readers (bear in mind we are still looking at reading for themselves, not with children) – this may well be because they often fall into the segments that would like to read more but lack the time (e.g. segment 4 and segment 7). However, those with older children (particularly aged over 10) read for themselves more than those without any children.
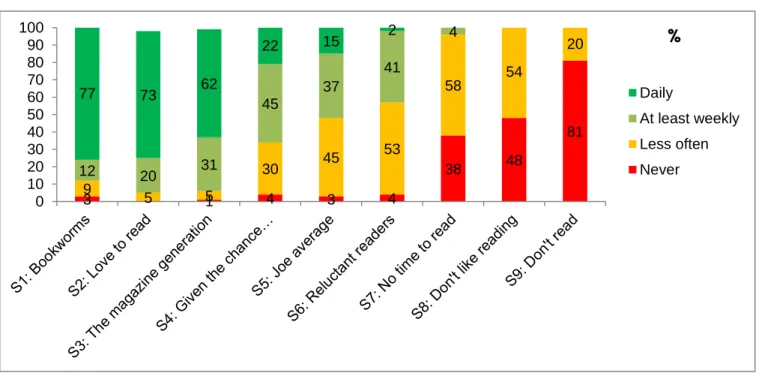
Fig. 5 (below) shows how book reading varies amongst the different reading groups and segments. At one extreme, most (77%) of segment 1 read every day, whilst 81% of segment 9 never read books.
Fig. 5: Frequency of Reading Books (Hard Copy) by Segment
Analysis of reading frequency by demographics was also carried out for e-books (listening to audiobooks was relatively low across all segments). The trends were similar to reading hard copy books, with higher SEGs reading e-books more frequently.
However, the pattern by age is slightly different: across both males and females the over 60s have lower levels of reading frequency for e-books (similar to the under 30s) and it is those aged 30 to 59 who read e-books most frequently. 20 30 18 17 36 27 29 29 24 26 27 21 20 17 26 34 0 20 40 60 80 100
No children Children under 3 Children 4 to 10 Children over 10 Daily At least weekly Less often Never
%
3 1 4 3 4 38 48 81 9 5 5 30 45 53 58 54 20 12 20 31 45 37 41 4 77 73 62 22 15 2 0 10 20 30 40 50 60 70 80 90 100 Daily At least weekly Less often Never%
2. Reading Books 11
Book Ownership
Respondents were asked how many books they have in their home. They were asked to give an estimated number, and given guidance that there are typically 40 books per metre of shelving if required. For analysis responses have been grouped into ranges. Findings are summarized in fig. 6 below.
Fig 6: Book Ownership
How many books do you have in your home? (Overall)
Over half of respondents have more than 50 books at home and the average is to have just over 200, although this is boosted by the fact that some have very large collections.
One-in-ten have ten or fewer books in the home, including 3% who have no books at all.
The analysis by demographics shows that book ownership varies according to socio-economic group (SEG), age and gender.
There is a clear link between SEG and book ownership: the ABs own an average of 376 books, compared with 156 for DEs.
Book ownership increases markedly with age, with the over 60s owning an average of over 300 books, compared to 18-29 year olds who own an average of 137.
Females tend to own more books on average than males (229 compared with 181).
Unsurprisingly, book ownership and propensity to purchase different formats of books varies greatly by reading group and segment, with the more prolific readers owning and purchasing more books. See fig. 7 overleaf for book ownership by segment.
3% 7% 27% 19% 20% 11% 5% 9% 0 1-10 11-50 51-100 101-250 251-500 501+ Don't know
Overall average
= 2032. Reading Books 12
Fig. 7: Average Number of Books In Home by Reading Segment
994 252 267 128 113 148 81 73 57 0 200 400 600 800 1000 Average no. books in home
2. Reading Books 13
Buying Books
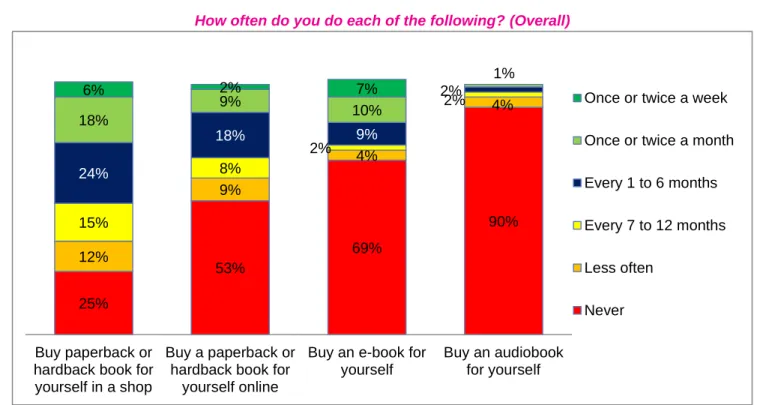
Respondents were also asked about their propensity to buy different formats of book. Responses are summarized in fig. 8 below:
Fig. 8: Buying Books
How often do you do each of the following? (Overall)
Just under a quarter (24%) buy a physical (paperback/hardback) book in a shop at least once a month; this compares with just over one-in-ten (11%) who buy books online every month. A quarter never buy physical books in shops and this rises to 53% for online purchases. In total, 16% never buy books in any of the listed formats. The AB socio-economic group is most likely to purchase physical books both in a shop (31%) and online (20%). Propensity to buy in a shop increases with age, but for online purchases this trend is reversed, with the over 60s least likely to buy books over the internet. Males are less likely than females to buy in a shop, although online purchasing levels are similar for both genders.
For e-books and audiobooks, differences by demographics are less marked, particularly for audiobooks where purchasing is relatively flat across segments.
The AB SEGs, females and those aged 30 to 59 are more likely than average to purchase e-books. 25% 53% 69% 90% 12% 9% 4% 4% 15% 8% 2% 2% 24% 18% 9% 2% 18% 9% 10% 1% 6% 2% 7% Buy paperback or hardback book for yourself in a shop
Buy a paperback or hardback book for
yourself online
Buy an e-book for yourself
Buy an audiobook for yourself
Once or twice a week Once or twice a month Every 1 to 6 months Every 7 to 12 months Less often
3. Enjoyment of Reading 14
3. Enjoyment of Reading
Do People Enjoy Reading Books?
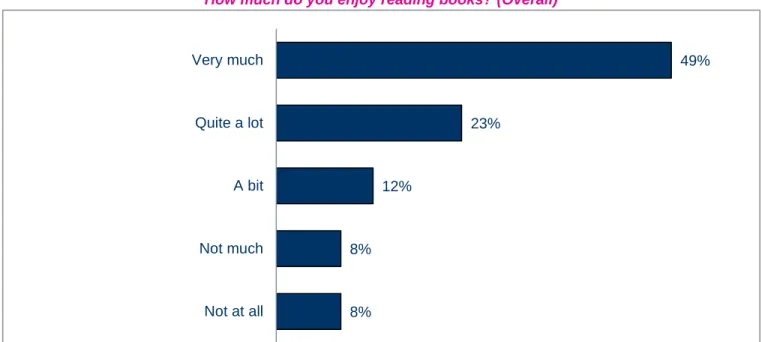
Respondents were asked how much they enjoy reading books (on a scale from ‘very much’ to ‘not at all’). The overall response is summarised in fig. 9 below:
Fig. 9: Enjoyment of Reading Books
How much do you enjoy reading books? (Overall)
The overall picture is quite positive, with nearly half of respondents (49%) stating that they enjoy reading ‘very much’, and a further 23% stating that they enjoy reading ‘quite a lot’.
Over a quarter (28%) is less positive, in particular the eight percent that do not enjoy reading at all.
There are significant differences in opinion by demographic group and also by the reading segments. These differences are examined overleaf.
Figure 10 (overleaf) shows how enjoyment of reading books varies by socio-economic group (SEG). 49% 23% 12% 8% 8% Very much Quite a lot A bit Not much Not at all
3. Enjoyment of Reading 15
Fig. 10:Enjoyment of Reading Books by SEG
The AB SEG is most positive about reading with a total of 85% stating that they enjoy reading either very much or quite a lot. Conversely, the DE SEG is least positive with 63% stating that they enjoy reading either very much or quite a lot. The C1C2s lie in the middle ground in terms of reading enjoyment as well as socio-economic group. Fig. 11 (below) shows a similar analysis, this time by age and gender.
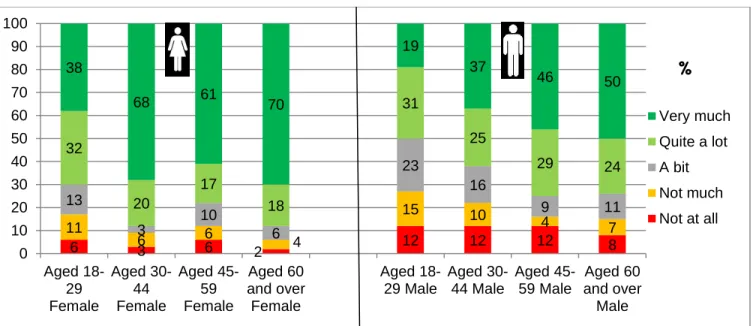
Fig. 11:Enjoyment of Reading Books by Age and Gender
It is immediately apparent that females are more positive than males across age groups. Taking the over 60s age group as an example: 88% of female over 60s enjoy reading very much or quite a lot. This compares with 74% of male over 60s who enjoy reading very much or quite a lot.
With males, enjoyment of reading appears to increase with age, with only half of males aged 18-29 stating that they enjoy reading very much or quite a lot. With females the trend is not apparent although the youngest segment is least positive.
Fig. 12 (overleaf) shows how reading enjoyment varies by the different reading segments.
3 7 11 4 8 8 9 11 17 24 25 22 61 49 41 0 20 40 60 80 100 AB C1C2 DE Very much Quite a lot A bit Not much Not at all
%
6 3 6 2 12 12 12 8 11 6 6 4 15 10 4 7 13 3 10 6 23 16 9 11 32 20 17 18 31 25 29 24 38 68 61 70 19 37 46 50 0 10 20 30 40 50 60 70 80 90 100 Aged 18-29 Female Aged 30-44 Female Aged 45-59 Female Aged 60 and over Female Aged 18-29 Male Aged 30-44 Male Aged 45-59 Male Aged 60 and over Male Very much Quite a lot A bit Not much Not at all%
3. Enjoyment of Reading 16
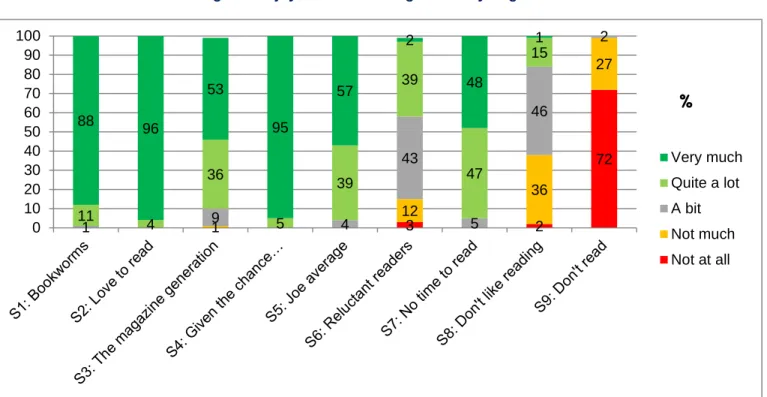
Fig. 12: Enjoyment of Reading Books by Segment
There is a clear trend towards the more regular readers enjoying reading more. However, it is also interesting to note that the link between enjoyment and frequency of reading books is not clear cut:
The two segments (4 and 7) that struggle to find the time to read are more positive than their frequency of reading would suggest.
Conversely the ‘Reluctant readers’ (segment 6) and ‘Magazine generation’ (segment 3) are less positive than their frequency of reading would suggest.
In the next section we examine some of the reasons behind why people do or don’t enjoy reading.
Reasons For Enjoying/ Not Enjoying Reading Books
After indicating the extent to which they enjoy reading books, respondents were asked a free response question: ‘why do you say that’? The reasons they gave have been grouped into themes which are summarized in fig. 13, overleaf (the percentages should be treated as approximate as they have been manually calculated from counting the comments). 3 2 72 1 12 36 27 1 9 4 43 5 46 2 11 4 36 5 39 39 47 15 88 96 53 95 57 2 48 1 0 10 20 30 40 50 60 70 80 90 100 Very much Quite a lot A bit Not much Not at all
%
3. Enjoyment of Reading 17
Fig. 13: Main Reasons Given For Enjoying / Not Enjoying Reading
Why do you say that’? (Overall, main reasons given) Enjoying Not enjoying
When asked why they enjoy reading, more positive respondents tended to make reference to reading books as a pleasurable activity that gives them the chance to relax, escape and learn.
Those who are less positive tended to state they either lack the time to read, find it boring, or simply enjoy other activities more.
Outside of these a range of other reasons were given by a small proportion of respondents, for example:
One percent said they like finding out about other people’s lives.
One percent said that reading helps them to sleep.
One percent stated that they don’t enjoy reading because they are dyslexic.
We examined how these views vary amongst the different reading segments. Whilst some differences were unsurprising, for example the ‘Don’t like reading’ and ‘Don’t read’ segments were much more likely to cite boredom and enjoying other activities more, others are more nuanced. For example the ‘Given the chance’
segment - who we saw earlier would like more time to read, and steal opportunities to do this on holiday and public transport - are more likely than average to mention the escapism and therapeutic aspects of reading.
21% 17% 15% 11% Escapism, lose yourself Relaxing, therapeutic Educational / learn
Enjoy for its own sake
6%
5%
5% Don't have time
Enjoy other activities more
Boring / lack patience/ concentration
3. Enjoyment of Reading 18
Some examples of the types of comments people made about why they do or don’t like reading books are provided below:
Escapism:
Relaxing:
Educational:
Enjoy for its own sake:
“I can switch off from everything which is essential as a single parent; I lay down with a book and I'm lost.” (S2: Love to read, Female, 30-44 years)
“It takes me to places I could never go!” (S1: Bookworms, Male, 60 and over)
“It's time for myself, it takes me away.”
(S4: Given the chance…, Female, 45-59 years)
“It's a chance to escape. If you have something on your mind and you pick up a book and start reading, then it just disappears.” (S2: Love to read, Female, 30-44 years)
“I find it relaxing. You can't think of anything else when you are reading and there is unlimited choice of things to read.” (S4: Given the chance, Female, 45-59 years)
“I can relax: switch off and sit down.”
(S4: Given the chance, Female, 60 and over) “For relaxation and because it is a diversion from the other pressures in life.” (S7: No time to read, Male, 60 and over)
“Because I can expand my vocabulary and knowledge. I enjoy learning and absorbing knowledge.” (S4: Given the chance…, Male, 18-29 years)
““It helps me develop my reading and writing skills and it helps me in my role in business.” (S3: The magazine generation, Female, 30-44 years)
“Books are the purest form of entertainment. There is no middle man, just the reader and the author. In films there are many people involved as middle men, but not in books.”
(S2: Love to read, Male, 18-29 years)
“I just enjoy the pleasure of reading and imagination.” (S5: Joe average, Female, 45-59 years)
“I just love books. If I go anywhere I get a book... I just love reading.” (S2: Love to read, Female, 60 and over)
3. Enjoyment of Reading 19
Don’t have time:
Enjoy other activities more:
Boring:
These comments (particularly when we look at which segments made them) begin to bring the different reading segments to life, and give us more understanding of their attitudes to reading. We see different extremes of opinion, from the most frequent reader segments who would rather read a book and use their imagination, to the least frequent readers who lack the patience, find books boring, and prefer the internet or television.
“I'm too busy with work commitments and when I get home it’s easier to go on the iPad or watch TV.” (S6: Reluctant readers, Male, 45-59 years)
“I enjoy reading books but have not got the time to read. It is time for bed when there may be time to read, by which time I would be sleepy and too tired to read.”
(S7: No time to read, Female, 45-59 years)
“I prefer going on the internet and forums where I can speak to different people online.” (S9: Don’t read, Male, 18-29 years)
“There are other things I would rather do. I see reading as more of a practical and functional activity.” (S6: Reluctant readers, Male, 60 and over)
“It's too much hard work, you get bored half way through reading a book. Nobody has time to read books today, they are all trying to cope with pressures of life and get by, by looking for work, additional income and paying bills.” (S9: Don’t read, Male, 45-59 years)
“At school I found it boring, if I'm interested in something it’s not a book.” (S9: Don’t read, Male, 18-29 years)
“I find it boring and have a short concentration span.” (S9: Don’t read, Male, 30-44 years)
4. Attitudes to Reading 20
4. Attitudes to Reading
Respondents were asked the extent they agreed with a series of statements about reading (strongly agree, agree, disagree, strongly disagree). The statements were presented in a random order but can be broadly grouped into three areas:
Benefits and positive views of reading;
Barriers and negative views towards reading;
Reading versus technology (‘the digital age’).
In this section we look at each of these areas in turn, beginning with the benefits and positive aspects of reading and books.
Benefits of Reading
Fig. 14 below shows the overall proportions of respondents that agreed/disagreed with positive statements about reading:
Fig. 14: Agreement with Positive Statements
To what extent do you agree or disagree with each of the following statements…? (Overall)
There is particularly high agreement for the statements about finding reading relaxing (87%) and fun (84%). However, not everyone agrees with these statements and views are quite mixed for others; it is perhaps differences in opinion between different demographics and reading segments that are most interesting (see overleaf). 3% 3% 3% 5% 4% 4% 9% 10% 13% 14% 14% 20% 20% 29% 50% 54% 56% 54% 54% 56% 49% 37% 30% 27% 27% 22% 20% 14% I find reading relaxing
Reading is fun I read to learn new things I feel happy if I receive a book as a present Reading improves my life Reading helps to make me feel good I like talking about books with other people Strongly disagree Disagree Agree Strongly agree
4. Attitudes to Reading 21
Fig. 15 shows the percentages agreeing with each statement in each of the socio-economic groups: Fig. 15: Agreement with Positive Statements by SEG
It is clearly apparent that the higher the socio-economic group, the higher the agreement with positive statements about reading:
For example, 91% of ABs agree that reading is relaxing, compared with 82% of DEs.
The difference is even more marked for enjoyment of talking about books with other people where 73% of ABs agree compared with 56% of DEs.
However the difference in opinion is, interestingly, less marked for one statement: ‘I read to learn new things’. There is a very similar level of agreement (82% to 85%), with this statement across all SEGs.
Across the age groups, females tend to be more positive than males, particularly in relation to reading being relaxing and fun and making them feel good, as evident in fig. 16. Males are also significantly less likely to agree that they like talking about books with other people.
In terms of age differences, younger respondents (aged 18 to 29) tend to be less positive; this can be seen for both males and females (fig. 16 overleaf).
91 89 85 88 83 85 73 88 84 83 83 76 77 65 82 78 82 72 72 69 56 0 10 20 30 40 50 60 70 80 90 100 I find reading relaxing
Reading is fun I read to learn new things I feel happy if I receive a book as a present Reading improves my life Reading helps to make me feel good I like talking about books with other people AB C1C2 DE
% agree
4. Attitudes to Reading 22
Fig. 16: Agreement with Positive Statements by Age and Gender
Figure 17 (below) shows how agreement levels vary amongst the different reader segments. The more regular reader segments are more positive about books than the infrequent readers with some nuances for certain segments:
Segment 4 ‘Given the chance’ and segment 7 ‘No time to read’, are more positive than their frequency of reading would suggest.
For segment 6 ‘Reluctant readers’ the opposite is true – they read relatively often despite being less positive about reading.
This reflects what we know about these segments – i.e. some would like to read more given the time, others read quite regularly for practical reasons more than enjoyment.
Fig. 17: Agreement with Positive Statements by Reading Segment
81 77 71 59 72 80 62 50 91 84 83 75 76 88 71 56 86 82 77 67 82 80 76 59 94 85 89 76 83 82 78 57 0 20 40 60 80 100
Reading is fun I read to learn new things Reading helps to make me feel good I like talking about books with other people
Reading is fun I read to learn new things Reading helps to make me feel good I like talking about books with other people Aged 18-29 Aged 30-44 Aged 45-59 Aged 60 and over
% agree female % agree male
0 20 40 60 80 100 I find reading relaxing
Reading is fun I read to learn new things I feel happy if I receive a book as a present Reading improves my life Reading helps to make me feel good I like talking about books with other people
S1: Bookworms S2: Love to read S3: The magazine generation
S4: Given the chance… S5: Joe average S6: Reluctant readers S7: No time to read S8: Don't like reading S9: Don't read
4. Attitudes to Reading 23
Barriers to Reading
Fig. 18 below shows the overall proportions of respondents that agreed/disagreed with the less positive statements about reading:
Fig. 18: Agreement with Less Positive Statements
To what extent do you agree or disagree with each of the following statements…? (Overall)
Overall, agreement was highest for the statement ‘I often start reading a book, but get bored after a few chapters’ (36%), and over a third (35%) agreed that they cannot find the time to read.
Agreement was relatively low for the more negative statements about reading: for example 15% agreed that they find reading boring, and only six percent agreed that they think reading is pointless.
Again analysis has been carried out to see how agreement varies for different demographic and reading segments.
The less well-off SEGs are more likely to agree with the less positive statements. In particular, DEs (23%) are ten percentage points more likely than C1C2s (13%) to agree that they cannot find things to read that interest them. Analysis by age and gender indicated that those aged under 30 (both male and female) are slightly more likely to agree with almost all of these statements. The exception is ‘I think reading is pointless’, where agreement is low (around 6-7%) across all age groups.
Analysis by reading segment (fig. 19 overleaf) shows that segment 8 ‘Don’t like reading’ and segment 9 ‘Don’t
read’ are both more likely to agree with these negative statements; along with segment 6, the ‘Reluctant readers’.
16% 23% 32% 34% 40% 35% 51% 48% 42% 52% 51% 45% 54% 43% 29% 26% 14% 12% 11% 9% 4% 7% 9% 3% 3% 4% 2% 2% I often start reading a book,
but get bored after a few chapters I cannot find the time to read Reading is hard work I cannot find things to read that interest me I find reading boring
I read all day at work so I don’t want to read when I get home I think reading is pointless Strongly disagree Disagree Agree Strongly agree
4. Attitudes to Reading 24
Fig. 19: Agreement with Less Positive Statements by Reading Segment
The Digital Age
Respondents were asked the extent they agreed with three attitudinal statements relating to digital technology, specifically the internet, social media and television/DVDs (see fig. 20 below).
Fig. 20: Agreement with Technology Statements
To what extent do you agree or disagree with each of the following statements…? (Overall) 0 20 40 60 80 100 I often start reading a book,
but get bored after a few chapters I cannot find the time to read Reading is hard work I cannot find things to read that interest me I find reading boring
I read all day at work so I don’t want to read when I get home I think reading is pointless
S1: Bookworms S2: Love to read S3: The magazine generation
S4: Given the chance… S5: Joe average S6: Reluctant readers S7: No time to read S8: Don't like reading S9: Don't read
% agree
11% 12% 26% 33% 43% 47% 41% 34% 20% 15% 11% 7%The internet and computers will replace books in the next 20 years
I prefer watching television or DVDs to reading
I prefer the internet and social media to reading books
4. Attitudes to Reading 25
Over half of respondents (56%) agreed that the internet and computers will replace books in the next 20 years, and over a quarter (27%) agreed that they prefer the internet and social media to reading books. Just less than half (45%) admitted to preferring television or DVDs to reading.
Analysis by socio-economic group (see fig. 21 below) clearly shows that the lower SEGs are most likely to agree with the technology statements, whilst the more well-off AB SEGs appear more attached to their books.
Fig. 21: Agreement with Technology Statements by SEG
Analysis by age and gender shows high agreement levels amongst under 30s and particularly amongst younger males: 65% of 18-29 year old men believe the internet and computers will replace books in the next 20 years, and 66% of this group prefer watching television or DVDs to reading (fig. 22 below).
Fig. 22: Agreement with Technology Statements by Age and Gender
42 37 19 56 45 26 64 52 32 0 20 40 60 80 100
The internet and computers will replace books in the next 20
years
I prefer watching television or DVDs to reading
I prefer the internet and social media to reading books
AB C1C2 DE
% agree
61 58 47 51 33 18 55 36 17 48 27 4 0 50 100The internet and computers will replace books in the next 20 years
I prefer watching television or DVDs to reading
I prefer the internet and social media to reading books Aged 18-29 Female Aged 30-44 Female Aged 45-59 Female Aged 60 and over Female
% agree
65 62 66 57 60 36 61 45 27 44 43 0 50 100The internet and computers will replace books in the next 20 years
I prefer watching television or DVDs to reading
I prefer the internet and social media to reading books Aged 18-29 Male Aged 30-44 Male Aged 45-59 Male Aged 60 and over Male
4. Attitudes to Reading 26
If we combine the statistics for both males and females aged under 30 (both genders): 64% of under 30s agree that the internet and computers will replace books in the next 20 years, 64% of under 30s prefer watching television or DVDs to reading and 56% of under 30s prefer the internet and social media to reading books.
The analysis by reading segment (fig. 23) clearly shows that less frequent readers are much more likely to prefer ‘technology’ to reading books, in particular the most infrequent segments, segment 8 ‘Don’t like reading’ and 9 ‘Don’t read’, as well as the ‘Reluctant readers’ (segment 6):
Fig. 23: Agreement with Technology Statements by Segment
The comments made by the various segments (about why they do/don’t enjoy reading) provide some interesting insights into the attitudes that lie behind these ratings (see below):
Comments from those who prefer technology to books:
0 10 20 30 40 50 60 70 80 90 100The internet and computers will replace books in the next 20 years
I prefer watching television or DVDs to reading
I prefer the internet and social media to reading books
S1: Bookworms S2: Love to read S3: The magazine generation
S4: Given the chance… S5: Joe average S6: Reluctant readers S7: No time to read S8: Don't like reading S9: Don't read
% agree
“I really just read for function as I find it tiring after work and prefer the TV.” (S7: No time to read, Male, 60 and over)
“The fact that it is 2013 not 1813. We have electricity now so we can buy DVDs and watch television rather than read books. Books are for an
older generation, younger people on the whole do not read books.” (S9: Don’t read, Male, 30-44 years)
4. Attitudes to Reading 27
Comments from those who prefer books to technology:
We saw in earlier comments that the (often younger) infrequent reader segments have less patience for reading books, and these comments suggest that the internet and social media provide pastimes that demand less patience than reading books.
“There was no TV when I was young and I got into the habit of
enjoying a good book from an early age and kept it up.” (S4: Given the chance, Female, 60 and over)
“I have always enjoyed it, and it comes naturally to me. It would take a very good TV show to keep me away from reading.” (S1: Bookworms, Male, 60 and over)
“I enjoyed [reading] and started at school and never stopped. A better alternative to TV as you can learn more about the characters and subjects.” (S2: Love to read, Male, 60 and over)
“Using ones imagination, instead of being in front of the TV not needing an imagination.” (S1: Bookworms, Female, 45-59 years)
“Because you can get lost in books, it engages your brain, it's more creative to read than to watch TV.” (S1: Bookworms, Male, 18-29 years)
“There is always something else that is more pressing or important, I prefer to watch TV as cannot take in what I’m reading and also always too tired to read at the end of the day.” (S9: Don’t read, Female, 30-44 years)
“I don't have the time to read books and you can find information you want on internet and not looking in about 20 books for reference.” (S9: Don’t read, Male, 18-29 years)
5. Reading Preferences 28
5. Reading Preferences
Book Formats and Types
Respondents were asked for their preferences for book formats and types (see fig. 24 below). Fig. 24: Preferred Formats and Types
Preferred Format (Overall) Fiction or non-fiction (Overall)
Over three quarters (76%) stated a preference for paper books, with only one-in-ten preferring e-books, and 13% stating they like a mixture.
This preference is relatively consistent across segments and demographics, although more frequent readers are more likely to prefer a mix of formats.
There is a spread of preferences for fiction versus fiction; overall 26% prefer fiction and 22% prefer non-fiction, with 44% opting for a mixture of the two and 8% stating they don’t like either.
The most frequent reader segments are likely to prefer a mix of fiction and non-fiction, whereas the less frequent readers are likely to prefer fiction (or, more commonly, neither – 55% of segment 9 - ‘Don’t read’ - chose this option). Men are more likely than average to prefer non-fiction, females are more likely to prefer fiction.
76% 10% 1% 13% Paper books E-books Audiobooks Mixture of these 26% 22% 44% 8% Fiction Non-fiction Mixture of both Neither
5. Reading Preferences 29
Book Genres
Respondents were also asked to choose their favourite book genres (they could choose as many as they liked) – see fig. 25 below:
Fig. 25: Preferred Genres
What types of genres of books do you find most enjoyable? (Overall) Continued
Crime/thrillers topped the list with 33% choosing this option overall. (Auto)biographies also stood out as being very popular (27%). Below these the list is fairly spread and diverse; again it is perhaps the differences by demographics that are most interesting:
By socio-economic group:
The AB SEGs are more likely than average to choose crime/thrillers (39%) and history (19%).
(Auto) biographies (29%) and crime thriller and mystery (28%) were also popular amongst DE SEGs, this group were also more likely than average to choose celebrities/television (5%) or ‘none’ (12%).
By age:
Under-30s are more likely than average to like science fiction (17%).
The older the respondent, the more likely they are to enjoy crime/thrillers/mystery (40% of over 60s compared with 25% of under 30s).
Older respondents, particularly over 60s, are more likely to enjoy a range of genres, including a higher than average liking of history (25%), historical fiction (16%), and classics (13%).
33% 27% 16% 13% 12% 10% 9% 8% 8% 7% 5% 5% 4% Crime/thrillers/mystery (Auto)Biographies History Science fiction and fantasy
Romance Historical fiction Special interests / hobbies Classic novels Modern fiction Horror Humour Sports Science 3% 3% 3% 3% 2% 2% 2% 2% 2% 2% 1% 1% 2% 9% Celebrities / TV Religion / spirituality Travel True stories Graphic novels Erotic fiction Poetry Politics Self help Factual Military / war Adverture Other None
5. Reading Preferences 30 By gender:
Females are more likely to enjoy most genres than males, and the biggest difference is for romance. Only one percent of males admitted enjoying this genre of book compared with 22% of females.
There are a few exceptions: Males are more likely than females to enjoy science fiction/fantasy (16%), special interests (11%), and sports (9%).
By reading segments
Amongst the reader segments the general trend is for the more frequent readers to have high liking across a wide range of genres, whilst the less frequent readers have low liking across the range: e.g. 49% of segment 9 ‘Don’t read‘ said that they don’t like any genres.
Biographies and autobiographies are the most popular genres for segment 8 ‘Don’t like reading’ (28%) and segment 9 ‘Don’t read’ (14%) where they do express a preference.
Enjoyment of poetry (9%) politics (6%), history (35%) and the classics (22%) is higher than average amongst the ‘Bookworm’ segment.
Segment 6 ‘Reluctant readers’ have higher than average liking for special interests (16%) and sports (11%).
How Do People Choose Books?
Participants were also asked how they tend to choose books to read. The overall themes are summarized in fig. 26 below (respondents could give more than one response):
Fig. 26: How People Choose Books
How do you decide which books to read? (Overall) 40% 33% 23% 9% 9% 9% 8% 8% 6% 5% 3% 2% 2% 2% 2% Blurbs/book covers
Recommendations from friends Recommendations from family Reviews on websites Reviews in newspapers or magazines Recommended authors Reviews in bookshops Displays in book shops Amazon website Advertising on TV Recommendations from a librarian Advertising on posters Advertising in books I am reading Reviews on TV/Radio Kindle/Kindle website
Where do you tend to read books for pleasure? (Overall) 31
Respondents were also asked where they read books for pleasure (outside of work or education). The overall responses are shown below in fig. 27.
Fig. 27: Where People Read For Pleasure
Where do you tend to read books for pleasure? (Overall)
Overall, by far the most common places for reading books are in bed (51%) or in the living room (48%). Smaller proportions of people also read on holiday (12%), on public transport (8%), in the garden (8%) and during breaks at work (8%). It is notable that those living in London are much more likely than average (18%) to read on public transport.
In terms of the reading segments, we see that the ‘Bookworms’ (segment 1) are more likely than average to enjoy a leisurely read in the bath (14%) or the park (7%), whilst the busy ‘Given the chance’ segment often steal the chance to read a book on public transport (14%).
The other time poor segment, ‘No time to read’ (segment 7) often do their reading on holiday (23%); similarly if the less positive reading segment 8 (‘Don’t like reading’) do read books it is likely to be on holiday (22%). The least positive segment (segment 9) tend to state that they don’t read anywhere (67%).
51% 48% 12% 8% 8% 6% In bed
In living room/ lounge
Holiday
On public transport
In the garden
At work during break
Others include: Bath - 3%
Other rooms in house – 3%
Car – 2% Library – 1% Park – 1% Coffee shop – 1% Conservatory – 1% Anywhere – 1%
6. Reading Through The Generations 32
6. Reading Through The Generations
‘Reading History’
The survey contained a section looking specifically at reading with children, with questions examining the following:
Reading history, i.e. whether respondents had parents who enjoyed reading, who read to them when they were younger, and encouraged them to read.
Whether those respondents with children aged under-13 read to their children regularly. Firstly we look at ‘reading history’ (fig. 28 below) .
Fig. 28: Agreement with Statements about Reading History
To what extent do you agree or disagree with each of the following statements…? (Overall)
At an overall level the responses are relatively positive across these statements - for example 82% agree that they were encouraged to read by their parents when growing up.
Analysis suggests a link between reading history and frequency of reading – evident in the analysis of reading segments provided overleaf (fig. 29).
1% 3% 1% 2% 4% 5% 5% 8% 13% 19% 20% 19% 47% 48% 48% 41% 35% 25% 26% 29% My parents encouraged me to read when I was growing
up
When I was a child, my parents enjoyed reading
I enjoyed reading at school When I was a child, my parents often read stories
and books to me Don't know Strongly disagree Disagree Agree Strongly agree
6. Reading Through The Generations 33
Fig. 29: Agreement with Statements about Reading History by Reading Segment
We can see that agreement with the statements about having a positive reading history is particularly low in segment 9 (‘Don’t read’), but the correlation between reading frequency and history is not completely clear cut at segment level. This is likely to be because of some of the attitudinal factors seen earlier – for example Segments 4 (‘Given the chance’) and 7 (‘No time to read’) have more positive ‘reading histories’ than some of the segments that read more frequently than them – but of course this reflects the fact that they are relatively positive about reading, but lack the time to read as much as they would like.
Another way to look at the impact of reading history on reading habits is to simply compare the reading habits and attitudes of those who agree with the reading history statements versus those who don’t.
Firstly we compare the number of books read in a year amongst those with positive responses to the reading history statements versus those with negative responses (fig. 30 below):
Fig. 30: Average Books Read per Year by Reading History 89 74 89 74 94 89 88 83 78 67 72 68 92 82 90 81 84 76 77 68 72 66 65 64 84 77 81 74 76 68 67 66 66 53 42 52 0 10 20 30 40 50 60 70 80 90 100 My parents encouraged me to read when I was growing
up
When I was a child, my parents enjoyed reading
I enjoyed reading at school When I was a child, my parents often read stories
and books to me
S1: Bookworms S2: Love to read S3: The magazine generation
S4: Given the chance… S5: Joe average S6: Reluctant readers S7: No time to read S8: Don't like reading S9: Don't read
% agree
32 27 32 29 33 24 33 24 0 20 40 60 80 100 Parents read to me Parents didn't read to meParents enjoyed reading Parents didn't enjoy reading Parents encouraged me to read Parents didn't encourage me to read Enjoyed reading at school Didn't enjoy reading at school
Number of books read per year
6. Reading Through The Generations 34
Those with positive reading histories generally read more books per year. Some of these differences are statistically significant: Those who agreed that they enjoyed reading at school read an average of 33 books per year compared with 24 for those who didn’t enjoy it. Similarly those whose parents encouraged them to read get through an average of 33 books per year compared with 24 for those who don’t feel that their parents encouraged them.
We can also examine the proportions that never read books by reading history (fig 31. below). Fig. 31: % That Never Read Books by Reading History
We see statistically significant differences across all of the statements, but the biggest difference is between those who enjoyed reading at school and those who didn’t: Nearly a third (31%) of those who didn’t enjoy reading at school never read books themselves (not including with children), compared with 15% of those who did enjoy reading.
We can also examine more attitudinal factors by looking at the proportions that enjoy reading books very much by reading history (fig. 32 below):
Fig. 32: % That Enjoy Reading Books Very Much by Reading History
This analysis suggests that there is a link between reading history, reading habits and attitudes as an adult – particularly in relation to parental encouragement and enjoyment of reading at school. However, there are still those with a less positive reading history who are frequent and positive readers.
17 22 17 22 18 25 15 31 0 20 40 60 80 100 Parents read to me Parents didn't read to me
Parents enjoyed reading Parents didn't enjoy reading Parents encouraged me to read Parents didn't encourage me to read Enjoyed reading at school Didn't enjoy reading at school
% that never read books 50 49 51 44 51 40 55 31 0 50 100 Parents read to me Parents didn't read to me
Parents enjoyed reading Parents didn't enjoy reading Parents encouraged me to read Parents didn't encourage me to read Enjoyed reading at school Didn't enjoy reading at school
% that enjoy reading very much
6. Reading Through The Generations 35
There is another question to answer here however: does reading history influence the extent to which parents read to their own children? We will examine this in the next section.
Reading with Children
Respondents with children aged under 13 were asked for their level of agreement with the statement ‘I regularly read to my children’, and those with older children (aged 13+) were asked whether they used to read to them regularly (fig. 33 below).
Fig. 33: Agreement with Statements about Reading to Children
To what extent do you agree or disagree with each of the following statements…? (Overall)
Reassuringly the majority of respondents with younger children agreed that they regularly read to them (84%), and most of those with older children agreed that they used to read to them regularly (92%).
Nevertheless, there is a significant chunk of respondents that disagreed that they read regularly to their children (12%) or used to (7%).
Over the page we show some analysis to see whether this relates to reading history.
Firstly we compare the proportion agreeing with the statement ‘I read regularly to my kids’ amongst those with positive responses to the reading history statements versus those with negative responses (fig. 34 overleaf):
4% 2% 2% 1%
10%
6%
33% 43%
51% 49%
I regularly read to my children (where children under 13)
I used to read regularly to my children (children 13 and over)
6. Reading Through The Generations 36
Fig. 34: % Who Agree That They Read Regularly to Their Children by Reading History
There are statistically significant differences for three aspects of reading history:
Those who agreed that they enjoyed reading at school are more likely to agree (89%) that they regularly read to their children than those who didn’t enjoy reading at school (70%).
Those whose parents encouraged them to read are more likely to agree (88%) that they regularly read to their children than those whose parents didn’t encourage them (67%).
Those whose parents read to them are more likely to agree (89%) that they regularly read to their children than those whose parents didn’t read to them (72%).
Fig. 35 (below) shows similar analysis for those with older children, with the proportions agreeing with the statement ‘I used to read regularly to my kids’. Here the differences between those with positive and negative reading histories are also all statistically significant.
Fig. 35: % Who Agree That They Used to Read Regularly to Their Children by Reading History
This analysis provides strong evidence that those who were encouraged to read growing up, were read to by parents, and who enjoyed reading at school, are significantly more likely to read regularly to their children.
89 72 86 79 88 67 89 70 0 50 100 Parents read to me Parents didn't read to me
Parents enjoyed reading Parents didn't enjoy reading Parents encouraged me to read Parents didn't encourage me to read Enjoyed reading at school Didn't enjoy reading at school
% Agree 'I read regularly to my children' 95 85 94 86 94 81 95 80 0 50 100 Parents read to me Parents didn't read to me
Parents enjoyed reading Parents didn't enjoy reading Parents encouraged me to read Parents didn't encourage me to read Enjoyed reading at school Didn't enjoy reading at school
% Agree 'I used to read regularly to my children'
7. Reading, Wellbeing and Deprivation 37
7. Reading, Wellbeing and Deprivation
Reading and Wellbeing
All respondents were asked to give a score from nought to ten for a number of issues used by the Office for National Statistics as measures of wellbeing (nought is ‘not at all’ and ten is ‘completely’). The questions were:
Overall, how satisfied are you with your life nowadays?
Overall, to what extent do you feel that the things you do in your life are worthwhile?
Overall, how happy did you feel yesterday?
On a scale where nought is ‘not at all anxious’ and 10 is ‘completely anxious’, overall, how anxious did you feel yesterday?
Below we look at the average scores given for these measures broken down by reading segment and SEG. Firstly, looking at how satisfied respondents are with their lives nowadays (fig. 36 below), we see that the more frequent reader segments are also the happiest, with ‘Reluctant readers’ and those who ‘Don’t read’ the least satisfied. The findings also suggest that those in SEG AB are more satisfied with their life than DEs.
Fig. 36: Satisfaction with Life by Reading Segment and SEG
More regular readers and ABs are also more likely to feel that the things they do in life are worthwhile (fig. 37 overleaf): 7.97 7.84 7.75 7.84 7.69 7.44 7.65 7.59 7.44 7.82 7.76 7.4 5 7 9 S1 S2 S3 S4 S5 S6 S7 S8 S9 AB C1C2 DE
Overall how satisfied are you with your life nowadays? Average score / 10
Mean: 7.68
7. Reading, Wellbeing and Deprivation 38
Fig. 37: Whether Feel Things Do Are Worthwhile by Reading Segment and SEG
Prolific and regular readers are also the happiest groups and segments (fig. 38 below): Fig. 38: Happiness by Reading Segment and SEG
In terms of anxiety levels, the trend is not clear cut, but more regular reader segments are least anxious (fig 39. below), and segments 8 (‘Don’t like reading’) and 9 (‘Don’t read’) are amongst the most anxious, after the ‘Reluctant readers’ (segment 6).
Fig. 39: Anxiety Levels by Reading Segment and SEG 8.24 8.16 7.97 8.16 8.03 7.65 7.99 7.76 7.69 8.06 7.97 7.78 5 7 9 S1 S2 S3 S4 S5 S6 S7 S8 S9 AB C1C2 DE
Overall, to what extent do you feel that the things you do in your life are worthwhile? Average score / 10
Mean:
7.96
7.84 7.69 7.4 7.57 7.34 6.8 7.4 7.24 7.13 7.5 7.36 7.28 5 7 9 S1 S2 S3 S4 S5 S6 S7 S8 S9 AB C1C2 DEOverall, how happy did you feel yesterday? Average score / 10
Mean: 7.37
2.34 2.58 2.46 2.77 2.75 3.4 2.22 3 2.9 2.32 2.8 2.96 0 2 4 S1 S2 S3 S4 S5 S6 S7 S8 S9 AB C1C2 DEOn a scale where nought is ‘not at all anxious’ and 10 is ‘completely anxious’, overall, how anxious did you feel yesterday? Average score / 10
Mean:
2.72
7. Reading, Wellbeing and Deprivation 39
Reading and Measures of Deprivation
In order to combine the survey data with national statistics, each record is matched via the respondent’s postcode to the 2010 publications of crime, health, education and deprivation data.
The two main sources of data used in this report are: 1. IMD (Indices of Multiple Deprivation)
2. IDACI (Income Deprivation Affecting Children Index)
IMD explained
The Indices of Deprivation (2010) provides a relative measure of deprivation at small area level. Areas are ranked from least deprived to most deprived on seven different dimensions of deprivation and an overall composite measure of multiple deprivation. The domains used in the Indices of Deprivation 2010 are: income deprivation; employment deprivation; health deprivation and disability; education deprivation; crime deprivation; barriers to housing and services deprivation; and living environment deprivation. Each of these domains and the overall composite score has its own score and rank, allowing users to focus on specific aspects of deprivation.
IDACI explained
The IDACI index is a measure of the proportion of children (under the age of 16) who are living in low income households and is shown as a percentage score and also calculated at the super output area level as a rank score ranging from 1 (the most deprived) to 32482 (the least deprived). Families are classed as income-deprived if they are in receipt of income support, income based jobseekers allowance or pension credit, or child tax credit with an equivalised income (excluding housing benefits) below 60% of the national median before housing costs. The details can be found at http://www.education.gov.uk/cgi-bin/inyourarea/idaci.pl
Reading Frequency
Fig. 40 below demonstrates that more frequent book readers live in areas with lower levels of deprivation, as indicated by the higher IMD score. In turn, respondents who never read books live in the more deprived areas, as indicated by the lower IMD score.
Fig. 40: IMD Rank by Book Reading Frequency
16839 16594 15702 16016 14488 0 5,000 10,000 15,000 20,000
Every day Several times a week
Once or twice a week
Less often Never
7. Reading, Wellbeing and Deprivation 40
The strongest links to books reading within the individual markers of deprivation are income and education. Levels of crime, housing, health and living environment are similar across the different frequencies of book reading (figs. 41 to 42, below).
Fig. 41: Individual IMD Items by Book Reading Frequency (1 of 2)
Fig. 42: Individual IMD Items by Book Reading Frequency (2 Of 2)
Fig. 43 (overleaf) demonstrates that everyday book readers have significantly lower proportions of children in poverty in their area than non-readers, who live in areas with higher proportions of children in poverty.
16844 16161 16447 16206 16513 16177 16748 17207 15419 15835 15573 15548 15109 15865 14756 16142 14361 14396 13366 15067 0 5,000 10,000 15,000 20,000
Income Employment Education Health
Every day
Several times a week Once or twice a week Less often Never 16894 16847 17255 15598 16296 16949 16498 16799 15899 16495 15746 17200 15786 17239 16900 0 5,000 10,000 15,000 20,000
Housing Crime Living environment
Every day
Several times a week Once or twice a week Less often