1
GAS TURBINE INLET AIR CHILLING FOR LNG
John L. Forsyth, P.Eng.
LNG Business Development Manager TAS Energy, Houston, Texas ABSTRACT
It is well recognized that gas turbines used as compressor drivers in LNG liquefaction plants suffer from decreased power output as the ambient temperature increases. This fluctuation in driver output can result in reduced LNG production and process instability. An established technology in the power generation industry, gas turbine inlet air chilling (TIC) can allow the liquefaction compressor drivers to operate at near constant power output. This technology is widely accepted by gas turbine OEM's and has been proven safe and reliable in hundreds of installations worldwide. TIC can eliminate one aspect of the weather as a process variable in the liquefaction plant, and even allow a simpler approach to compressor selection. Unlike traditional evaporative cooling methods, TIC is not restricted to cooling the inlet air to the prevailing wet bulb temperature, and as such is ideal for inlet air cooling in the high humidity, coastal environments associated with LNG liquefaction plants.
1.0 INTRODUCTION
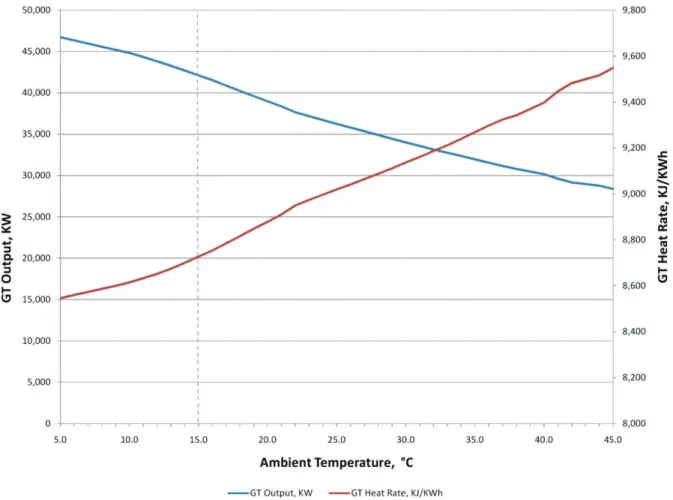
Gas turbines, whether aeroderivative or heavy duty, are mass flow engines; that is, their power output is directly proportional to the mass flow of air through the turbine. For single-shaft heavy duty or frame gas turbines, the volumetric flow of air is constant making the air mass flow a function of air temperature. For multiple-shaft aeroderivative engines, the inlet air flow varies with compressor shaft speed. In both cases, the density of the air entering the compressor and therefore the air temperature plays a major role in determining the actual power produced by the engine. Since for most purposes, volumetric airflow through the gas turbine can be considered constant, increasing the density of this airflow can be used to increase the mass flow and therefore the power output. Inlet air cooling to increase and stabilize power output is a widely accepted technology in the power generation industry that has recently migrated to mechanical drive gas turbines used to drive compressors used in the LNG liquefaction process. This technology is broadly referred to as CTIAC (Combustion Turbine Inlet Air Cooling) or TIC (Turbine Inlet Chilling) specifically when the cooling is provided by a refrigeration cycle as described below. A typical chart showing shaft power for a GE LM6000 gas turbine is shown in Figure 1. As can be seen, the power vs. compressor inlet temperature curve approximates a straight line. This holds true for the vast majority of gas turbines, with the main difference being the slope of the line. For aeroderivative gas turbines the slope of the line tends to be steeper as these units exhibit a higher compression ratio. The chart also indicates gas turbine heat rate as a function of temperature. In general, operation at lower inlet air temperatures provides an improvement in heat rate, although this is generally not the primary objective in use of a CTIAC system. Depending on the system design and operating conditions, this improvement in heat rate will offset to varying extents the electrical power consumption of the CTIAC system. For heavy duty gas turbines, the slope is less steep as the compression ratio is lower – these units tend to have a higher ratio of airflow to power output.
2
Figure 1 – Performance of GE LM6000 Gas Turbine as a Function of Inlet Air Temperature CTIAC systems can be divided into two broad categories, depending on the process ultimately used to cool the air.
1) Evaporative Cooling
2) Turbine Inlet Chilling (TIC) using a refrigeration cycle 2.0 EVAPORATIVE COOLING PSYCHROMETRIC PROCESS
Evaporative cooling takes advantage of the latent heat of vaporization of water which is evaporated in the airstream to be cooled. This process is often referred to as adiabatic cooling, since by definition an adiabatic process is one where heat is neither lost nor gained in the system. In this process, as water is evaporated in the airstream, the latent heat of vaporization of the water is provided by sensible heat from the air with the end result being a reduction in temperature of the air stream which is accompanied by an increase in relative humidity. These systems are typically divided into two categories, although thermodynamically they use the exact same process. Both methods attempt to maximize the air to water contact surface to maximize evaporation rates.
1) Media type evaporative coolers – These units will use a wetted media similar to cooling tower fill over which water is trickled down with the air flowing in a crossflow configuration
2) Inlet fogging systems – These systems use an array of hydraulic water atomizing nozzles mounted in the inlet airstream to produce fine droplets that are intended to evaporate quickly.
3
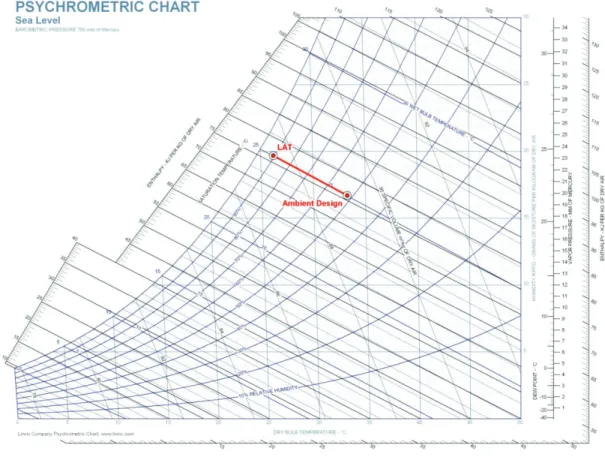
Figure 2 – Typical Evaporative Cooling Psychrometric Process
Much has been written about the relative safety of evaporative cooling systems, in particular inlet fogging systems, which is not the intent of this paper. To concisely describe the performance of these systems, reference must be made to a psychrometric chart (Figure 2) that illustrates the adiabatic cooling process. In order to further describe the adiabatic cooling process, the concept of wet bulb temperature needs to be introduced. Wet bulb temperature of moist air is also referred to as adiabatic saturation temperature and can be most simply defined as the temperature which a quantity of air would theoretically reach if adiabatically cooled to saturation e.g. 100% relative humidity. By that very definition, the adiabatic cooling process is depicted in the psychrometric chart as moving along a line of constant wet bulb temperature towards the saturation curve. Reaching the prevailing wet bulb temperature is a theoretical low limit for evaporative cooling systems which is generally not achievable since the air/water contact surface and droplet residence times for evaporation in the case of fogging systems are insufficient to achieve this goal. Typical quoted effectiveness rates for such systems are in the range of 85%, i.e. they can achieve up to 85% of the available wet bulb depression, which is defined as the difference between prevailing dry bulb and wet bulb temperatures. Fogging system manufacturers will often quote higher effectiveness rates, although these are usually achieved through “overspray” i.e. spraying more water into the airstream than can possibly be evaporated. The reasoning behind this is that fogging nozzles do not produce droplets of uniform diameter, but rather a range of diameters. By overspraying, more of the smaller diameter droplets that evaporate quickly are introduced into the airstream, increasing system effectiveness. The excess water of course can follow one of two paths – lost to drain or ingested into the compressor where the larger droplets could cause potential erosion problems.
In the example shown, air is cooled from an ambient condition of 33.3°C and 51.8 % R.H., which corresponds to 25.1°C WB, down to 26.3°C along a line that represents constant wet bulb temperature. The adiabatic cooling process from any other point on the chart would have to follow a similar process i.e. cooling along a line of constant wet bulb temperature, which will be parallel to the process line shown.
4 3.0 TIC SYSTEMS
Turbine Inlet Chilling (TIC) systems can be defined as a subset of CTIAC systems in that they use a refrigeration cycle to cool the inlet air down to a desired temperature. The focus of this paper is on mechanical vapor compression refrigeration systems given their much higher popularity and reliability. Generally speaking, the refrigeration cycle is used to chill water, or an antifreeze solution such as water/propylene glycol which in turn is used to cool the air using finned tube heat exchangers (cooling coils) mounted in the air intake downstream of the filter. Although tempting and occasionally attempted, cooling the inlet air using direct expansion of refrigerant has multiple pitfalls which shouldn’t be disregarded. Two primary examples of these include:
• Non-homogeneous inlet air temperature entering GT compressor – The air transit time from TIC cooling coil (heat exchanger) to compressor inlet in a gas turbine is typically less than 2 seconds. Direct expansion of refrigerant inside the cooling coil can lead to air temperature gradients across the large face area of the cooling coil. Given the limited transit time of this air, there is generally insufficient time for the air to mix and enter the GT compressor at a uniform temperature. Chilled water cooling coils tend to minimize this issue and provide a sufficiently uniform entering air temperature
• Refrigerant leaks – TIC cooling coil modules inherently incorporate a system of condensate drain pans and piping to safely remove water that is condensed from the air stream. In the unlikely event of a water leak in a chilled water cooling coil, the condensate drain system would be expected to handle a reasonable amount of leakage which can be readily detected by monitoring makeup water into the chilled water closed loop. In a direct expansion type system, the gaseous refrigerant would be entrained in the airstream, ingested into the compressor and immediately thereafter into the combustor. Generally speaking, most refrigerants are not intended to be exposed to high temperatures such as those found in a GT combustor where the heat can cause them to break down and form harmful products of decomposition. One example of this is R717 (anhydrous ammonia) which decomposes into hydrogen and nitrogen gases when exposed to temperatures above 450°C. Synthetic refrigerants such as R134a or R123 may create decomposition products such as hydrochloric or hydrofluoric acid when exposed to high temperature.
3.1 Turbine Inlet Chilling Psychrometric Process
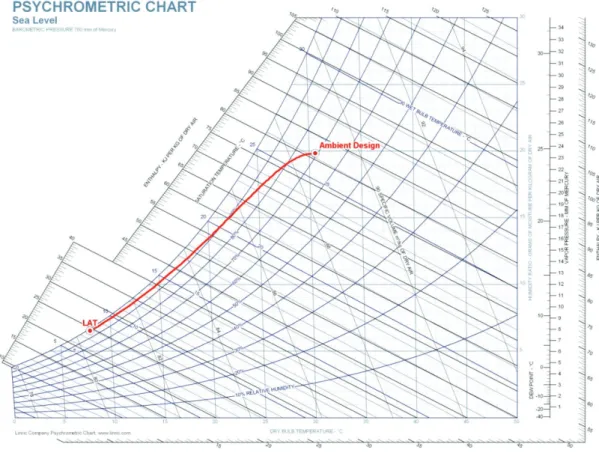
As can be seen in the psychrometric chart of Figure 3, the TIC process is fundamentally different from evaporative cooling. No longer restricted from cooling the air to an approach to the prevailing wet bulb temperature, TIC systems routinely cool the air well below this as well as the prevailing dewpoint temperature. A properly sized TIC system is therefore capable of maintaining a stable downstream or leaving air temperature, regardless of the prevailing relative humidity, making these systems much more suitable for turbine inlet cooling in hot, humid sites that are typical of LNG liquefaction plants.
It is important to note that although the benefit of TIC to a gas turbine can easily be described in terms of reduction in the air inlet temperature, the cooling load for the TIC system, typically expressed in tons of refrigeration (TR) or kW, is proportional to the enthalpy change of the air. It is therefore critical when selecting an ambient design point for a TIC system to know the relative humidity or wet bulb temperature that is coincident with the design dry bulb temperature. Looking at a typical psychrometric chart, it can also be observed that lines of constant wet bulb temperature are very close to parallel to lines of constant enthalpy. For this reason, wet bulb temperature is often used as a key design parameter when considering an ambient design point as opposed to dry bulb temperature.
5
Figure 3 – Turbine Inlet Chilling (TIC) Psychrometric Process 3.2 Choosing an Ambient Design Point for a TIC System
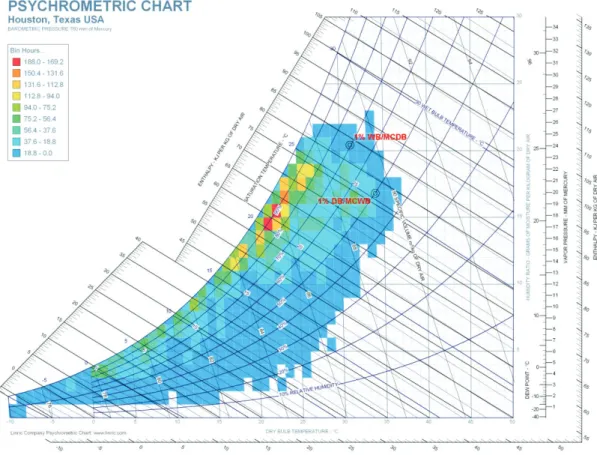
The selection of an ambient design point for a TIC system needs to be evaluated on a cost-benefit basis. In power generation applications, cooling design points such as those published by ASHRAE are frequently used. These include 2.0%, 1.0% and 0.4% exceedance values for design dry bulb temperatures, which are accompanied by mean coincident wet bulb temperatures (DB/MCWB). Similarly, 2.0%, 1.0% and 0.4% exceedance values are published for design wet bulb temperatures along with mean coincident dry bulb temperatures (WB/MCDB). Although it is tempting to use the DB/MCWB values, since ultimately gas turbine performance is affected by DB temperature, it is important to remember that TIC cooling load and therefore system design capacity is much more sensitive to WB temperature. This is illustrated in Figure 4, which shows the 1% values for DB/MCWB and WB/MCDB for Houston along with Typical Meteorological Year (TMY2) weather data.
In the example of Figure 4, the 1% design DB temperature of 34.1 °C is shown along with a MCWB value of 25.3 °C. This point corresponds to an enthalpy of 77.4 kJ/kg. The 1% design WB value of 26.7 °C however corresponds to an enthalpy of 83.8 kJ/kg with a MCDB of 31.3 °C. Even though the DB temperature in the DB/MCWB value is higher than that of the WB/MCDB value, the enthalpy of the design WB value is significantly higher which would result in a much higher refrigeration load. A system that was designed for a DB/MCWB condition would then see a significant performance shortfall when confronted with the lower temperature, yet higher enthalpy air. It is also worth mentioning that even though a system may be designed for a WB/MCDB exceedance value, its performance should also be checked at the high ambient DB temperature that is so crippling to gas turbine performance. This is of particular importance to air cooled systems, which could see a bottleneck in air cooled condenser capacity even though the overall refrigeration capacity of the system is adequate at the peak cooling load that occurs at the high WB condition.
6
Figure 4 – Ambient Design Data and TMY Weather Data for Houston
Although the WB exceedance values published by ASHRAE are frequently used as design values, each situation is different and the ambient design condition should be the subject of a more detailed cost benefit study. This study should take into account long term annual weather data such as that published in the TMY datasets created by the National Renewable Energy Laboratory (NREL). This type of weather data was originally designed for use in building energy simulations, but equally lends itself to economic analysis of TIC systems. The latest of these datasets, termed TMY3, contains data based on observations during the period 1976-2005 which has been statistically analyzed to create a “typical” weather year. The original TMY3 datasets created by NREL are for 1454 locations throughout the United States and territories. Data that matches the TMY3 as well as the previous TMY2 and TMY file formats is available from various sources for international locations, although the observation periods and methodology used to develop the international TMY data do not necessarily match those used by NREL. A commonly used analysis compares the number of annual cooling degree hours (CDH) associated with various CTIAC systems as well as the baseline case of no inlet cooling, while assigning an economic benefit to each CDH in terms of increased production. It is important to note that TMY data does not contain historical extremes, but rather is intended to be more indicative of long term climate.
3.3 Mechanical Vapor Compression TIC Systems
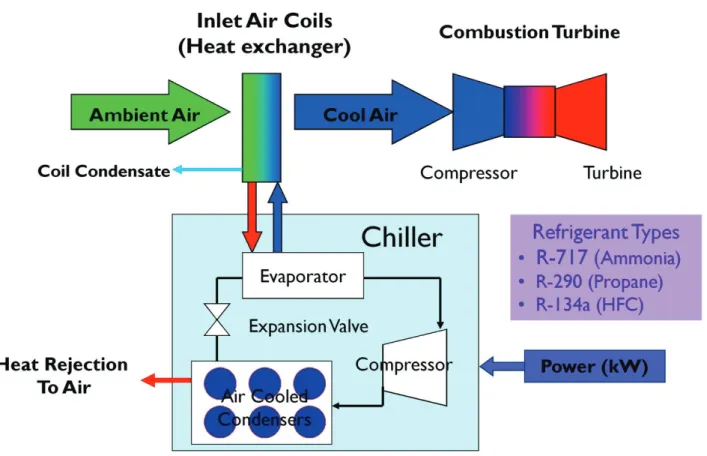
These systems use the latent heat of vaporization of a working fluid or refrigerant to chill water or an antifreeze solution such as water/propylene glycol. The liquid refrigerant is expanded at low pressure in an evaporator, which is typically a shell and tube or plate and frame heat exchanger. The refrigerant vapor is then compressed using a compressor, typically either centrifugal or oil flooded screw type. Heat from the compressed refrigerant is then transferred in a condenser, which in turn is rejected to the atmosphere. Condensers can be water cooled, in which case the heat is rejected to atmosphere through a conventional cooling tower, closed water circuit fin-fan cooler or to a large body of water such as the ocean. Air cooled
7
condensers will condense the refrigerant in a forced draft finned tube heat exchanger which allows the refrigerant to drain back to a refrigerant receiver or directly to the evaporator where the cycle continues. A variety of refrigerants for these systems are in common use ranging from synthetic refrigerants such as R123 or R134a, natural refrigerants such as R717 (anhydrous ammonia) or hydrocarbons such as propane. The choice of a refrigerant for a particular application must be made taking into account various economic, environmental and regulatory issues specific to the project at hand.
A simplified schematic of an air cooled mechanical vapor compression TIC system is shown in Figure 5.
Figure 5 – Typical Air Cooled TIC System (mechanical vapor compression) 3.4 Absorption TIC Systems
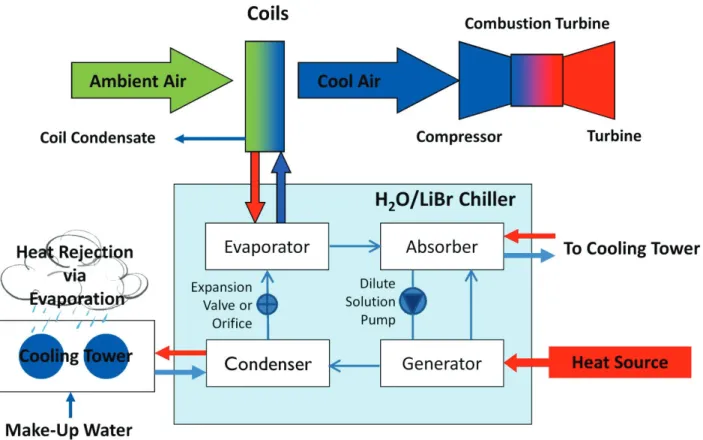
By far less common than mechanical vapor compression systems, absorption chillers use a heat source such as low pressure steam, hot water or exhaust gas to provide a chilling effect. A simplified schematic of a water cooled absorption TIC system is shown in Figure 6.
8
Figure 6 – Typical Absorption (thermal vapor compression) TIC System
Absorption chilling is also occasionally referred to as thermal vapor compression chilling as opposed to mechanical. The cycle uses a refrigerant and an absorbent with the two most common refrigerant/absorbent working pairs being water/lithium bromide (LiBr) and ammonia/water. The basic principle behind this cycle lies in the reduction of vapor pressure as a refrigerant is absorbed into an absorbent. The benefit of this system is that the use of low grade, often waste heat is used as the primary energy source with relatively low electrical consumption. Referring to the diagram, the basic steps that constitute this cycle are the following: • Heat is applied to the Generator which contains a solution of refrigerant/absorbent, rich in refrigerant. • High pressure refrigerant vapor is desorbed from the solution in the Generator after which it flows to the
Condenser. In the case of an H20/LiBr chiller this is typically water cooled whereas in an Ammonia/H20
unit it may be air cooled.
• High pressure liquid refrigerant then flows through a flow restricting device to the low pressure Evaporator where it evaporates, providing the cooling effect which is used to generate chilled water. • Low pressure refrigerant vapor then flows to the Absorber, which contains an absorbent rich solution that
absorbs the refrigerant.
• Refrigerant rich solution is then pumped from the Absorber to the Generator, and the cycle continues. On the surface, this type of system appears to be quite appealing, since it can use waste heat that is recovered from gas turbine exhaust to generate chilled water that is used for gas turbine power augmentation. In actual practice, these systems are far less commonly used due to their higher initial cost and lower reliability. TIC systems are often subject to high, rapid load swings and require extremely high turndown, both of which have been seen to complicate the operation of absorption chillers. Furthermore, the thermo-chemical process involved in absorption chilling is often poorly understood by plant maintenance and operations personnel, further affecting the system reliability. Finally, even though these systems have the capability of using waste heat to provide inlet chilling, their coefficient of performance (COP) is quite low, usually a fraction of that offered by a mechanical vapor compression chiller. This equates to much higher
9
quantities of heat being rejected to atmosphere with an associated increase in the size of heat rejection equipment and water consumption should the system be water cooled. Most commercially available packaged absorption water chillers also use H20/LiBr as the working pair. This cycle does not lend itself to
air cooled applications except perhaps where the ambient temperature is relatively low. 3.5 Benefits of TIC Systems in LNG Applications
Unlike evaporative cooling systems, an appropriately designed TIC system can maintain a near constant inlet air temperature which can allow the mechanical drive gas turbines used in the LNG liquefaction plant to produce constant power. This yields the following primary benefits:
• Increased LNG production, assuming that the plant is designed such that the gas turbine driver becomes a production bottleneck during hot weather.
• More stable liquefaction process
• Possible optimization of compressor selections for the liquefaction process. Typically the compressors used in the liquefaction process that are driven by gas turbines need to be selected to operate across a fairly wide band of power inputs due to the varying power produced by the GT drivers as the ambient temperature varies. As the use of an appropriately sized TIC system allows the GT to produce a much more constant output, the compressor can be selected and optimized for operation across a much narrower power band.
3.6 Performance Comparison between Evaporative Cooling and TIC
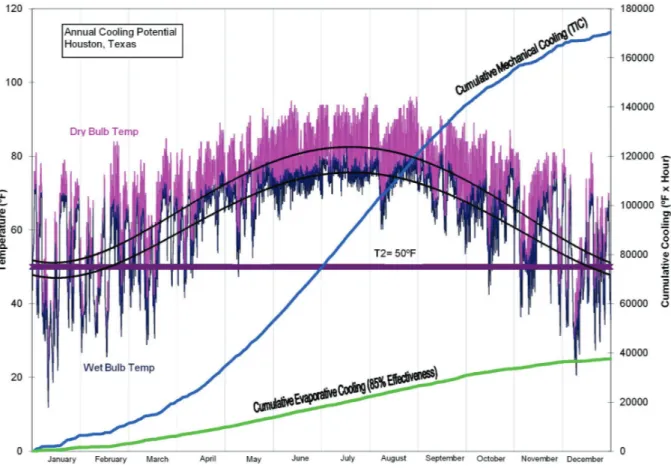
Any relevant performance comparison between evaporative cooling and Turbine Inlet Chilling should be made in the context of detailed site weather data such as the TMY data described above. For this to happen, the performance of both types of systems needs to be understood across the full range of operating conditions. Typical comparative methods include summarizing the number of cooling degree hours (CDH) that each system is able to provide over the course of a typical year. A cost benefit analysis can then be performed using this data taking into account the performance characteristics of the gas turbine drivers used and the overall benefit to the LNG plant of the augmented power. A plot of comparative CDH for Houston, Texas is shown in Figure 7.
The chart in Figure 7 uses the TMY2 annual weather data for Houston (8760 hours) along with the following assumptions:
• Target leaving air temperature (T2) for both systems is 50°F (10°C). Both systems will attempt to cool down to this temperature, but not below it.
• Both TIC system and evaporative cooling system have sufficient capacity to provide maximum possible cooling for all hours
• Effectiveness of evaporative cooling system is a constant 85%
This analysis indicates that the total annual CDH for the TIC system is more than 4x that of the evaporative cooling system for the typical meteorological year dataset. The reason behind this can be found in the basic principles behind evaporative cooling – available wet bulb depression is quite limited in a hot, humid climate such as Houston.
10
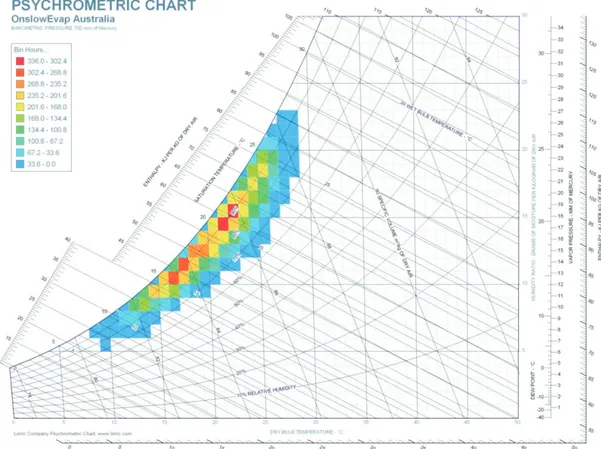
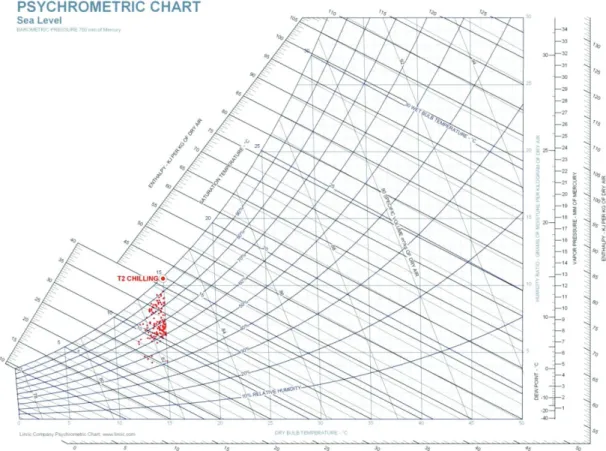
Figure 7 – Cooling Degree Hours (CDH) for Evaporative Cooling and Turbine Inlet Chilling in Houston Another comparison that can be made between the two systems is not so much quantitative but rather graphical in nature. This method uses Joint Frequency Plots of ambient temperature and humidity on a psychrometric chart. The baseline annual weather for such a comparison can be seen in Figure 8. Each colored square on the chart represents a range of hours of incidence of a particular combination of temperature and humidity. For example, a red square represents a condition that could be expected to occur between 81 and 90 hours in a typical year. Although each rectangle represents a range of hours of incidence, this is done to simplify the color code. The sum of hours of incidence for all colored rectangles should be 8760 hours. This method allows a quick visual representation of the typical climate for a particular location.
If we take the same weather dataset shown in Figure 8, and assume that it is cooled using an 80% effective evaporative cooler, the results can be seen in Figure 9. In this case, it is assumed that the target leaving air temperature is 15C, so the evaporative cooler will attempt to cool as close to this temperature as possible without cooling below it. While it is clear that the evaporative cooler has provided a cooling effect, the range of air temperatures entering the gas turbine compressor is still wide and therefore so will be the range of power produced. Whether or not this performance is adequate needs to be determined on a case by case basis.
11
Figure 8 – Joint Frequency Annual Weather Plot for Onslow, Australia
12
If we take the same ambient air dataset shown in Figure 8, and now process it through a Turbine Inlet Chilling system, the results can be seen in Figure 10. The TIC system also has as an objective to cool the inlet air down to 15 °C and, if appropriately sized, can consistently meet this objective. Since in most cases the air will be cooled below the prevailing dewpoint, the majority of the time the inlet air will leave the cooling coil at or very near saturation. In some cases, where the air is being cooled above the prevailing dewpoint, the relative humidity of the air will be lower. There are also a number of hours shown below 15 °C in all cases, since these hours were part of the original dataset and the objective of the system was not to heat the air, just to cool it.
Figure 10 – TIC System Performance in Onslow, Australia 3.7 TIC Systems for LNG Liquefaction Plants
The majority of TIC systems in current operation in applications such as power generation are water cooled units using conventional cooling towers for heat rejection and synthetic refrigerants (R123 or R134a) in packaged water chillers. These packaged water chillers incorporate a refrigerant compressor, usually centrifugal type for high capacity systems, along with shell and tube evaporator and condenser. Although quite suitable for the intended duty, these systems are not built to typical Oil & Gas standards such as API and are not suitable for use in a hazardous environment.
Given the operating environment of the LNG liquefaction plant, TIC systems have been developed specifically for use in this environment with the following key distinctions from conventional systems used in power generation applications:
• Centrifugal or Oil flooded screw compressors conforming to API 617 or API 619 respectively. This is in lieu of manufacturer’s standard compressors in packaged chillers.
• Propane refrigerant in lieu of typical R123, R134a or R717 (anhydrous ammonia). Propane is not necessarily the most efficient refrigerant for a TIC application, but has the benefit of already being in use
13
in the majority of LNG liquefaction plants. Proper handling and operation of these systems is therefore already in practice, as opposed to working with a totally separate commodity.
• Conformance to other typical Oil & Gas standards used in LNG liquefaction plants, including NFPA 59A • Refrigerant condensers conforming to API 661 (air cooled units)
• Design and construction for use in hazardous area (Class 1 Div 2 or equivalent)
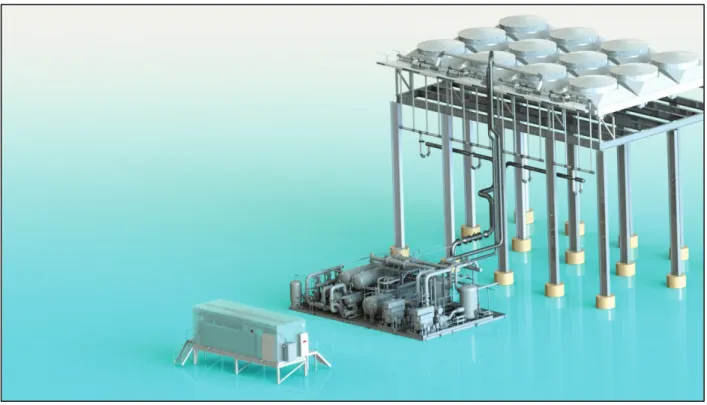
A TIC system designed for the LNG liquefaction plant environment is shown in Figure 11. The graphic actually shows one of two identical modules that combined provide chilled water to a series of 6 x PGT25+G4 gas turbines in an LNG Train.
Figure 11 – Typical Air Cooled TIC System for LNG
The heart of the system shown in Figure 11 is at the center of the graphic – the chiller module – with a more detailed view shown in Figure 12.
14
Figure 12 – TIC for LNG Screw Chiller Module
The chiller module shown in Figure 12 contains, left to right, two oil flooded screw compressors, each fitted with a 2000 kW electric motor and oil separator, a common propane receiver and two propane evaporators with knockout drums used for liquid propane separation. Not visible in this view, but located at the far right are chilled water pumps and a diaphragm type chilled water expansion tank.
Additionally shown in Figure 11 in the foreground is an optional electrical room. This room contains all of the system switchgear as well as a PLC based control system. In this case, the electrical room is shown at a distance from the chiller module since it was intentionally designed for a non-hazardous area. In the background are a series of air cooled condensers that provide heat rejection to atmosphere for this system. 3.8 TIC Systems with Thermal Energy Storage (TES)
The TIC systems discussed above can be categorized as being of the “on-line” type, where the cooling generated by the chiller plant at any given time must match the cooling duty required by the cooling coils plus other minor refrigeration loads such as heat gain to piping loops etc. A second category of TIC systems exists that uses Thermal Energy Storage in an effort to reduce the overall size of the refrigeration plant and improve system performance.
A simplified schematic of a chilled water based TES system is shown in Figure 13. This system uses a large, insulated atmospheric chilled water tank to store chilled water that is produced by the chiller plant. This type of system is often used in the power generation industry as a “Full Shift” TES application, where chilled water is generated at night, stored in the tank and then harvested during the day. This allows the chiller plant to be shut off during the hottest parts of the day, avoiding the associated high electrical load when the objective of the power plant is to sell as much power as possible during hours of peak demand.
15
Figure 13 – Simplified Schematic of TIC System with Thermal Energy Storage (TES)
In the LNG plant, the operating scenario is quite different. The TES system is operated as a “Partial Shift” or “Load Leveling” system, which takes advantage of potentially high variations in cooling load between daytime and nighttime. This is illustrated in Figure 14 where the upper line represents the hourly design day cooling load for the system, in this case approximately 9500 TR. By taking advantage of the hourly cooling load fluctuations, the capacity of the chiller plant can then be selected based on the average load rather than the peak, in this case approximately 8300 TR. Operation over the course of the design day has the chiller plant operating at full capacity. From hour 1 through hour 7, the capacity of the chiller plant exceeds the coil load so the excess capacity is used to charge the TES tank, often referred to as the “build cycle”. From hour 7 through to just before hour 20, the coil load exceeds the chiller plant capacity so this is supplemented using stored chilled water from the TES tank, often referred to as the “burn cycle”. The “build cycle” continues from hour 20 to 24.
Aside from TES systems that store chilled water, other systems are commercially available that store cooling capacity in the form of a material phase change, the most common of these being ice storage systems. Generally speaking, the only inherent advantage of an ice storage system is reduced volume/footprint of the TES tank. An ice storage system takes advantage of the heat of fusion of water - approximately 334 kJ/kg. Compared with the specific heat of liquid water at approximately 4.183 kJ/kg*K it is clear why the volume for the ice storage system is lower. On the other hand, chilled water storage is much more economical both to build and operate and inherently more reliable. Ice storage systems should therefore be considered only when the space required for chilled water TES is not available.
In the unlikely event of an equipment failure or power loss in the chiller plant, the TES system also provides reserve cooling capacity that can be used in the event of an incident such a chiller trip. Depending on the system design, this buffer can be made sufficiently large to allow uninterrupted chilled water service while the failure in the chiller plant is repaired or a standby unit started.
16
During periods where the daily average load is less than the chiller plant capacity, the chiller plant can be turned down or completely turned off during periods of the day to maximize overall system efficiency.
Figure 14 – Typical Design Day Operating Profile for TIC/TES System 4.0 CONCLUSIONS
Various methods have been described in this paper for CTIAC along with their relative merits. Ultimately it is at the discretion of the plant designer to determine the optimal solution and furthermore what set of ambient design criteria and target leaving air temperatures should be used. This analysis needs to take into account long term weather data for the site as well as detailed plant performance data.
Mechanical vapor compression TIC systems offer significant advantages as compared to competing technologies:
• Ability to cool the air to a consistent temperature, far below the prevailing wet bulb and dewpoint temperatures. An appropriately designed TIC system can allow the gas turbine to operate at near constant power output and allow optimization of compressor selection for the liquefaction process. • Zero water consumption for air cooled systems
• Can typically use same propane refrigerant used in first stage of most liquefaction processes although other refrigerants are available.
• High reliability and availability, especially for systems that are designed to typical Oil & Gas standards
• Ability to reduce chiller plant refrigeration capacity and associated electrical load by incorporating TES
• Safe, proven technology, used in hundreds of gas turbine installations worldwide for more than 25 years.