Laci Loew David Wentworth
October 2013
Leadership: The State of
Development Programs
2013
Research-based
Industry Perspective
Leadership: The State of
Development Programs
2013
Research-based Industry Perspective
Leadership: The State of
Development Programs
2013
By:
Laci Loew,
Principal Analyst and Talent Management Practice Leader
David Wentworth,
Senior Learning Analyst
Leadership: The State of
Development Programs
2013
TABLE OF CONTENTS
Executive Summary 6 Research Methodology 7Analysis of Key Survey Findings 9
FIGURE 1: OVERALL, HOW EFFECTIVE DO YOU CONSIDER YOUR ORGANIZATION’S
LEADERSHIP DEVELOPMENT PROGRAM? 10
FIGURE 2: PERCENTAGE OF TRAINING BUDGET SPENT ON LEADERSHIP DEVELOPMENT BY
REPORTED EFFECTIVENESS 11
FIGURE 3: HOW DOES YOUR ORGANIZATION'S CURRENT BUDGET FOR LEADERSHIP
DEVELOPMENT COMPARE TO THE BUDGET FROM THE PREVIOUS FISCAL YEAR? 12 FIGURE 4: DOES YOUR ORGANIZATION HAVE A FORMAL LEADERSHIP DEVELOPMENT
STRATEGY? 13
FIGURE 5: ORGANIZATIONS REPORTING VERY OR EXTREMELY EFFECTIVE PROGRAMS 13 FIGURE 6: ORGANIZATIONS REPORTING AN INCREASE IN A MAJORITY OF THEIR KPIS 14 FIGURE 7: ORGANIZATIONS REPORTING VERY OR EXTREMELY EFFECTIVE LEADERSHIP
DEVELOPMENT PROGRAMS 15
CONCLUSIONS AND STEPS FORWARD 16
The High-Performance Integrated Leadership Development Framework 17 Elements of the High-Performance Leadership Development Framework 19 FIGURE 8: PHASE 1: PLAN LEADERSHIP NEEDS 22 FIGURE 9: PHASE 2: ASSESS LEADERSHIP PIPELINE 23 FIGURE 10: PLACE LEADERS IN BUSINESS CRITICAL POSITIONS 24 FIGURE 11: MEASUREMENT STRATEGIES AT HPOS 27
Company Size/Industry Analysis 30
FIGURE 12: THE POOL OF RESPONDENT ORGANIZATIONS WAS EVENLY SPLIT ACROSS THREE DIFFERENT SIZE CATEGORIES: SMALL, MEDIUM AND LARGE. 30 Remaining Survey Questions and Analysis 31
CONTEXTUAL SURVEY QUESTIONS 31
FIGURE 13: WHICH OF THE FOLLOWING BEST DESCRIBES YOUR COMPANY'S TOP TWO
Leadership: The State of
Development Programs
2013
FIGURE 14: WHICH OF THE FOLLOWING MOST CLOSELY CHARACTERIZES YOUR
ORGANIZATION'S CULTURE? 32
FIGURE 15: WHICH OF THE FOLLOWING BEST DESCRIBES YOUR ORGANIZATION'S CURRENT
BUSINESS DEVELOPMENTAL PHASE? 33
FIGURE 16: WITH REGARD TO YOUR ORGANIZATION'S LEADERSHIP DEVELOPMENT
PROGRAM, HOW IS THE BUDGET ALLOCATED ACROSS THE FOLLOWING GROUPS? 34 FIGURE 17: PLEASE ESTIMATE HOW FULL-TIME EMPLOYEE RESOURCES FOR LEADERSHIP
DEVELOPMENT ARE ALLOCATED. 35
FIGURE 18: HAS YOUR COMPANY’S REVENUE GONE UP OR DOWN IN LAST FISCAL YEAR? 36 FIGURE 19: WHICH OF THE FOLLOWING MOST CLOSELY DESCRIBES YOUR ORGANIZATION’S
CURRENT PERFORMANCE STATUS? 37
FIGURE 20: HAVE YOUR EMPLOYEE ENGAGEMENT METRICS GONE UP OR DOWN IN THE LAST YEAR? (EMPLOYEE TURNOVER, ABSENTEEISM, PRODUCTIVITY, EMPLOYEE
SATISFACTION, ETC.) 38
LD PROGRAM STRUCTURE AND PARTICIPATION 39 FIGURE 21: TO WHAT EXTENT ARE THE FOLLOWING CONSIDERED DRIVERS FOR THE EXISTENCE OF YOUR ORGANIZATION'S LEADERSHIP DEVELOPMENT PROGRAM? 39 FIGURE 22: WHICH EMPLOYEES ARE ELIGIBLE FOR YOUR LEADERSHIP DEVELOPMENT
PROGRAM? 40
FIGURE 23: DOES YOUR ORGANIZATION FORMALLY IDENTIFY HIGH POTENTIAL
EMPLOYEES? 40
FIGURE 24: DOES YOUR LD PROGRAM INCLUDE ANY OF THE FOLLOWING ELEMENTS? 41 FIGURE 25: WHICH TYPES OF EXPERIENTIAL/ON-THE-JOB TRAINING IS PART OF YOUR
LEADERSHIP DEVELOPMENT PROGRAM? 42
LEADERSHIP DEVELOPMENT EFFECTIVENESS 43 FIGURE 26: WHAT PERCENTAGE OF YOUR ORGANIZATION’S LEADERSHIP HAS GONE THROUGH THE LEADERSHIP DEVELOPMENT PROGRAM IN THE LAST 12 MONTHS? 43 FIGURE 27: HOW EFFECTIVE DO YOU FIND EACH OF THE FOLLOWING TOOLS FOR
ASSESSING CANDIDATES FOR LEADERSHIP DEVELOPMENT PURPOSES? 44 FIGURE 28: DOES YOUR ORGANIZATION HAVE A SET OF DEFINED LEADERSHIP
Leadership: The State of
Development Programs
2013
FIGURE 29: DOES YOUR ORGANIZATION HAVE A PROCESS IN PLACE TO IDENTIFY GAPS IN
LEADERSHIP? 46
FIGURE 30: DOES YOUR ORGANIZATION HAVE A FORMAL LEADERSHIP SUCCESSION PLAN? 46 FIGURE 31: WHAT PERCENTAGE OF YOUR ORGANIZATION’S LEADERS CURRENTLY HAVE
DEVELOPMENT PLANS IN PLACE? 47
FIGURE 32: WHAT PERCENTAGE OF YOUR ORGANIZATION'S OPEN LEADERSHIP POSITIONS HAVE BEEN FILLED INTERNALLY IN THE LAST 12 MONTHS? 48 FIGURE 33: WHICH OF THE FOLLOWING METRICS DOES YOUR ORGANIZATION USE TO MEASURE THE EFFECTIVENESS OF THE LEADERSHIP DEVELOPMENT PROGRAM? 49 LEADER DEVELOPMENT PROGRAM RESPONSIBILITY 50 FIGURE 34: WHICH FUNCTION HAS PRIMARY RESPONSIBILITY FOR THE LEADERSHIP
DEVELOPMENT PROGRAM? 50
FIGURE 35: IN WHAT COUNTRY IS YOUR COMPANY HEADQUARTERED? 51 FIGURE 36: HOW WOULD YOU DESCRIBE THE GEOGRAPHIC DISTRIBUTION OF YOUR
WORKFORCE? 52
FIGURE 37: WHICH OF THE FOLLOWING BEST DESCRIBES YOUR INDUSTRY? 53 FIGURE 38: PLEASE PROVIDE YOUR ORGANIZATION'S ANNUAL REVENUE FOR THE MOST
RECENT FISCAL YEAR. 54
FIGURE 39: WHICH BEST DESCRIBES YOUR CURRENT ROLE (NOT TITLE) IN YOUR
ORGANIZATION? 54
About Brandon Hall Group 55
Leadership: The State of
Development Programs
2013
Executive Summary
Ensuring a solid pipeline of suitable leaders has proven to be a daunting task for many organizations of all sizes and in all industries.
Organizations are facing a retirement boom that will drain them of their intellectual capital and know-how. To make matters worse, the incoming talent into organizations does not possess the requisite leadership skills needed to drive results in functional areas, business units and across the enterprise. And Leadership Development programs that organizations have developed to address the problem – many of them still in their infancy – are not producing the results organizations need.
Almost 75% of respondents to Brandon Hall Group’s 2013 Leadership Development Benchmarking Survey said their Leadership Development programs are not very effective. In separate research, Brandon Hall Group’s 2013 Skills Gap Survey, respondents said leadership concerns were the second biggest factor impacting the hiring, retention and performance of their skilled workforce.
But these troubling results are not because of a lack of effort or focus. Two separate Brandon Hall Group surveys – Business Focus ’13 and the 2013 Team Development Survey – found that organizations ranked Leadership Development (LD) as their second most important issue toward which they would be devoting significant time, energy and resources.
So with all this focus on Leadership Development, why aren’t organizations doing better? While there are no easy answers, and they undoubtedly differ from organization to organization, Brandon Hall Group’s research on Leadership Develop shows that organizations are dramatically more satisfied with their LD programs when:
A specific LD strategy is in place.
Spending on LD in the training budget is higher.
The LD programs have been in existence 5 years or longer.
This paper offers a powerful combination of data, analysis and strategic guidance for organizations trying to solve the Leadership Development puzzle:
Detailed results of Brandon Hall Group’s 2013 Leadership Development Benchmarking Study, including:
Leadership: The State of
Development Programs
2013
o Leadership Development’s place in overall training strategy and budgets
o Effectiveness and measurements of Leadership Development practices
o The allocation of resources for LD
o The relationship between effectiveness of LD programs and the amount of time they have been in existence.
o LD accountability
o Identification of potential leaders
A framework option to consider when evaluating your next steps in refining your Leadership Development strategy or program, Brandon Hall Group’s new High-Performance Integrated Leadership Development Framework. It defines and explains 10 critical components upon which mature and effective leadership development rests:
o External Influencers
o Strategic Alignment
o Organizational Climate
o Employee Experience
o Integrated Leadership Development Process Cycle
o Governance
o Technology
o Measurement
o Business Results
o Success Levers
Armed with the latest data on the state of Leadership Development, and specific foundations for building organizational capability to drive business results, Brandon Hall Group offers you a clear path toward establishing progressive LD programs that can drive breakthrough results.
Research Methodology
Brandon Hall Group has studied the leadership practices and LD activities of High-Performing Organizations (HPOs) and their lower-performing peers (LPOs). Our methodology is a 4-tiered approach:
1.
Empirical Data: We conducted an online survey in July and August 2013, garnering a
total of 329 responses from a wide variety of industries and company sizes. The survey included 38 questions, including demographic questions. This data will provide the
Leadership: The State of
Development Programs
2013
foundation for additional interviews and research papers concerning Leadership Development.
2.
Qualitative Discussions: We interviewed solutions providers as well as senior HR and talent leaders, executives, business unit leaders, and employees at all levels in organizations of all sizes representing all industries across the globe.3.
Refereed Research: We reviewed, studied, and analyzed empirically-based primary
published research from academic and business institutions.
4.
Resident Knowledge:
We drew upon the knowledge and extensive experience amongthe analyst community within our organization.
Our multi-tiered, multi-month global study isolated the leading practices of those organizations that gain the greatest business impact from their leadership strategy and LD activities. We analyzed the timing, target audiences, processes, stakeholders, metrics, and business results associated with those practices. Our examination enabled us to formulate a new analytics-based High-Performance Integrated Leadership Development Framework as an option for organizations wanting a different perspective on LD. The framework comprises the must-have, high-stakes elements and themes salient to leadership strategy and Leadership Development activities that build organizational capability and enable leaders to achieve breakthrough business results at the unparalleled levels found in HPOs.
Leadership: The State of
Development Programs
2013
Analysis of Key Survey Findings
Among all the data collected for the 2013 Leadership Development survey, Brandon Hall Group found six findings to be the most significant:
About 75% of organizations surveyed said their LD program was not very effective.
Those organizations that did rate their LD programs very or extremely effective spent, on average, 60% more on LD than did organizations with programs rated slightly effective or not at all effective.
Half of organizations have seen the Leadership Development budget remain stagnant and 20% have seen decreases. Yet those that have increased the budget are 65% more likely have very effective or extremely effective programs.
Less than half of organizations surveyed said they had a formal LD strategy, but those that did were far more likely to rate their programs as extremely effective or very effective.
Nearly 63% of companies with formal LD strategies reported that the majority of their Key Performance Indicators (KPIs) had improved -- 76% better than organizations with no strategy and no strategic plans in development.
Organizations with LD programs in existence 5 years or longer rated them extremely or very effective twice as often as those with programs 2 years old or less.
Leadership: The State of
Development Programs
2013
1.
Almost 75% of organizations surveyed said that their Leadership
Development program was not very effective.
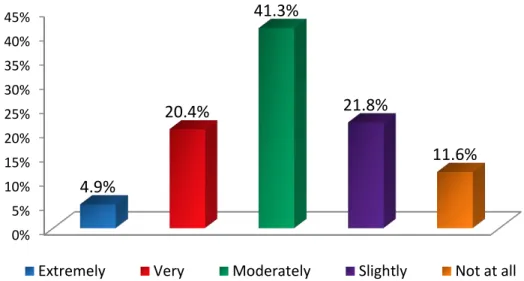
Figure 1: Overall, how effective do you consider your organization’s Leadership Development program?
Nearly 75% of organizations said that their LD program was not very effective. More than twice as many respondents said their programs were completely ineffective (11.6%) than they did extremely effective (4.9%). This signifies a disconnect between the established importance of Leadership Development and an organization’s ability to execute on it. There are, however, several factors that influence effectiveness. As explained in the results below, the effectiveness of Leadership Development programs increases significantly when organizations spend more of their training budget on LD, have a specific Leadership Development strategy in place, and when LD programs have been in existence more than five years. 0% 5% 10% 15% 20% 25% 30% 35% 40% 45% 4.9% 20.4% 41.3% 21.8% 11.6%
Leadership: The State of
Development Programs
2013
2.
Respondents who rated their LD programs either very or extremely
effective dedicated, on average, 60% more resources in their training budgets
than those who said their LD programs were either slightly or not at all
effective.
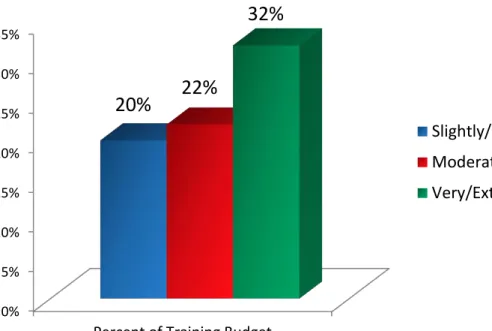
Figure 2: Percentage of Training Budget Spent on Leadership Development by Reported Effectiveness
Those organizations that spend a bigger chunk of their training budget on leadership development are typically happier with the results. The companies reporting very or extremely effective programs spend an average of 32% of their training budget on leadership development. Those reporting slightly or totally ineffective programs spend 20%. Brandon Hall Group believes that, given its drivers and impact, Leadership Development is actually a talent initiative that should have its own independent, dedicated budget and not be tied to the training budget. That would prevent leadership from having to compete for dollars with initiatives such as compliance and job-specific skills.
0% 5% 10% 15% 20% 25% 30% 35%
Percent of Training Budget
20%
22%
32%
Slightly/Not at all Moderately Very/Extremely
Leadership: The State of
Development Programs
2013
3.
Half of organizations have seen the Leadership Development budget
remain stagnant and 20% have seen decreases. Yet those who have increased
the budget are 65% more likely have very or extremely effective programs.
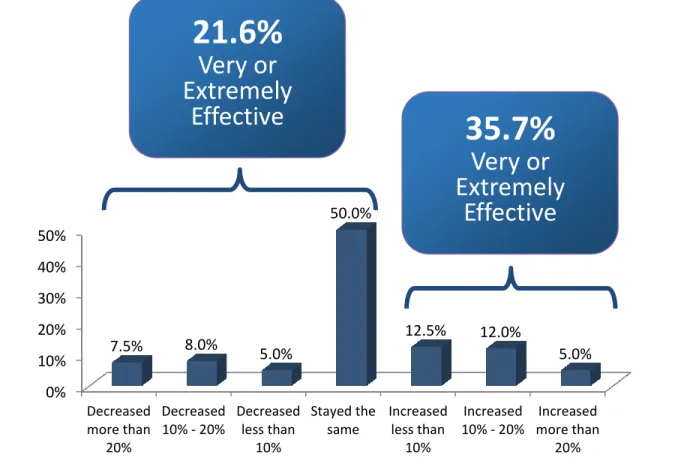
Figure 3: How does your organization's current budget for Leadership Development compare to the budget from the previous fiscal year?Half of organizations saw no change in their Leadership Development budgets from the previous year, which is not surprising given the economic climate and the continuing push to rein in budgets. However, those organizations that did see increases (about 30%) are much more likely to give their programs high marks for effectiveness. Almost 36% said they had very or extremely effective programs, while only 21.6% of those who did not see increases said the same. There is also a correlation between LD strategy and budget increases; about 32% of respondents with a formal strategy saw a budget increase, compared to only 20% of those without. 0% 10% 20% 30% 40% 50% Decreased more than 20% Decreased 10% - 20% Decreased less than 10% Stayed the same Increased less than 10% Increased 10% - 20% Increased more than 20% 7.5% 8.0% 5.0% 50.0% 12.5% 12.0% 5.0%
35.7%
Very or
Extremely
Effective
21.6%
Very or
Extremely
Effective
Leadership: The State of
Development Programs
2013
4.
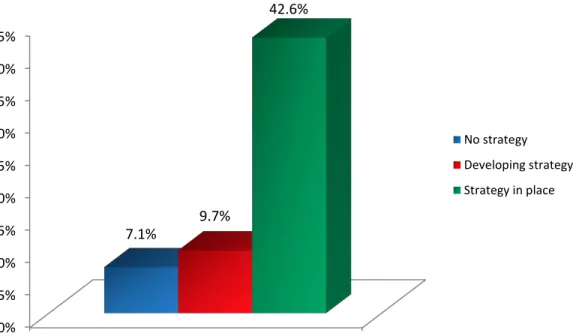
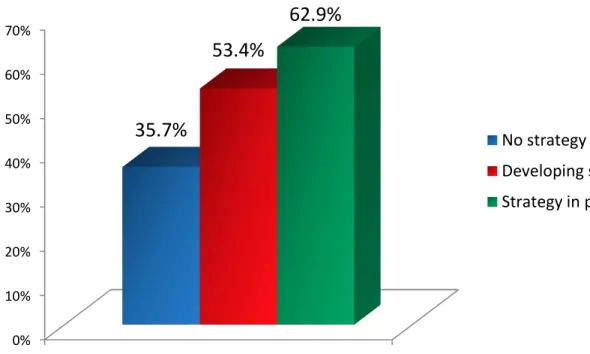
About 44% of organizations surveyed said they had a formal Leadership
Development strategy. Among those that do have strategies in place, 42.6%
rated the Leadership Development programs as extremely or very effective –
that’s 68% higher than the overall result of 25.3%.
Figure 4: Does your organization have a formal Leadership Development strategy?
Figure 5: Organizations Reporting Very or Extremely Effective Programs
0% 5% 10% 15% 20% 25% 30% 35% 40% 45%
Existence of Leadership Development Strategy
7.1% 9.7% 42.6% No strategy Developing strategy Strategy in place
Leadership: The State of
Development Programs
2013
Overall, 56% of organizations have no formal leadership development strategy. The good news is that 61% of those without a strategy said they were in the process of developing one. Yet, more than 20% of organizations have no strategy and no plans to develop one. This is significant because those organizations with a strategy in place are far more likely to say their leadership development programs are effective. Close to 43% of companies with a formal strategy in place say their program is either very or extremely effective – that’s 68% more than the overall result of 25.3% and six times greater than organizations with no strategy (and no plans to develop one.)
5.
Nearly 63% of companies with formal Leadership Development strategies
reported that the majority of their Key Performance Indicators (KPIs) had
improved. That is 76% better than organizations with no strategy and no
strategic plans in development.
Figure 6: Organizations Reporting An Increase in a Majority of their KPIs
Not only do those organizations with a strategy in place report increased program effectiveness, but they are also more likely to report that a majority of their KPIs have increased over the past fiscal year. A little more than one-third of those organizations with no strategy and no plans to develop one saw positive movement from their KPIs, while
0% 10% 20% 30% 40% 50% 60% 70%
Existence of Leadership Development Strategy
35.7%
53.4%
62.9%
No strategy Developing strategy Strategy in placeLeadership: The State of
Development Programs
2013
nearly 63% of those with a strategy saw improvement. Organizations that are even just in the process of developing their strategies do better than those that are doing nothing. This correlation indicates that as companies begin to get their arms around the LD issue, they also see across the board business improvements.
6.
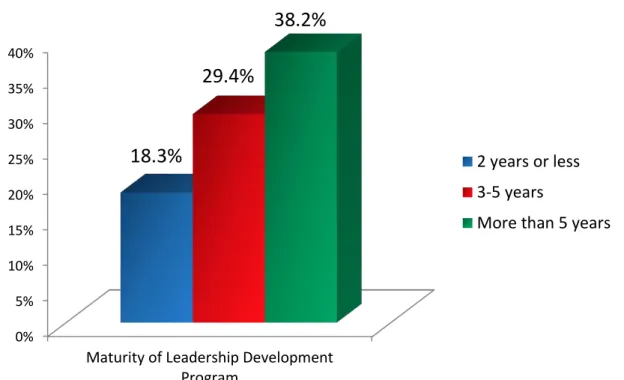
There is a direct correlation between LD program maturity and
effectiveness. Only 18% of programs 2 years old or less are considered very or
extremely effective, while 38% of programs older than 5 years are seen as
that effective.
Figure 7: Organizations Reporting Very or Extremely Effective Leadership Development Programs
The maturity of an organization’s leadership development program has a big influence on effectiveness. Essentially, the longer a program has been in place, the more effective it is. The fact that 51% of all programs are less than two years old clearly has an impact on overall effectiveness ratings. It’s not that overall so many companies have poor programs in place; it’s that most of them are still early on the maturity curve.
0% 5% 10% 15% 20% 25% 30% 35% 40%
Maturity of Leadership Development Program
18.3%
29.4%
38.2%
2 years or less 3-5 yearsLeadership: The State of
Development Programs
2013
Conclusions and Steps Forward
From all the data described above, it’s clear that the effectiveness of LD programs depends on the investment of resources, development of a formal strategy, and the time needed to allow the programs -- and the people in them -- to mature and develop. Failure to invest and develop strategies that allow for consistent and effective execution of LD programs will mean organizations will continue to struggle to develop the leaders necessary to drive breakthrough business results.
Because almost 56% of organizations surveyed lack a dedicated strategy, it's clear that Leadership Development -- while important -- is difficult to conceptualize into a formal strategy. It is a complex process that requires a focus on both external and internal influencers, investment and development in technology that enables continual learning, continual measurement of the LD program and its participants, establishment of governance, and many other factors.
Brandon Hall Group analysts, led by Laci Loew, Principal Analyst and Talent Management Practice Leader, have used this Leadership Development research and prior research, plus extensive experience collaborating on LD with global organizations, to develop a High-Performance Integrated Leadership Development Framework. The framework is illustrated and explained in the following pages. Brandon Hall Group offers this framework to organizations as an option for analyzing their own systems, processes and culture to develop a definitive, sophisticated course of action to strategically address the issues that are inhibiting Leadership Development success.
Leadership: The State of
Development Programs
2013
The High-Performance Integrated Leadership Development Framework
As our research shows, Leadership Development is a difficult proposition fraught with challenges. Brandon Hall Group developed the High-Performance Leadership Development Framework to provide a consistent way for organizations to think about and plan for implementing and sustaining the most mature leadership development.
The framework offers a picture of 10 key elements that offer inputs and outputs to each other and enables organizations to quickly assess which elements might be missing from their LD models. These 10 integrated elements in Brandon Hall Group’s High-Performance Leadership Development Framework create the heart and pulse of the model:
External Influencers
Strategic Alignment
Organizational Climate
Employee Experience
Integrated Leadership Development Process Cycle
Governance
Technology
Measurement
Business Results
Success Levers
The illustration of the framework is on the next page, followed by detailed descriptions and guidance for moving your Leadership Development program forward.
Leadership: The State of
Development Programs
2013
Leadership: The State of
Development Programs
2013
Elements of the High-Performance Leadership Development Framework
1.
External Influencers.
The four main environmental forces impacting an organization’sdecisions about leadership and LD are:
The industry in which the organization is a member
The current state of the economy.
The impact of changing demographics in today’s world.
Government – the political movements and legislation that may impact the organization’s business and leaders
The financial crisis of 2008-2009 rendered many businesses obsolete and thwarted LD for many; only the strongest performing organizations remained committed to LD investment. This chaotic, turbulent and rapidly changing environment is often referred to as VUCA (volatile, uncertain, complex, and ambiguous) – a term coined in the late 1990s by the military when referring to an increasingly unstable and rapidly changing environment. This VUCA environment challenges even the most competent of leaders who find their skills grow obsolete and their experiences become stale as their organizations react and respond in today’s unpredictable landscape. More than ever, effective leaders make continuous shifts in their approach to work and problem solving. Leaders in high-performing organizations (HPOs) are adaptable, flexible, agile thinking and re-thinking on-the-fly.
The impact of the world’s demographics is another external influencer on organizations’ approach to LD. In today’s workforce, there are nearly 79 million Baby Boomers, 70 million Gen Xers, and 80 million from Gen Y. We expect this growth trend to continue for the next five to seven years, at which time a very small number of professionals from Gen Y may be seasoned enough to enter organizations’ succession planning processes. In short, retiring Boomers are difficult to replace because Gen X is small and Gen Y is not yet skilled enough to step up. With this in mind, organizations are faced with critical gaps in leadership skills and pipelines. As the demographic variances steepen, it is not surprising that our research revealed “the need to fill leadership positions internally (from our bench)” as the number one driving force for LD.
2.
Strategic Alignment.
The single greatest point of failure for most organizations isdesigning and implementing core LD programs before:
Leadership: The State of
Development Programs
2013
Reviewing the alignment of each business unit’s strategy with the corporate strategy.
Understanding the linkage between the corporate and business strategies with the enterprise’s integrated talent management strategy.
Defining the organization’s leadership strategy.
To the last point, almost 56% of survey respondents indicated that their organizations do not have any leadership strategy, or at best, are in the process of developing one (even though core LD programs have already been rolled out). A leadership strategy is a long-term, focused plan ensuring an organization has the right number of leaders, at the right locations, with the right capabilities to sustain and thrive today, tomorrow and going forward.
An LD strategy offers insights and provides answers to:
The leadership skills and traits needed to execute on the corporate strategy and the business unit (BU) strategies.
Leaders’ talents and opportunities and critical leader gaps as revealed by the organization’s integrated talent management (ITM) strategy.
The acquisition, development, promotion, re-alignment, reward, and/or mobility actions and decisions necessary to drive achievement of the organization’s corporate,
BU, and ITM strategies.
Failure to plan and assess for leadership needs before launching strategic leadership development solutions leaves organizations with a set of stand-alone LD programs that at best can grow individual leaders’ skills, but not build the skills needed to achieve business goals. The implication of strategically misaligned LD programs is critical gaps in key leader positions across all levels of the organization.
3.
Organizational Climate.
Many refer to organizational climate as “corporate climate.”Simply put, it is employees’ perceptions about what it feels like to work in a place. As it relates to leadership and LD, a company’s organizational climate is influenced by three key factors:
Leader styles.
Leader skills and traits.
The company’s values, vision, and mission.
Positive corporate climate is not a goal unto itself. It is, however, a key link in how employees experience leadership development. Leaders at HPOs take extra effort to model
Leadership: The State of
Development Programs
2013
leader skills and traits in alignment with the company’s core values, vision and mission. Their behavior ignites this chain reaction:
Leaders’ behaviors account for approximately 70 percent of the variability of an organization’s climate.1 HPO leaders influence organizational climate through three dimensions:
Leaders improve the clarity of company values and goals.
They encourage employees and peers to adopt commitment to business, talent, team, and individual performance goals.
They hold themselves and others to accountability standards.
HPOs report a direct correlation between organizational climate and employee motivation and employee stress levels as well as between organizational climate and business results, including revenue targets, sales growth, and productivity.
Leaders’ styles and behaviors play an integral role in shaping employees’ measurement of the positive (or negative) influence of climate on their motivation and performance. To this end, it is imperative for organizations to be intentional about the leader styles and traits that are accepted and expected. Without that insight, organizations will surely hire, develop, and place leaders whose DNA is not aligned with the organization’s climate. Such misalignments will serve to erode overall performance and business results – the very goal of Leadership Development.
4.
Employee Experience.
HPOs strive to create a “great place to work” whereemployees feel motivated, inspired, challenged, proud, and professional. As it relates to LD, employees in HPOs participate in a true beginning, middle, and end. The employees’ experience with Leadership Development starts with the company’s organizational climate
1
George H. Litwin and Robert A. Stringer, Motivation and Organizational Climate, Harvard Business School Publications, 2008.) research
improve
climate
increase
employee
motivation
enhance
performance
Leadership: The State of
Development Programs
2013
index. The output of the employees’ experience with Leadership Development is employee engagement (or disengagement).
5.
Integrated Leadership Development (ILD) Process Cycle. The Integrated
Leadership Development Cycle itself is characterized by three phases:
Phase 1: Plan Leadership Needs
Phase 2: Assess the leadership pipeline
Phase 3: Place leaders in business-critical positions Figure 8: Phase 1: Plan Leadership Needs
Leadership: The State of
Development Programs
2013
Planning for Leadership Needs is a two-step process:
Leader segmentation
Leader identification
During segmentation, leaders are sorted by organizational level and the number of high-potential leaders at each level is recorded. Factor review is the process of examining and identifying leaders at each organizational on five separate criteria:
By position transitions: those moving from individual contributor to leader of people and those moving from leader of people to leader of the organization.
By potential rating: those in a ready-now status versus ready-later status for the next-level role.
By critical position: those in critical leader roles (versus non-critical leader roles).
By business unit/geography/market/function: those in each organizational area indicated.
By team performance: those who demonstrate effective team leadership skills (versus those who are stronger at leading in an individual contributor capacity). Figure 9: Phase 2: Assess Leadership Pipeline
Assessing the Leadership Pipeline is also a two-step process:
Leader identification
Leadership: The State of
Development Programs
2013
During leader identification, organizations determine their current supply and their future demand of leaders at each level against each of the five leader factors (position transitions, potential rating, critical positions, BU/geography/market/function, and team performance). This exercise reveals critical gaps that may exist in the leadership pipeline. The gap data fuels the organization’s strategic direction and investment decisions in core LD programs for each leader level.
Less than 25% of our research respondents indicated that they make LD available for all employees, and the same number has not yet defined the critical leader skills/traits/competencies essential for achievement of business goals. This data reveal the breadth and depth of opportunity that many organizations still have to leverage their leaders as a true strategic asset.
Figure 10: Place Leaders in Business Critical Positions
During the Place Leaders phase, organizations conduct talent reviews, create succession plans, mobilize “ready-now” leaders, and strengthen their leadership pipeline with those completing development plans whose strengths, skills and traits align with the organization’s business needs.
6.
Governance.
Governance is the structures, processes, and values that enable anorganization to make credible, well-aligned, efficient decisions about leadership strategy, organizational climate, core LD programs, resources, technology, measurement of the business impact of LD, and the degree to which LD enables corporate sustainability. Organizations that make the most efficient, effective, and responsible decisions regarding LD are more likely to be the place of choice for employees and customers alike.
HPOs utilize governance; Low-Performing Organizations (LPOs) do not. Governance moves an organization from one that is offering a portfolio of stand-alone LD programs to one that
Leadership: The State of
Development Programs
2013
is transforming its organizational capability via an integrated offering of development solutions. The integrated solution builds a group of leaders that comes together collaboratively and intentionally to achieve business goals and better serve the organization’s customers and stakeholders in a sustainable fashion.
7.
Technology.
Technology has changed organizational life in many ways. It has impactedhow knowledge and information are disseminated, gathered, and shared. It has changed how employees communicate with each other across business units, across the organization, and across the globe. It has impacted virtually every talent process. And finally, it has had profound implications on leadership and LD in at least two specific ways:
The effective use of technology in LD
The level of technological savvy expected of today’s leaders
The availability of technology in LD has dramatically reduced the need for in-person classroom training, which is important for organizations trying to keep LD costs contained in the era of global expansion and dispersed work teams. While almost 80% of survey respondents to Brandon Hall Group’s survey indicated that they still ask leaders to travel to training programs, more than 40% of those indicated that plans were in place to leverage virtual classroom development experiences.
Technology brings advantages to LD never before possible. They include reach and scalability, convenience and lower cost of delivery, consistency and methods of learning expected in our virtual, global workplaces thick with up-and-coming leaders who have been raised on technology.
While the promise and expectations of technology are real, we are not suggesting that cloud-based LD programs replace in-person leader development; in fact, we believe that will never be the case. We are suggesting, however, that technology is essential in helping today’s leaders build themselves. Without it, the value of their in-classroom development opportunities will be minimal at best.
Technology has not only transformed how leaders learn, but technological savvy has rapidly become an integral aspect of leadership effectiveness – in fact, a requirement of today’s leaders. Leading virtually is standard in today’s workplaces. Requirements for leaders to communicate with and lead geographically dispersed teams and telecommuters will only increase. Technology will be a critical tool for these challenges and today’s leaders will only become tomorrow’s leaders if they use it at will.
Leadership: The State of
Development Programs
2013
8.
Measurement. Many CEOs, particularly at HPOs, cite the lack of qualified leadership as
the most significant constraint on business growth. Thus, the pressure on executives to quantify the impact of their leadership strategy and LD programs is greater than ever. Unlike a sales function that can report planned and actual margin and revenue goals, measuring the business impact of leadership and leadership development will always have some degree of subjectivity. Leaders are people; no two are the same, and they approach business differently. Accordingly, some organizations feel overwhelmed by the prospect of defining and implementing a measurement strategy in the leadership and LD space. While the concern is real and understood, it doesn’t dismiss the fact that a way to indicate the business impact of LD is vital, in fact non-negotiable.
Organizations’ measurement goals vary. Some wish to know if the instructional design is sound (Level 1). Others want to know if the learners mastered the skill (Level 2) or have been able to transfer any learning to the job (Level 3). Yet others are more interested in the true business impact (Levels 4/5). The real value comes in the ability to determine and report on the business impact contribution that LD offers at the team level (organizational climate) and at the enterprise level (business results).
Organizations’ learning and LD functions are either “at the table” with executive leadership and other functional leaders discussing the business value that LD offers or, more commonly, are “on the stake” being scrutinized as a cost center with little, if any, value-add to the business. The expectation at HPOs is a measurement mind-set. These HPO measurement practices are instrumental in earning organizations a place “at the table” and ensuring their core LD programs indicate business impact.
The figure on the next page summarizes strategies that HPOs use to optimize measurement of LD programs.
Leadership: The State of
Development Programs
2013
Figure 11: Measurement strategies at HPOs
9.
Business Results.
Leadership and leadership development is a business imperative,not a talent challenge. HPOs invest in leadership strategy and leadership development only if the outcome has an impact on business results – increased sales per head, higher engagement score, lower defects, less turnover in critical positions, higher internal promotion rate, lower external acquisition costs and the like. To guide themselves in capturing data that indicates the business impact of LD, HPOs often define two scorecards:
Leadership: The State of
Development Programs
2013
an executive scorecard and a leadership development scorecard. The executive scorecard usually reports on four items:
Sales and revenue
Processes
Operations
People. The people component includes all things HR, including employee engagement, training plans, employee benefit claims, and leadership development. Executive and leadership development score-carding extend the measurement mindset and serve to institutionalize leadership and LD as a part of the organization’s culture, thus positioning leadership development as a true strategic lever and sustainable, competitive differentiator.
10.
Success Levers.
To ensure an impact on business results, HPOs design, implement,measure, and sustain leadership strategy and development in alignment with leading practices. We call these practices success levers, and our research identified nine of them:
Enterprise-wide leadership strategy: Assessing the organization’s leadership
capacity – supply and demand – required to achieve the goals of the business as outlined in the corporate and business unit strategies.
Executive ownership of leadership strategy and LD programs: Acknowledging that leadership capacity and leadership development is not an HR challenge but is a business imperative that must therefore be championed by the CEO and the business unit leaders (and stewarded by HR and talent/LD professionals).
Organizational climate factors reflected in LD programs: Linking the very essence of what an organization values and the capabilities needed in its leaders to the content in its LD programs.
Alignment of LD programs with organizational readiness: Making intentional LD program design decisions in accordance with what the organization’s leaders are ready to experience.
Leadership: The State of
Development Programs
2013
Customization of LD programs: Standardizing 80 percent of LD program content across the enterprise and creating flex in the other 20 percent of the design and content to easily allow for business unit, locational, and or functional nuances.
Global delivery of LD programs: Enabling efficient and effective delivery of LD programs regardless of the geography or region in a fashion that does not jeopardize the quality of the experience or degrade the standard content while accommodating local content needs.
Emergent design of LD programs: Keeping designs agile to accommodate the ever-changing needs of a diverse and global leader population.
LD programs for leader position transitions: Investing in LD programs that specifically target the development needs of leaders in transition -- from individual contributor to first-level leader, from leader to executive leader, and from leader to high potential leader.
Leadership strategy and LD programs integrated with talent processes: Ensuring a holistic talent management and development process such that each process (learning and development, performance management, talent acquisition, succession management, career development, talent mobility) are integrated, with each acting collectively and interdependently, not in isolation and independently.
Without a framework for high-performance, the best-planned leadership development is no more than wishful thinking. Our Integrated Leadership Development Framework is the north light to translate LD from concept to reality and from desire to results.
Leadership: The State of
Development Programs
2013
Company Size/Industry Analysis
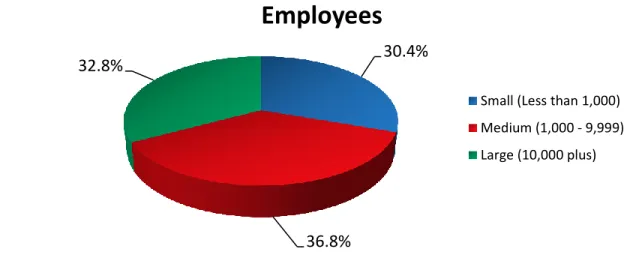
Figure 12: The pool of respondent organizations was evenly split across three different size categories: small, medium and large.
The Brandon Hall Group survey results show that a formal strategy is the key to an effective leadership development program, and in this area large organizations have a clear advantage. The likelihood that a formal strategy exists runs in parallel to the size of the organization. About 25% of small organizations have one, 48% of medium organizations do, and 64% of large organizations have a formal strategy.
The same is true for program maturity. Larger companies have programs that have been around longer than medium and small organizations. Interestingly, though, effectiveness scores do not follow that pattern, despite the overall correlation between effectiveness and strategies and program maturity. Instead, all three company sizes are equally likely to say their program is very effective (19%), but larger companies are far more likely to say their program is extremely effective (12.5%) than small or medium-sized organizations (less than 2%). Small companies are most likely to say their programs are not effective at all (17%). On average, large companies spend 26% of their training budget on leadership development. They focus that budget mostly on executive leaders (22%) and direct managers (20%). Small companies may have smaller leadership development budgets – 19% of training budget on average – but are also focused on executives, with an average of 29% of their budgets going to executives. Small companies devote 27% of the budget to individual contributors, more than large or medium-sized organizations.
30.4%
36.8% 32.8%
Employees
Small (Less than 1,000) Medium (1,000 - 9,999) Large (10,000 plus)
Leadership: The State of
Development Programs
2013
Remaining Survey Questions and Analysis
So far, we have unveiled the top research findings, a company size/industry overview, and introduced a dynamic framework to help organizations address key issues crucial for developing rich and effective LR programs. So that you can put the top research findings and framework in context, the remainder of the paper presents results and analysis of all the remaining substantive questions contained in the survey research.
Contextual Survey Questions
Figure 13: Which of the following best describes your company's top two business priorities?
Gaining market share continues to be the number one priority among respondents to this and other Brandon Hall Group surveys. Also typically in the top five are priorities including new products and services, improving innovation and recruiting and retaining talent. These are all issues that directly require solid leadership.
0% 5% 10% 15% 20% 25% 30% 35% 32.5% 23.0% 22.4% 18.0% 17.7% 15.8% 14.2% 13.6% 11.0% 8.8% 5.0% 4.7% 10.1%
Leadership: The State of
Development Programs
2013
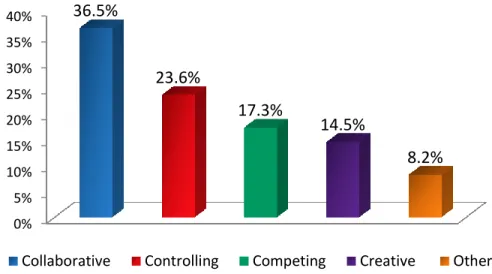
Figure 14: Which of the following most closely characterizes your organization's culture?2
More than 36% of the organizations in this survey consider themselves to have a collaborative culture. The breakdown of cultures seen here is consistent with several past surveys. The type of culture present can have a huge impact on Leadership Development, as leaders take on different roles depending on the different cultures. A collaborative culture will see a bigger focus on mentoring and coaching. A competing culture will likely have a different set of leadership competencies than a creating culture. Organizations that reported having a controlling culture were more likely to have no strategy and no plans to develop one than any of the other types of cultures represented in the research.
2
Collaborative culture: Open and friendly place to work where people share a lot of themselves. Leaders are incented to be mentors or support roles. Group loyalty and sense of tradition are strong. The organization places a premium on teamwork, participation and consensus.
Creating culture: A dynamic, entrepreneurial and creative place to work. Innovation and risk-taking are embraced by employees and leaders. A commitment to experimentation and thinking differently are incented within the organization. Leaders strive to be on the cutting edge. Individual initiative and freedom are encouraged.
Controlling culture: A highly-structured and formal place to work. Rules and procedures govern behavior. Maintaining a smooth-running organization is incented. Stability, performance and efficient operations are the long-term goals. Success is based on dependable delivery, smooth scheduling, and low cost. Management supports security and predictability.
Competing culture: A results-driven organization focused on job completion. People are competitive and goal-oriented. Leaders are demanding, hard-driving, and productive. The emphasis on winning is incented in the organization. Success means market share and penetration. Competitive pricing and market leadership are important.
Other: Our culture does not fit into these options
0% 5% 10% 15% 20% 25% 30% 35% 40% 36.5% 23.6% 17.3% 14.5% 8.2%
Leadership: The State of
Development Programs
2013
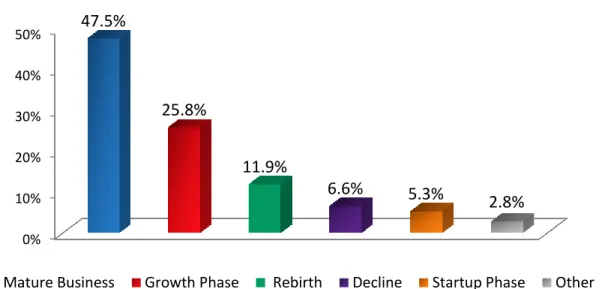
Figure 15: Which of the following best describes your organization's current business developmental phase?
Overall, more than 47% of the respondent population was comprised of mature businesses. Among mature businesses, 55% had formal Leadership Development strategies in place. Those organizations in the growth phase were much less likely to have a formal, established Leadership Development plan (36%), but 44% of them were in the process of developing one. 0% 10% 20% 30% 40% 50% 47.5% 25.8% 11.9% 6.6% 5.3% 2.8%
Leadership: The State of
Development Programs
2013
Leadership Development Questions
Spending and Organizational Performance
Figure 16: With regard to your organization's Leadership Development program, how is the budget allocated across the following groups?
Organizations without a formal strategy often have very little direction when it comes to allocating resources for Leadership Development. Overall, organizations seem to put much of the Leadership Development budget into the “other” category. However, among companies that have formal strategies, the “Other” category drops below 4%, and there is much more focus on groups such as executives (22%), direct managers (21%) and supervisors (19%). Part of the impact a formal strategy has that contributes to effectiveness is a more disciplined approach to spending. Without a strategy, an organization may simply be throwing money at various groups, initiatives and unknowns, hoping for success. Individual contributors see a significant chunk (20.1%) of the budget from all organizations, indicating that most companies take a somewhat holistic view of Leadership Development.
0% 5% 10% 15% 20% 25% 30% 35% 22.6% 21.9% 20.1% 19.6% 17.0% 16.2% 12.7% 10.9% 30.8%
Leadership: The State of
Development Programs
2013
Figure 17: Please estimate how full-time employee resources for Leadership Development are allocated.
There is a wide range of need for resources when it comes to Leadership Development. As far as people, or full-time equivalents, they are generally evenly spread across many roles, with fewer needed as coaches and mentors, as these are specialized positions. Those organizations with poor-performing programs focus 35% of their resources to instruction and 30% to administration. Those with high-performing programs spend less on instruction (20%) and administration (21%), focusing more on organizational development (27%).
0% 5% 10% 15% 20% 25% 30% 28.5% 25.6% 22.9% 21.1% 15.5% 14.2% 23.7%
Leadership: The State of
Development Programs
2013
Figure 18: Has your company’s revenue gone up or down in last fiscal year?
Most companies saw their revenue increase at least somewhat over the last fiscal year. However, among those with highly effective Leadership Development programs, 76% saw increases while only 55% of those with ineffective programs saw revenues go up. It’s a similar story when it comes to the existence of a formal Leadership Development strategy.
0% 5% 10% 15% 20% 25% 30% 35% 40% Up by 10% or more Up by 1% -9% Remained the same Down by 1% - 9% Down by 10% or more 23.8% 39.9% 19.3% 9.4% 7.6%
Leadership: The State of
Development Programs
2013
Figure 19: Which of the following most closely describes your organization’s current performance status? 0% 10% 20% 30% 40% 50% 60% 54.5% 27.9% 9.5% 1.4% 6.8%
Most of our key performance indicators or priority performance measures are moving in a positive direction.
Only half of our key performance indicators or priority performance measures are moving in a positive direction.
Less than half of our organization's key performance indicators or priority performance measures are moving in a positive direction. None of our key performance indicators are moving in a positive direction.
Leadership: The State of
Development Programs
2013
Figure 20: Have your employee engagement metrics gone up or down in the last year? (employee turnover, absenteeism, productivity, employee satisfaction, etc.)
0% 10% 20% 30% 40% 33.0% 25.0% 14.3% 13.8% 13.8%
They have stayed the same They have gone up
We don’t track employee engagement They have gone down
Leadership: The State of
Development Programs
2013
LD Program Structure and Participation
Figure 21: To what extent are the following considered drivers for the existence of your organization's Leadership Development program?
About 60% of respondents said leadership development is considered part of the overall culture, and to a high or very high extent that is why they pursue it. Additionally, 57% of respondents said the desire to fill leadership positions internally is a driver for leadership development to a high or very high extent.
Organizations with a collaborative culture were the most likely to say that hiring internal leadership candidates was a strong driver. Controlling cultures were the most likely to see a lack of external candidates as a driver to either a high or very high extent (nearly 40%).
0% 10% 20% 30% 40% Not at all
Small extent Moderate extent High extent Very high extent
7.0% 8.2% 27.9% 38.1% 18.9% 24.3% 35.6% 25.9% 11.7% 2.5% 5.8% 10.7% 23.1% 32.6% 27.7%
It's part of the organization's development culture
A lack of strong external candidates
The desire to fill leadership positions internally
Leadership: The State of
Development Programs
2013
Figure 22: Which employees are eligible for your Leadership Development program?
For the most part, leadership development programs are aimed at the manager level and above, while a quarter of organizations say they tailor them for high-potential employees. Almost the same percentage said that all employees are eligible for leadership development. Among organizations with a creative culture, however, 42% said they make Leadership Development available to all employees; while among collaborative and controlling cultures that number is about 17%.
Figure 23: Does your organization formally identify high potential employees?
About 57% of respondents said their organizations had a formal process for identifying high potential employees, yet only 24% of respondents work for organizations that aim leadership
0% 5% 10% 15% 20% 25% 30% 35% 40% 38.4% 24.0% 23.1% 12.0% 2.5% 56.9% 36.2% 6.9% Yes No Don’t know
Leadership: The State of
Development Programs
2013
development at hi-potentials. There is also a strong correlation between organizations that have formal Leadership Development plans and those that identify high potentials. Three-quarters of those with formal Leadership Development strategies have also formalized their high potential process, according to the survey.
Figure 24: Does your LD program include any of the following elements?
In-person classroom instruction remains the main tool in the leadership development tool kit. Less than half of companies said they employed virtual classroom settings for leadership development. However, about 67% said they provided experiential and on-the-job training, and among this group, 35% reported that their program was either very or extremely effective – better than the 24% for the overall group.
0% 10% 20% 30% 40% 50% 60% 70% 80% 79.9% 72.1% 67.1% 64.4% 59.8% 57.1% 44.3%
Leadership: The State of
Development Programs
2013
Figure 25: Which types of experiential/on-the-job training is part of your leadership development program?
More than two-thirds of respondents said their organizations offered some kind of on-the-job or experiential training to their Leadership Development participants, the most common of which is involvement with cross-functional teams. Exposing potential leaders to different aspects of the business is critical to their development, and this is accomplished through both direct exposure and cross-functional teams.
The mentoring/coaching model is evident in the popularity of spending time with senior managers. While an important aspect of leadership for many organizations, profit-and-loss accountability (with real-world consequences) is not often used in development. While the concepts and practices may be taught, only a quarter of respondents reported giving their up-and-coming leaders actual responsibility. International exposure can also be a great Leadership Development tool, and among those respondents who said their organizations operated on a global scale, more than 40% reported assigning Leadership Development participants to different geographies. That training typically involves cross-functional teams (72% of respondents), time with senior managers (66%), and more managerial responsibilities (64%). 0% 20% 40% 60% 80% 72.0% 65.7% 63.8% 58.5% 26.1% 23.7%
Involvement with cross-functional teams Time with senior managers
Increased management responsibilities Exposure to different business functions Profit and loss accountability
Leadership: The State of
Development Programs
2013
Leadership Development Effectiveness
Figure 26: What percentage of your organization’s leadership has gone through the Leadership Development program in the last 12 months?
Relatively few current leaders have recently been through a Leadership Development program. Only 14% of respondents said that more than half of their leaders had been in a program within the last 12 months. Some of this may be explained by the length of time Leadership Development programs have been around – 51% of programs are 2 years old or less. 0% 5% 10% 15% 20% 25% 30% 35% 40% 0% 1-10% 11%-25% 26%-50% 51%-75% 76%-100% 11.8% 36.2% 25.3% 12.2% 8.3% 6.1%
Leadership: The State of
Development Programs
2013
Figure 27: How effective do you find each of the following tools for assessing candidates for leadership development purposes?
0=Do not use 1=Not at all effective 2=Slightly effective 3=Moderately effective 4=Very effective 5=Extremely effective
Answer Options 0 1 2 3 4 5
16 Personality Factor Career
Development Profile 68.5% 1.9% 8.9% 12.2% 5.2% 3.3% 360 Assessments (internally
constructed) 36.5% 2.3% 9.0% 19.8% 25.2% 7.2% ASSESS 81.6% 1.9% 2.4% 10.1% 2.9% 1.0% ASSESS 360 80.8% 1.9% 1.9% 7.7% 6.7% 1.0% Bar-On EQ-i Leadership Development
Report 84.1% 2.9% 3.4% 6.7% 1.4% 1.4% Bar-On Emotional Quotient Inventory
(Bar-On EQ-i) 85.6% 2.9% 3.4% 6.3% 0.5% 1.4% California Psychological Inventory (CPI)
260 88.4% 2.9% 2.4% 4.3% 1.4% 0.5% Career Design Guide 80.7% 3.9% 3.4% 5.8% 5.3% 1.0% Development Dimensions International
(DDI) assessment centers 79.2% 3.4% 2.4% 10.1% 3.4% 1.4% DISC 50.7% 4.7% 12.2% 17.8% 11.7% 2.8% Emotional Competence Inventory (ECI) 82.9% 1.9% 4.3% 7.1% 1.9% 1.9% EQ Map 85.6% 1.4% 3.3% 6.2% 1.9% 1.4% FIRO-B Fundamental Interpersonal
Relations Orientation 81.5% 2.8% 4.3% 5.2% 5.7% 0.5% Hogan Personality Inventory (HPI) 75.5% 1.9% 5.2% 6.1% 7.1% 4.2% Inventory of Leadership Styles (ILS) 81.3% 1.9% 5.3% 6.7% 4.3% 0.5% Leadership Practices Inventory (LPI) 80.3% 1.9% 5.3% 5.8% 6.3% 0.5% Lominger Assessment Instruments 74.4% 1.9% 4.7% 7.6% 7.1% 4.3% MAPP Assessment 83.3% 2.5% 4.9% 5.9% 2.0% 1.5% MBTI – Myers-Briggs Type Indicator 47.0% 5.0% 14.2% 14.6% 15.1% 4.1% PDI Assessment Solutions 78.5% 1.9% 4.8% 8.6% 4.8% 1.4% Profiles International 84.7% 1.9% 3.8% 7.7% 1.0% 1.0% Revised NEO Personality Inventory
(NEO PI-R) 90.7% 2.0% 3.4% 2.9% 0.5% 0.5% StrengthFinder 2.0 69.2% 3.3% 8.5% 9.0% 8.1% 1.9% SuccessFactors 75.4% 3.3% 3.8% 7.6% 7.6% 2.4% Thomas-Kilmann Conflict Management
Leadership: The State of
Development Programs
2013
The most commonly used assessments, after internal 360s, are DISC and Meyers Brigg. Beyond these, not many of the other commercially available assessments are being used to a large extent. As for effectiveness, more than half of the organizations using internal 360s find them to be either very or extremely effective. Other assessments that score high on effectiveness among the organizations that use them are the Hogan Personality Inventory, Lominger Assessment Instruments, SuccessFactors and ASSESS 360. Interestingly, despite the popularity of the Myers-Briggs Type Indicator, only 36% of those that use it said it was either very or extremely effective. DISC did even worse, with only 29% giving it high marks.
Figure 28: Does your organization have a set of defined leadership competencies?
Leadership competencies often form the foundation of a leadership development program, and almost three quarters (72%) of respondents reported using them in one way or another. Among those respondents whose organizations reported a defined set of leadership competencies, whether they were different for different levels of leadership or the same, 31% said their programs were either very or extremely effective. Only 12% of those without defined competencies said the same.
Those respondents who said their organizations had a formal strategy were far more likely to use defined competencies, with 89% saying they used them.
Among respondents who did not report using defined competencies, 60% said their programs were either slightly effective or not effective at all. Only 12% of respondents reporting use of defined competencies said the same thing.
39.3%
32.3% 23.1%
5.2%
Yes, with different competencies for different leadership levels Yes, the same competencies apply to all levels of leadership No
Leadership: The State of
Development Programs
2013
Figure 29: Does your organization have a process in place to identify gaps in leadership?
Less than half of respondents indicated that their organization had a process to identify leadership gaps. Again, the presence of a formal LD strategy is a good indication that this type of process will be in place. About 56% of companies with formal Leadership Development strategies use a process to identify gaps, but only 35% of companies without strategies do this.
Those that do identify leadership gaps are also more likely to consider their Leadership Development plans more effective. This gap identification is typically part of a formal Leadership Development plan, and the statistics are similar for those companies with this type of plan in place.
Figure 30: Does your organization have a formal leadership succession plan?
46.1% 39.0% 14.9% Yes No Don’t know 42.6% 43.0% 14.3% Yes No Don’t know
Leadership: The State of
Development Programs
2013
Figure 31: What percentage of your organization’s leaders currently have development plans in place?
The lack of development plans for a large portion of leaders indicates that once someone is in a leadership position, the focus on development may stop or recede.
Among those companies with either very or extremely effective programs, 51% said they had development plans for at least half of their leaders. Only 13% of those with poorly performing programs reported the same levels of leadership plan participation.
0% 5% 10% 15% 20% 25% 30% 0% 1-10% 11%-25% 26%-50% 51%-75% 76%-100% 8.8% 29.1% 18.9% 15.4% 12.3% 15.4%
Leadership: The State of
Development Programs
2013
Figure 32: What percentage of your organization's open leadership positions have been filled internally in the last 12 months?
With regard to filling leadership openings, a symptom of poorly performing programs is a lack of qualified internal leadership candidates. Despite a desire to “promote from within,” only 40.4% of organizations have managed to fill more than half of their open leadership positions internally over the past year. About 35% percent of those with highly effective programs said they filled more than 75% of their open positions internally, while only 5% of those with ineffective programs could say the same.
Even though most companies cite “promoting from within” as a strong driver for leadership development, 60% of organizations overall are leaving more than half of their open leadership positions either unfilled or filled externally. Companies in a mature business phase do a slightly better job, with half of them filling half or more of their leadership positions internally. Those companies in either a startup or growth phase have more difficulty, with only 30% filling that many leadership positions internally.
0% 5% 10% 15% 20% 25% 0% 1%-10% 11%-25% 26%-50% 51%-75% 76%-100% 8.1% 19.3% 16.6% 15.7% 21.1% 19.3%