IDENTIFICATION OF HIGH-LEVEL OBJECT MANIPULATION
OPERATIONS FROM MULTIMODAL INPUT
A. Barchunova
Research Institute for Cognition and Robotics Bielefeld University
Universit¨atsstr. 25 Bielefeld, Germany
email: [email protected]
M. Franzius∗
, M. Pardowitz+and H. Ritter>
∗Honda Research Institute, Offenbach /Main email: [email protected]
+Research Institute for Cognition and Robotics, Bielefeld University email: [email protected]
>
Neuroinformatics Group, Bielefeld University email: [email protected]
ABSTRACT
Object manipulation constitutes a large part of our daily hand movements. Recognition of such movements by a robot in an interactive scenario is an issue that is rapidly gaining attention. In this paper we present an approach to identification of a class of high-level manual object manip-ulations. Experiments have shown that the naive approach based on classification of low-level sensor data yields poor performance. In this paper we introduce a two-stage proce-dure that considerably improves the identification perfor-mance. In the first stage of the procedure we estimate an intermediate representation by applying a linear preproces-sor to the multimodal low-level senpreproces-sor data. This mapping calculates shape, orientation and weight estimators of the interaction object. In the second stage we generate a clas-sifier that is trained to identify high-level object manipula-tions given the intermediate representation based on shape, orientation and weight. The devices used in our procedure are: Immersion CyberGlove II enhanced with five tactile sensors on the fingertips (TouchGlove), nine tactile sen-sors to measure the change of the object’s weight and a VICON multicamera system for trajectory recording. We have achieved the following recognition rates for 3600 data samples representing a sequence of manual object manipu-lations: 100% correct labelling of “holding”, 97% of “pour-ing”, 81% of “squeezing” and 65% of “tilting”.
KEY WORDS
Signal Processing, Sensor Multimodality, Recognition of Interaction
1
Introduction
Motion analysis is a highly interdisciplinary topic cover-ing such areas as physics, lcover-inguistics, psychology or com-puter science. Recently there has been a rapid develop-ment of physio-psychological research in this area (see [1, 2, 3, 4, 5, 6]). Numerous publications deal with the topic of motor development of children and imitation learn-ing. B. Jung et al. have published a summary of the physio-psychological concepts and a comprehensive re-view of their implementation for character animation [7].
Significant amount of motion analysis in computer science has been dedicated to its visual aspect. Extensive reviews of this topic can be found in [8, 9]. A considerable num-ber of publications have been dedicated to the generation of different kinds of motion and the Programming by Demon-stration technique (e.g. [10, 11, 12, 13]).
Our work focuses on identification of manual object manipulations based on multimodal data. The physiologi-cal side of a simple manipulation as “holding” an object in a constant position or “pushing” an object involves a com-plicated control process of muscles, joints and skin sen-sations of the palm. Regardless of this, the identification of an object manipulation in an interactive scenario can hardly involve access to such data. Our approach reflects these considerations and is motivated by experimental re-sults showing a poor performance of classification based directly on the low-level sensor data. The two-stage pro-cedure proposed in this paper introduces an intermediate representation level and considerably improves the identi-fication performance of the naive approach.
The multimodal nature of the recorded low-level data is essential for our recognition approach, providing for dis-criminative information necessary for a reliable identifica-tion of a manual operaidentifica-tion. We use the following devices to capture manual object manipulation data: Immersion Cy-berGlove II (CyCy-berGlove) enhanced with five tactile sen-sors on the fingertips (TouchGlove), nine tactile sensen-sors to measure the change of the object’s weight and a VICON multicamera system to record the object and hand trajec-tories. The recorded low-level channel and multi-modal data consists therefore of joint-trajectories (22 chan-nels), tactile-trajectories (5 chanchan-nels), weight-trajectories (9 channels) as well as(x, y, z)-position of the fingertips and of the three markers on the top of the object. Section 2.1 describes the experimental setup in detail.
Orientation, shape and weight of the interaction
ob-ject represent the features for the intermediate level in our approach. In correspondence to this we consider the following high-level operation descriptions: “tilting”, “squeezing” and “pouring”. “Tilting” describes a change of the angle between thez-axis and the object’s axis while the shape and the weight stay approximately constant.
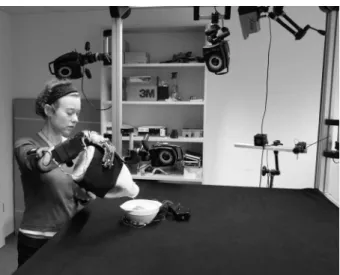
Figure 1. 14-camera VICON setup: the cameras are situ-ated on both sides of the transparent glass table.
“Squeezing” involves just the change of shape. We de-fine “pouring” as an object manipulation during which the weight changes, while the shape and the orientation stay approximately constant. “Holding” is another examined high-level operation description containing no dynamics of either of the three parameters. The fifth object manipula-tion that we consider is the simultaneous tilting, squeezing and pouring. We will describe the captured data in the Sec-tion 2.2.
The proposed procedure consists of two stages. In the first stage we apply a linear preprocessor to the multimodal low-level sensor data to obtain the intermediate represen-tation estimators. The intermediate level is specified by the following parameters: angle between the vertical axis and the object’s axis, weight of the object and four values specifying the shape of the object in the grasped position. In the second stage the procedure works solely with these parameters from the intermediate level. A classifier gener-ated with the unsupervised method ofk-means is trained to assign the intermediate representation to a corresponding high-level object manipulation description. In the Section 3.1 we describe the estimation of the linear mapping used in the first stage of the procedure. In the Sections 3.2 we de-scribe the preprocessing of the training- and test-data and the generation of the classifier with thek-means method. Section 4 presents our experimental results.
2
Experimental Setup and Captured Data
For our experiments we have used a VICON multicam-era system and three bluetooth devices for recording of the joint-angles, tactile and weight values. Section 2.1 presents a detailed description of this setup. We document the recorded data in Section 2.2.Figure 2. Test object: a large flexible plastic bottle with three VICON markers attached to its neck; 3D positions of the three tracked markers are used for calculating the bottle’s orientation.
Figure 3. CyberGlove with 11 VICON markers; five mark-ers are situated on the fingertips, five markmark-ers on the knuck-les and one marker on the back of the hand.
Figure 4. CyberGlove with the integrated TouchGlove: five FSR sensors are fitted on the fingertips.
Figure 5. VICON software application Nexus: camera placement (top); the model of the markers (bottom).
2.1 Hardware and Software
The hardware used for action capture consists of three syn-chronously recorded modalities. The first component is provided by a VICON multicamera system consisting of 14 high-resolution, 200 Hz infrared cameras [14]. Figure 1 shows the positioning of the cameras above and below a glass table. This system is used to acquire trajecto-ries of the special retro-reflective markers attached to the test object (see Figure 2) and to the CyberGlove (see Fig-ure 3). Two major postprocessing steps follow the captFig-ure of data with the VICON system. It is firstly necessary to create a model of the recorded markers and fit it into the recorded data. Secondly, the gaps in the captured trajec-tory data need to be filled either by B-spline interpolation or by a selected pattern. The VICON software then outputs the 3D positions of the specified markers (see Figure 5).
The second modality is provided by the Immersion CyberGlove II [15]. This device records joint-angle dy-namics of the hand and wrist. It outputs a 22-dimensional time-series, containing abduction between the fingers, flex-ion of each finger joint, two bending values of the palm and one bending value for the wrist (Figure 3). For our experiments we have enhanced the CyberGlove by placing a FSR-174AS CP42 sensor on each fingertip (see Figure
Figure 6. 9-FSR sensor scales for tracking of the object’s weight, i.e. as the gravel gets “poured” out.
Figure 7. Different liquid substitutes: small plastic marbles and gravel.
4). These capture the force applied by the fingers to the interaction object during action execution. We will refer to these five fingertip sensors as the “TouchGlove”. The dependency between the weight and the sensor output is approximately quadratic. We use this fact for linearization of the recorded tactile values.
Our test object is a flexible plastic bottle filled with gravel (Figure 2). Filling the bottle with a fluid would very likely generate less noisy weight trajectories, but for the sake of equipment protection we have decided to use a sub-stitute. Small corned gravel turned out to be an adequate fluid substitute in our pouring experiments. During an ac-tion capture it would not jump out of the bowl, unlike the small plastic marbles (see Figure 7) that were first used in the tests. Three retro-reflective markers were placed on top of the test object for VICON tracking. This gives us a possibility of approximately calculating the ground-truth about the degree of tilting of the test object. In addition to
Shape Orientation Weight Action Description 0 0 0 holding (#1) 1 0 0 squeezing (#2) 0 1 0 tilting (#3) 0 0 1 pouring (#4) 1 1 1 #2+#3+#4 (#5)
Table 1. Combination of the three intermediate parame-ter dynamics form different movement descriptions on the high level; “0” stands for constant parameter values, “1” stands for changing parameter values.
the markers on the test object directly, further five markers on the CyberGlove are used to deliver information about the object’s shape change. These markers are attached to the “nail-side” of the fingertips on the CyberGlove (Figure 3). We use the 3D positions of these markers to track the change of the test object’s shape in the place where the test object is being grasped. The remaining six markers that can be seen in the Figure 3 help us in the data postprocessing step.
The last part of the setup are the provisional “scales” (Figure 6) consisting of nine FSR-174AS CP42 sensors. Note that besides our manipulation object a bowl situated on the scales is also a part of the setup. During the exper-iments involving weight change we always fill the content of the plastic bottle into the bowl and measure its weight with the help of the scales. This allows us to keep track of the changes in the test object’s weight during manipula-tion. TouchGlove, CyberGlove and the scales are wireless devices that communicate via bluetooth.
2.2 Captured Data
For our experiments we record data sequences composed of the following five object manipulations: holding, squeez-ing, tiltsqueez-ing, pouring and a simultaneous execution of the last three. These five operations can be displayed in a schematic form (see Table 1). With a help of synchronisation software we obtain the following sensor data for a given timestamp: 1. the tactile sensor output of the scales (r1, . . . , r9) ∈
R9(Figure 6)
2. 3D position of three VICON markers placed on the top of the test object (Figure 2)
3. 3D position of eleven VICON marker trajectories placed on the CyberGlove (Figure 3)
4. the sensor output of the CyberGlove (c1, . . . , c22) ∈ R22(Figure 3)
5. the tactile sensor output of the TouchGlove
(t1, . . . , t5)∈R5(Figure 4)
Figure 8. Action capture; while pouring we adjust the ori-entation of the test object; the content of the test object gradually fills the bowl placed on the scales; the shape of the test object changes as it looses its content due to its changing elasticity.
For the model estimation (see Section 3) we calculate the following ground truth values based on the data described in Items 1-3 in the list above:
• the weightw ∈ Rof the poured-out test object con-tent. Gravel lands in the plastic container that is placed on the bluetooth scales (see Figure 8). Its approximate weight is given by the sum of the linearized scale sen-sor values (see Item 1)
• the angle between the verticalz-axis and the test ob-ject’s axisz ∈R. We estimate the value ofzby cal-culating the cross-product of two vectors set together of the three VICON-marker positions on the top of the object (see Item 2)
• the shape of the object in the grasped position de-scribed here by four parameters(s1, . . . , s4)∈R4. To estimate the shape we consider pairwise the Euclidean distances between the thumb and the other four fin-gers. We obtain the necessary data from the 3D posi-tion informaposi-tion of the fingertip VICON markers (see Item 3)
We use the data described in the Items 4-5 directly. Note that within our modelling and classification approach we do not consider the temporal order or dynamics of any of these variables.
3
Modelling and Classification
Our approach contains two stages. The determination of the linear preprocessor used in the stage 1 for estimation of intermediate representation values given raw sensor-data
is described in Section 3.1. The generation of a classifier trained to identify high-level object operations given an in-termediate operation description in the stage 2 is described in Section 3.2.
3.1 Determining of the Mapping: Low-level to Inter-mediate Level
Our goal is to determine a linear mappingf with a good generalization performance that estimates shape, orienta-tion and weight of the object for a given vector of Touch-and CyberGlove sensor values. The aggregate number of Touch- and CyberGlove sensors isS = 27. The number of intermediate parameters defining shape, orientation and weight areP = 6. We are looking for a mapping:
f :RS →RP (1)
a7→b, (2)
where
a:= (t1, . . . , t5, c1, . . . , c22) (3) is a vector containing fingertip sensor and CyberGlove val-ues and
b:= (s1, . . . , s4, z, w) (4) is a vector containing the corresponding values of shape, orientation and weight of the object.
While the values in the vectoracorrespond directly to the Cyber- and TouchGlove outputs, the values in the vectorbhave to be calculated as described in the Section 2.2. For a given set of training samples containing Cyber-and TouchGlove sensor data Cyber-and the set of corresponding ground truth values forz,sandw, we can solve the “in-verse” task of mapping determination. We apply the least
squares method and determine the matrixX ∈RS×P that fits the equation AX = B best. Each row of the matrix
A ∈ RN×S contains a vector of sensor data as in Eq. 3.
N is the number of training samples used for the fitting of the hyperplane. Each row of the matrixB∈RN×P corre-sponds to the ground truth values for shape, orientation and weight of the object, respectively (see Eq. 4).
3.2 k-means Classifier: Intermediate Level to High-level
After the determination of the linear mapping from the low-level sensor data into the intermediate representation, we train a classifier that assigns the intermediate data to a cor-responding high-level object manipulation.
For classifier training we apply the unsupervised method ofk-means to a set of samples of the intermedi-ate representation. From the recorded object manipulation sequences we randomly choose segments of low-level data containing all high-level operations that we want to iden-tify. In our case we use a sequence containing holding, tilting, pouring and squeezing. Let us assume that the map-pingf described in the section above has been estimated
and we have obtained the matrix X. In order to gener-ate intermedigener-ate level training data we multiply the set of
S-dimensional vectors containing Cyber- and TouchGlove sensor data withXand obtain a set ofP-dimensional vec-tors containing shape, orientation and weight estimation ac-cording to our model:
Bc=AcX, (5)
whereAc ∈ RM×S is the matrix whose row-vectors con-tain tactile and joint-angle sensor values (as in Eq. 3) and
M is the number of training samples. We obtain the ma-trixBc ∈RM×P whose row-vectors (as in Eq. 4) contain intermediate level estimators for the low-level data.
Now we can apply the unsupervised method of
k-means to the row-vectors of Bc and obtain k P -dimensional clusters. k is set to the number of high-level object manipulations we want to identify. LetC := {c1, . . . , ck} be the resulting code book. For testing we choose a set of raw sensor data samples corresponding to a sequence of high-level object manipulations, we map the data withfand obtain a set of corresponding weight, shape and orientation estimators:
Bt=AtX.
Each row ofAtandBtis of the form defined in the Eq. 3 and Eq. 4 respectively. We classify the row-vectors ofBt using the code bookCgenerated during classifier training. In the next section we will show that using the mapping
f and clustering intermediate level data considerably im-proves the identification of high-level object manipulation operations in comparison to using raw sensor data directly.
3.3 Overview
To sum up, the following steps are necessary
• to determine the linear preprocessorf: select training data, determine matrices A andB, apply the
least-squares method
• to train the intermediate level classifier: select a set of raw sensor data samples containing a sequence of object operations, map it withf, applyk-means to the
estimated intermediate data
• to identify object manipulation operations within a se-quence: map the corresponding sample set withf, use the estimated values and the generated classifier to as-sign each individual sample to a corresponding high-level object manipulation class.
4
Experimental Results
We will briefly describe the data used for the estimation of the linear mapping and the training of the classifier first, followed by the section on test results.
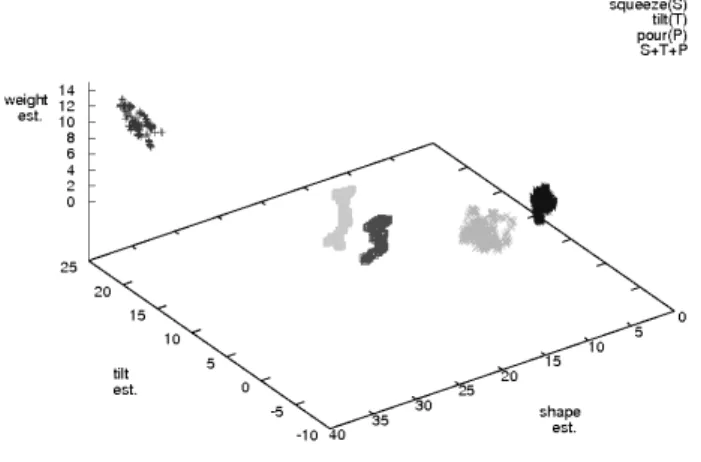
Figure 9. An example of the scatter-plots formed by the in-termediate level data corresponding to holding(H), squeez-ing(S), tilting(T), pouring(P) and the simultaneous execu-tion of the last three: S+T+P.
The data pool for the mapping estimation contains samples of only one particular object manipulation opera-tion during which shape, weight and orientaopera-tion are chang-ing simultaneously (see Table 1, row #5). The samples are ordered randomly. Figure 8 shows the data capture and the experimental environment: the bowl placed on the scales tracking the weight of the “poured-out” test object content, the Cyber- and the TouchGloves outputting the joint-angles and the tactile fingertip values, VICON cam-eras tracking the markers on the glove and on the test ob-ject. We have usedN = 4500 samples to estimate the mappingf withaj := (t1,j, . . . , t5,j, c1,j, . . . , c22,j)and
bj := (s1,j, . . . , s4,j, zj, wj)forj ∈ {1, . . . , N}. A vec-torajcontains sensor data of the Cyber- and TouchGlove. A vectorbj contains the ground truth values for the shape, orientation and weight of the object that we can calculate out of the captured VICON trajectory and the scales output. The mapping is determined as described in the Section 3.1
We train the classifier on the estimated intermediate data as described in the Section 3.2. In the Figure 9 you can see a 2D projection of 3D scatter-plots of whitened in-termediate level example data corresponding to all five ob-ject manipulation operations considered in this paper. x-,
y-, andz-axis show the tilt, one component of the shape descriptions1and the weight estimators accordingly. Each point cloud in the plot corresponds to one of the five oper-ations. The intermediate level data in this example is well separated. For training of the classifier we have used a cu-mulative of 13000 samples representing four actions: hold-ing, squeezhold-ing, tilting and pouring. Before applying the
k-means, we map the data to obtain the shape, orientation and weight estimators. Two simple preprocessing steps are needed before we can run thek-means: randomized
per-mutation and whitening.k-means outputs a code book that is used for the classification of the intermediate test data. For the implementation of least-squares method as well as thek-means method we have used the NumPy and SciPy [16] open source Python libraries.
4.1 Test Results
We have tested identification of four operations: holding, squeezing, tilting and pouring. We have used 900 test sam-ples per operation containing disjoint trajectory segments. The data sets contained inAcandAtare also disjoint. We preprocessed the data by whitening.
Our experiments have shown that using intermediate estimators in the classification considerably improves the classification results in comparison with using raw data. When in training and testing we were using just the raw data, the classifier failed to discriminate between
squeez-ing and poursqueez-ing. Over 12 trials of our procedure we have achieved an average of 100% correct classification for
holding, 97 % for pouring, 81 % for squeezing and 65 %
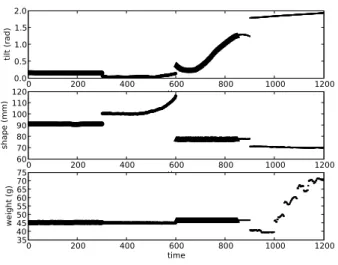
correct labelling for tilting. The comparatively low recog-nition statistics on tilting can be explained by the missing arm tracking. A high degree of tilting cannot physically be created solely by the movement of a hand with the ob-ject. One helps to tilt the test object with the arm, so during this period of time the hand sensors do not contain the rel-evant information. This also explains the fact that 85% of the wrongly classified tilting data strongly correlates with a high degree of tilting and gets labels as pouring. We are planning to include information about the arm movements in the intermediate description in the future. Figure 10 shows an example of classification of sequence data. The sequence contains holding, squeezing, tilting and pouring action. Here different line styles depict the assigned high-level operation labels. The segment of the data with the highest degree of tilting is assigned the pouring label.
5
Conclusions
We have developed a two-stage approach to identification of high-level sequential manual object manipulations. In the first stage we apply a linear preprocessorfto low-level data and obtain estimators for the intermediate representa-tion. The intermediate level is described by three parame-ters: shape, weight and orientation of the interaction object. Based on the intermediate estimators we train a classifier to assign data samples in intermediate representation to a class of high-level manual object manipulation operation. Our experiments have shown that the usage of the tested in-termediate representation considerably improves the iden-tification results.
We have shown that it is possible to estimate the linear preprocessor from the data of one object manipulation con-taining simultaneous tilting, squeezing and pouring. Ap-plying this mapping to simpler movements as tilting,
pour-0 200 400 600 800 1000 1200 time 0.0 0.5 1.0 1.5 2.0 tilt (rad) 0 200 400 600 800 1000 1200 time 60 70 80 90 100 110 120 shape (mm) 0 200 400 600 800 1000 1200 time 35 40 45 50 55 60 65 70 75 weight (g)
Figure 10. 300 samples represent each of the four test ob-ject manipulations in a sequence: holding, squeezing, tilt-ing and pourtilt-ing.
ing, holding and squeezing results in well separable clus-ters and good recognition results. In our procedure the clas-sifier training doesn’t require labelling or presegmentation of the training data. The procedure can be used as a basis for sequence-segmenting and it is robust in classifying data containing gaps. In the future we plan to extend our proce-dure and tests to more complex manual object manipulation operations.
6
Acknowledgements
Alexandra Barchunova gratefully acknowledges the finan-cial support from Honda Research Institute Europe for the project “Multimodal Recognition of Manual Interaction”. We thank Jonathan Maycock for his great support with data recording. We are very thankful to Florian Schmidt, Jan Moringen and Slobodan Vukanovic for discussions and proofreading.
References
[1] J. C. Martinez-Trujillo, D. Cheyne, W. Gaetz, E. Simine, and J. K. Tsotsos. Activation of area mt/v5 and the right inferior parietal cortex during the dis-crimination of transient direction changes in transla-tional motion. Cerebral Cortex, (17), 2007.
[2] J. W. Kable, I.P. Kan, A. Wilson, S.L. Thompson-schill, and A. Chatterjee. Conceptual representations of action in the lateral temporal cortex. J. Cognitive
Neuroscience, 17(12), 2005.
[3] G. Rizzolatti, L. Fogassi, and V. Gallese. Neurophys-iological mechanisms underlying the understanding and imitation of action. Nat Rev Neurosci, 2(9), 2001. [4] A.M. Wing. Motor control: Mechanisms of motor equivalence in handwriting. Current biology : CB, 10(6), 2000.
[5] P. Peigneux, E. Salmon, M. van der Linden, G. Gar-raux, J. Aerts, G. Delfiore, C. Degueldre, A. Luxen, G. Orban, and G. Franck. The role of lateral occipi-totemporal junction and area mt/v5 in the visual anal-ysis of upper-limb postures. Neuroimage, (11), 2000. [6] A.N.Meltzoff. The human infant as imitative gener-alist: A 20-year progress report on infant imitation with implications for comparative psychology. Social
Learning in Animals: The Roots of Cultiure, 1996.
[7] B. Jung, H. B. Amor, G. Heumer, and M. Weber. From motion capture to action capture: a review of imitation learning techniques and their application to vr-based character animation. In VRST ’06:
Proceed-ings of the ACM symposium on Virtual reality soft-ware and technology, 2006.
[8] L. Wang, W. Hu, and T. Tan. Recent developments in human motion analysis. Pattern Recognition, 36, 2003.
[9] P. Turaga, R. Chellappa, V. S. Subrahmanian, and O. Udrea. Machine recognition of human activities: A survey. IEEE Transactions on In Circuits and
Sys-tems for Video Technology, 18, 2008.
[10] A. Billard, S. Calinon, R. Dillmann, and S. Schaal. Robot programming by demonstration. In B. Sicil-iano and O. Khatib, editors, Handbook of Robotics. Springer, 2008.
[11] S. Calinon. Robot Programming by Demonstration:
A Probabilistic Approach. EPFL/CRC Press, 2009.
[12] S. Calinon and A. Billard. Learning of gestures by imitation in a humanoid robot. In Imitation and
So-cial Learning in Robots, Humans and Animals: Be-havioural, Social and Communicative Dimensions,
pages 153–177. Cambridge University Press, K. Dautenhahn and C.L. Nehaniv edition, 2007.
[13] S. Calinon and A. Billard. What is the teacher’s role in robot programming by demonstration? - Toward benchmarks for improved learning. Interaction
Stud-ies. Special Issue on Psychological Benchmarks in Human-Robot Interaction, 8(3):441–464, 2007.
[14] Vicon systems (http://www.vicon.com/).
[15] Immersion cyberglove II (http://de.manu-systems.com/cg2202.shtml).