HORIZONTAL PLATFORMS
Thesis by
Jonathan Akin French
In Partial Fulfillment of the Requirements For the Degree of
Doctor of Philosophy
California Institute of Technology Pasadena, California
1970
ACKNOWLEDGEMENTS
The writer wishes to express overdue thanks to his exacting but extremely helpful and patient thesis adviser, Professor Fredric
Raichlen. The advice and encouragement of Professors Vito A. Vanoni and Norman H. Brooks are also deeply appreciated.
The writer encountered and became interested in the problem of wave uplift while employed by Moffatt and Nichol, Consulting Engineers, Long Beach, California.
In his studies at the California Institute of Technology, the writer has received financial support from the Alfred P. Sloan
Foundation (1963-64), from the Title Insurance and Trust Company (1964-67), and from the California Institute of Technology. Financial support for the experimental research was received from the Sloan Fund for Basic Research and from the National Science Foundation (Grant No. GK-1729). The experiments were performed in the W. M. Keck Laboratory of Hydraulics and Water Resources, California Institute of Technology.
Assisting the writer in preparing the thesis were Messrs. Robert Bellue, Tom Bicknell, Jiin-jen Lee, James Perry, Dennis Pocekay, and Claude Vidal, who contributed many tedious but neces-sary hours of data reduction. Mr. Robert Logan contributed his skills at computer programming, and Mr. Yoshiaki Daimon unflinch-ingly devoted several megahours to mathematical and numerical computation, as well as to data reduction. Mrs. Peggy Paxson typed much of the copy in the early stages of writing.
Mrs. Patricia A. Rankin, Mrs. Catherine Musso, Mrs. Yvonne Vedder, and Mrs. Joyce Lundstedt.
The writer wishes to thank Mr. Elton F. Daly, who supervised the construction of nrnch of the laboratory equipment, for his in
-struction and advice in designing and building much of the experin1ental equipment; Mr. Robert L. Greenway, for his ready cooper ation and assistance in building the experimental apparatus; and Mr. Carl Eastvedt, for taking and developing the photographs and for reducing the drawings.
In addition, the writer wishes to express his thanks and appre -ciation to his parents, Mr. and Mrs. Howard B. French, for their assistance in preparing the drawings as well as for their comforting support during some of the whirlwind weeks of final preparation, and to Mr. and Mrs. Lee A. Tinder, for their neighborly assistance in preparing the final manuscript. The w riter also expresses loving
ABSTRACT
The m ajor objective of the study has been to investigate in detail the r apidly-varying peak uplift pressure and the slowly-varying posi-tive and negative uplift pressures that are known to be exerted by waves against the underside of a horizontal pier or platform located
above the still water level, but not higher than the crests of the incident waves.
In a 11two-dimensional 11
laboratory study conducted in a 100-ft long by 15-in. -wide by 2-ft-dcep wave tank with a horizontal smooth bottorn, individu·ally generated solitary waves struck a rigid, fixed, horizontal platform extending the width of the tank. Pres sure trans -ducer s were nwunted flush with the snJ.ooth soffit, or under side, of the platfornl.. The location of the transducers could be varied.
The problem of adequate dynanJ.ic and spatial response of the transducers was investigated in detail. It 'Nas found that unless the radius of the sensitive area of a pressure transducer is s1nallcr than about one-third of the characteristic width of the pressure distribu-tion, the peak pressure and the rise-time will not be recorded
accurately. A procedure was devised to correct peak pressures and rise-times for this transducer defect.
platfonn , its celerity increases to a in aximu1n, then decreases. The peak pressure similarly increases with distance from the seaward edge of the platforn1, then decreases.
1. 2. 3.
4.
CONTENTS INTRODUCTIONLITERATURE SUR VEY
2. 1 Theoretical Analysis of Uplift Forces on Platforms· with Zero Soffit Clearance
2. 2 Related Flow Phenomena
2. 2. 1 Pressur es on planing bodies 2. 2. 2 Forces on a vertical wall
2. 2. 3 Velocity of, and pressures related to, a propagating air cavity
2. 3 Experi1nental Studies of Wave Uplift Forces on Docks and Quay Aprons
2. 4 The Solitary Wave
2. 5 Solitary Wave Generators ANALYSIS
3. 1 General Considerations 3. 2 Application of the Analysis
3. 2. 1 Conditions at x
= 0
3. 2. 2 Flow conditions beneath the platform 3. 3 Discussion· of the Assumptions
EXPERIMENT AL EQUIPMENT AND PROCEDURE 4. 1 The Wave Tanks
4. 2 The Wave Generators 4. 3 The Platforms
4. 4 Apparatus and Techniques of Measuren1ent
CONTE.:NTS (Continued)
4. 5 Operating Procedure
Pa~ 113
5. DEFECT IN PEAK PRESSURE MEASUREMENT DUE
TO TRANSDUCER AREA 117
120 131 138 150 150
6.
5. 1 Mathematical Forinulation of the Problem 5. 2 Mathematical Solution of the Integral Equation 5. 3 Correction of Rise-Time and Peak Pressure RESULTS
6. 1 The Incident Wave
6. 2 Flow Beneath the Platform: Photographic
Description 174
6. 3 Pressure Recording Procedure; Qualitative Discussion of the Records
6. 4 The Advancing Wave Front and the Wave of Recession: Times of Arrival and Celerity
6.
5 The Slowly-Varying Pressure6. 5. 1 Statistical considerations
6. 5. 2 Pressure
6. 5. 3 Uplift force,- average pressure, and center ·of uplift pressure
6. 5. 4
Discussion of the analysis 6. 6 The Peak Pressure186
. ·199 226 227 227
261 278 286 6. 6. 1 Statistical considerations 286 6. 6. 2 Correction of peak pressure and rise-time 294
6. 6. 3 Functional behavior of peak pressure and
CONTENTS (Continued)
6. 6.
3 Functional behavior of peak pres sure andrise-time
7. CONCLUSIONS AND RECOMMENDATIONS FOR
FUTURE STUDY 7. 1 Conclusions
7. 2 Recommendations for Future Study
LIST OF REFERENCES APPENDIX A: NOTATION
APPENDIX B: TABLES OF DATA
APPENDIX C: DERIVATION OF UNDAMPED NATURAL FREQUENCY OF OSCILLATION OF 1/8-IN.
TRANSDUCER IN OIL CHAMBER
Page
323
350 350 360
363 372
377
LIST OF FIGURES
Nurn.ber Description
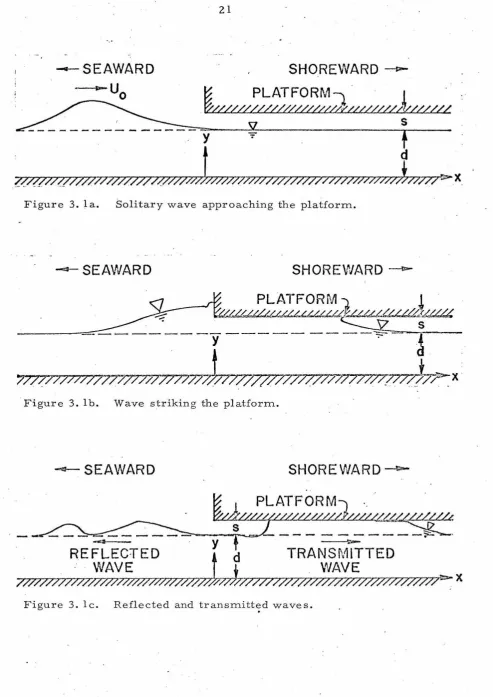
3. 1 (a) Solitary wave approaching the platform . 21
(b) Wave striking the platform. 21
(c) Reflected and transmitted waves. 21 3. 2 Generalized region of integration. 24 3. 3 (a) Observed form. of free surface with wave front. 35 (b) Observed fornJ. of free surface with wave of recession. 35 3. 4 Idealized flow at wave front with thin jet of spray. 47 3. 5 Chronology of wave impact on the platform. 54 4. 1
4. 2
4.3
4. 4 4. 5
4.
6
4. 7 4. 84
.
9
4. 10
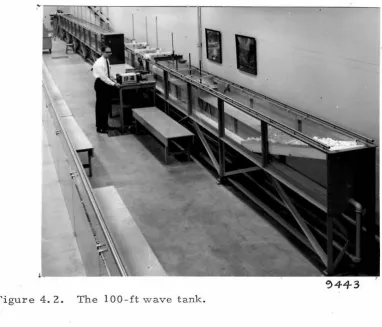
The 40-ft tilting flume modified as a wave tank. The 100-ft wave tank.
Drawing of the 100-ft wave tank.
A typical rnodule of the 100-ft wave tank. The wave generator for the 40-ft tank.
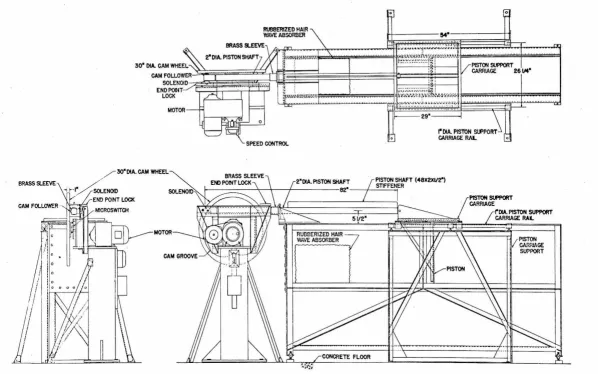
The wave generator for the 100-ft tank.
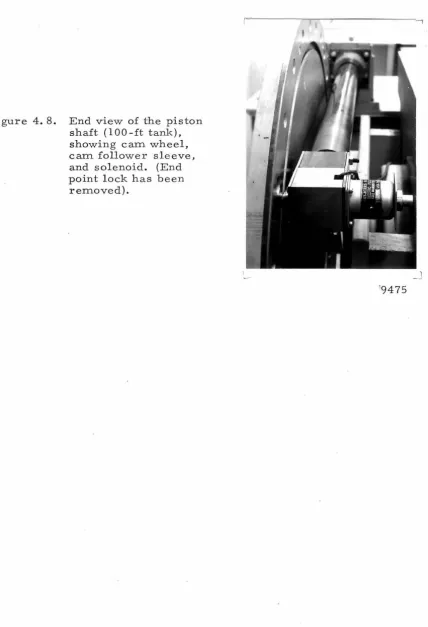
Drawing of the wave generator for the 100-ft tank. End view of the piston shaft (100-ft tank), showing
cam wheel, cam follower sleeve, and solenoid.
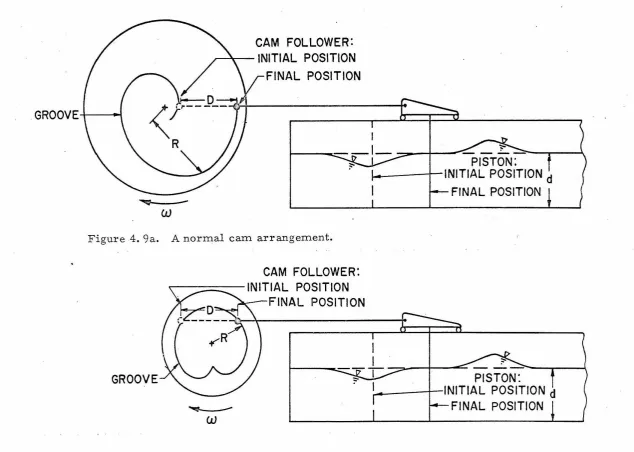
(a) A norn1al cam arrangernent. (b) A chordal cam arrangernent.
SchenJ.atic diagrams of position of the piston shaft and solenoid with respect to the can"l wheel and the end point lock.
LIST OF FIGURES (continued)
Number Description
(a) Beginning of stroke. (b) Midway through stroke. (c) End of stroke.
4. 11 Photographic sequence of cam operation: (a) Beginning of stroke.
(b) During stroke. (c) During stroke. {d) End of stroke.
4. 12 Solenoid circuit for the wave generator in the 100-ft tank.
4. 13 (a) The cam groove function r(8).
4. 14 4. 15 4. 16 4. 17 4. 18
4. 19
4.20
(b) Path of cam follower shown with respect to center
(a) (b)
of cam wheel.
Drawing of test platform (100-ft tank). A parallel-wire resistance wave gauge.
Typical calibration curves for the wave gauge. Schematic diagram of the wave gauge circuit. Diagram of the wave measurement system. A typical record for wave profile and celerity. Schematic diagram of the pressure measurement
system.
The 1/2-in. Statham transducer and the 1/8-in. Schaevitz-Bytrex transducer in adapter, with
outer diaphragm and oil removed.
Number
4. 21
LIST OF FIGURES (continued)
Description
The Kintel amplifier, two Dynan1ics amplifiers,
and the CEC recording oscillograph. 90 4. 22 (a) A cutaway view of the Statham 1 /2-in. transducer. 92
(b) A sectional view of the 1 /8-in. Schaevitz-Bytrex
transducer in its 1 /2-in. adapter. 92 4. 23 (a) Dam.peel free oscillations of the 1/2-in. Statham
4.24
4.25
transducer in air.
(b) Damped free oscillations of the 1 /8-in. Schaevitz-Bytrex transducer with oil cha1nbcr, in water. Dynam ic amplitude response as a function of input frequency, for each component of the pressure-measuring system.
Phase shift E: as a function of input frequency, for the pressure transducer and the recorder galvanometer.
4. 26 (a) Comparison of peak pres sure s recorded by
4.27
oscillograph and by oscilloscope to test o scillograph response.
(b) Comparison of rise-times recorded by oscillo-graph and by oscilloscope to test oscillograph response.
Schematic diagram of the pres sure calibration apparatus.
98
98
102
104
106
106
Nun1ber
4.28
4.29
4.30
LIST OF FIGURES (continued)
Description
Typical calibration curves for the two pressure transducers.
Plan view of the photographic set-up.
A typical multiple-image photograph ( 40-ft tank). 5. 1 (a) A travelling pressure distribution approaching a
transducer.
5. 2
5. 3
5.4
5
.
5
5. 6
(b) The recorded pressure· function.
(c) Increase in recorded rise-time due to finite
transducer etrea.
Diagrarn showing how a spatially-varying pres sure distrib,_ition is averaged over the sensitive trans-ducer area A.
Definition sketch of the limits of integration. Application of the Fourier transfonn correction procedure.
The def~ct ratio Ras a function of pressure distribution and transducer response.
The defect ratio R = R(b/a) and the associated functions I' and 11 used to determine R from
110 112 112 118 118 118
121 121
135
140
experimental data. 146
6
.
1 Profiles of a wave recorded simultaneously by four wave gauges n~ounted 45 ft to 75 ft fromNumber
6.2
6.3
6.4
6. 5
6.6
6.7
6.8
6.9
LIST OF FIGUH.ES (continued)
Description
Theoretical solitary wave profiles compared with an experimental wave profile. Generator
stroke length D = 1. 67 ft. 157 Theoretical solitary wave profiles co1npared
with an experimental wave profile. Generator
stroke length D = 1. 6 7 ft. 158 Theoretical solitary wave profiles and experi
-mental profiles by other workers compared with· an experirnental profile fron1. the present study.
Generator stroke length D = 1. 67 ft. 159 Profiles of gene rated waves, compared with
the Bous sine sq profile, for d = 1. 25 ft and D
=
1. 6 7 ft.P rofiles of generated waves, compared with the Boussinesq profile, ford= 1. 00 ft and d = 0. 75 ft, and D = 1 . 6 7 ft.
161
162
Profiles of generated waves, compared with the
Boussinesq profile, for d = 0. 50 ft and D = 1. 67 ft. 163 Profiles of generated waves, compared with the
Boussinesq profile, for d = 0. 64 ft and D = 0. 83 ft (half-stroke arrangement).
Celerity of the solitary wave.
Nurnber
6. 10
LIST OF FIGU HES (continued)
Description
Cornparison of normalized profiles of a wave
as measured at two stations 30 ft apart.
(a) d
=
1. 25 ft (b) d=
0. 5 0 ft6. 11 Decay of solitary wave height.
6. 12
6. 13
6. 14
6. 15
6. 16
6. 1 7
6. 18
6. 19
Cumulative frequency diagrams of H/H for eight
samples of 16 to 32 waves each.
Waves striking the platform.
d
= 0
. 64 ft, s/d = 0. 2, H/d = 0. 450. Waves striking the platform.d
=
0. 64 ft, s/d=
0. 2, H/d=
0. 250.Waves striking the platform.
d
=
0. 64 ft, s/d=
0. 2, H/d = 0. 203.Waves striking the platfornl..
d
=
0. 70 ft, s/d = 0. 1, H/d = 0. 436.Waves striking the platforrn.
d
=
0. 70 ft, s/d=
0. 1, H/d=
0.157.Waves striking the platform.
d = 0. 77 ft, s/d = 0. 0, H/d = 0. 426.
Waves striking the platform.
d
=
0. 7 7 ft, s I cl= 0
. 0' HI d=
0. 1 72.6. 20 (a) Typical pressure record for s/d = 0. 2 or 0. 1.
CEC oscillograph used.
LIST OF FIGURES (continued)
Number De scripti.on
6. 20 (b) Typical pressure record for s/d = 0. 0. 192 Sanborn recorder used.
6. 21 (a) Multiple-image photograph of wave first striking 196
6. 22 6.23
6.24
6.25
6.26
6.27
6. 28
6. 29
the platform.
(b) Pressure record frorn 1 /8-in. transducer mounted at x/d
=
0. 270, as shown inFigure 6. 2la.
Examples of recorded pressure peaks. Summary of quantities obtained fron1 each pressure record.
Norn1alized tirne of wave front arrival
td
,Jgld;
for s/d = 0. 2.Norrnalized tin1e of wave front arrival td
,.;gTd,
for s/d = 0. 1.Cu1nulative frequency diagra1ns for norinalized time of arrival td/ td of the wave front.
Nor~'.!alized wave front celerity U d/
fi<l for
s/d = 0. 2.Nonnalized wave front celerity U d/
Jgd
for s/d=
0. 1.Ratio of standard deviation to sample m ean, measured for (;d' esti1nated for U d'
196
198
200
202
202
205
207
209
Number
6. 30
6. 31
6.32
6.33
6.34
6.
35 >6.36
6.37
6.38
6.
39
6.40 6.41
6. 42
6.43
LIST OF FIGURES (continued)
Normalized time of arrival t
Jgfd
of thee wave of recession for s/d
=
0. 2.(a) experimental data; (b) predicted values. Normalized time of arrival t
,./fiJd
of thee wave of recession for s/d
=
0. 1.Cumulative frequency diagrams for normalized
216
220
time of arrival t
/ t
of the wave of recession. 221e e ·
Normalized celerity U /~of the wave of e
recession for s/d
=
0. 2.Cumulative frequency diagrams for normalized slowly--varying pressure P1 /yH.
Time-distance diagram for s/d = 0. 2, H/d = 0. 24.
Time-distance diagram for s/d = 0. 2, H/d = 0. 32. Time-distance diagram for s/d = 0. 2, H/d = 0. 40.
. Time-distance diagran1 for s/d = 0. 1, H/d = 0. 15. Time-distance diagram for s/d = 0. 1, H/d = 0. 31. Tin1e-distance diagram for s/d = 0.1, H/d = 0. 38. Pressure as a function of time for s/d = 0. 2, H/d = 0. 24.
Pressure as a function of tirn.e for s/d
=
0. 2, H/d=
0. 32.Pressure as a function of ti1ne for s/d = 0. 2, H/d = 0. 40.
Number 6.44 6.45 6.46. 6.47 6.48
6.49
6.50
6. 51
6. 52
6.
536.
546.
55LIST OF FIGURES (continued)
Description Page
Pressure as a function of time for s/d
=
0.I
,
H/d = 0. 15.
Pressure as a function of time for s/d
=
0. 1,H/d
=
0. 31.Pressure as'a function of time for s Id
=
0. 1,H/d
=
0. 38.Pressure as a function of time for s/d
=
0. 0,H/d
= 0.
42.Pressure as a function of distance for s/d
=
0. 2,H/d
= 0.
24.Pressure as a function of distance for s/d
= 0.
2,H/d
= 0.
32.Pressure as a hmction of distance for s/d - 0. 2,
H/d
=
0. 40.Comparison of normalized pressures obtained at
two model scales.
Normalized uplift force per unit width, for
s/d
=
0. 2, L/d=
4. 0.Maximmn norni.alized uplift force per unit width,
compared '.Vi th values by El Ghamry (19 63).
Nor·malized average uplift pressure, for
s/d = 0. 2, L/cl
=
4. 0.Normalized location of center of uplift pressure,
for s/d = 0. 2, L/d
=
4. 0.246 246 247 247 248 249 250 262 266 269
. 272
Number
6. 56
6. 57
6. 58
6. 59
6.60
6.61
6.62
6.63
6.64
LIST OF FIGURES (continued)
Description
Norn1alized location of center of maximum
uplift pressure, compared with values by
El Ghamry (1963).
Cuni.ulati ve frequency diagra·ms for norni.alized
peak pressure P2 /yH.
The ratio of standard deviation to mean in peak
pressure, plotted against x/d.
Cuni.ulative frequency diagra1ns for normalized
rise-time t ~
r
The ratio of standard deviation to 1nean in
rise-time, plotted against x/d.
Correlation of quantities measured in a set of
experiments made at x/d
=
0. 816, s/d :::0 0. 2,H/d = 0. 238, d = 1. 25 ft.
Uncorrected and corrected normalized peak
pressure P
2 /yd, plotted as a function of H/d
for several values of x/d.
Uncorrected and corrected normalized rise-time
Udtr/d, plott~d as a function of H/d for several
values of x/d.
The function 1' plotted as a function of
13,
usedin the correction of recorded peak pressure.
Nurnber 6.65 6.66 6.67 6.68 6.69
6
.
70
6. 71
6.72
LIST OF FIGURES (continued)
Description
The function I' plotted as a function of
13
,
usedin the correction of recorded peak pressure.
The empirically derived defect ratio R, a function
of b/a, corn.pared with mathematically derived
values.
Two exan1ple s of direct extrapolation:
(a) for peak pressure;
(b) for rise-time.
Normali7.ed peak pressure P
2
I
yH plotted asa function of x/d.
(a) Uncorrected mean v2lues;
(b) corrected values.
Norrnalized peak pres sure P 2
I
yd plotted as afunction of H/d, corn.pared with values by
El Ghamry (1963) and Wang (1967).
Normalized peak pressu1;e P
2 / yH plotted as
a function of x/d, compared with values by
El Ghamry (1963) and Wang (1967).
Normalized peak pres sure P 2
I
yH plotted asa function of s/d, compared with values by
El Ghamry (1963) and Wang (1967).
p
u
2The
ratio~
/(~
- s) plotted as a function ofy 2g
x/d.
Page
316
LIST OF FIGURES (continued)
Number Description
6. 73 (a) Uncorrected normalized rise-time; (b) corrected normalized rise-time;
(c) normalized rise length; plotted as functions of x/d.
6. 74 (a) Uncorrected measure of peak uplift impulse; (b) corrected measure of peak uplift impulse; (c) measure of uplift force per unit width at the
peak; plotted as functions of x/d.
6.75 Cumulative frequency diagrams for uplift
Photographs are catalogued in the W. M. Keck Laboratory
341 341 341
345 345
345
348
of Hydraulics and ·water Resources negative file, according to the number indicated at the lower right,-hand corners of the
Number
4. 1
5. 1
6
.
16. 2
LIST OF TABLES
Description
Dynamic characteristics of components in the pressure-measurement system.
Derivation of spatial response functions G(x). Summary of theoretical solitary wave profiles and celerities.
Tabulation of transducer locations.
100
126
155
CHAPTER 1 INTRODUCTION
In a storm, a maritime structure such as a pier or an offshore platform may be subject to significant uplift pressures when incident waves propagate beneath the platform and in contact with it. On a platform whose horizontal underside, or soffit, is situated above the still water level, studies by El Ghamry ( 1963) and by Wang ( 196 7) indicate that uplift pressures are characterized by an initial peak pres sure of .considerable magnitude but of short duration, followed by a slowly-varying uplift pressure of less magnitude but of considerable duration, and which typically is fir st positive, then negative.
The slowly-varying pressure may be of concern to an engineer considering the structural strength of the platform as a unit. The rapidly-varying peak pressure, shown in this study to be distributed over only a very narrow portion of the soffit at any given time, may be of concern when the strength of individual members of the structure is considered, such as the deck timbers in a wooden pier.
Previous studies, while demonstrating the existence of the peak pressure, provided no clear definition of the basic nature, magnitude, duration, or spatial extent of the peak pressure, nor of its functional dependence on such variables as incident wave height or platform geom-etry. The major aim of the present study has therefore been to investi-gate in basic detail the hydrodynamics associated with the uplift pres-sures on the platforrn, in particular the peak pres sure.
analysis of the hydrodynamics of uplift. Therefore the experimental
study was "two-dimensional," i.e. dependence on the transverse co-ordinate was eliminated. Tests were conducted in a relatively narrow wave tank with a rigid, fixed, model platform extending the full width of the tank. The platform had a smooth, horizontal under side, or soffit, and a smooth, vertical front face. Uplift pressures on the sof-fit were measured at numerous locations.
Previous studies had shown that the peak pressure was a quan-tity subject to considerable variance. Therefore it was required that the incident wave be as reproducible as possible, in order to reduce as much as possible the experimental variance in peak pres sure. Other requirements were that the incident wave be conveniently representable mathematically, and that it be a relevant model of ocean waves in shoal water in which piers or platforms are likely to be situated. Therefore, the incident wave form chosen was that of the solitary wave propagating into still water, for which there are several mathematical theories, and which may be considered a relevant model of an ocean wave propagating through shoal water. Solitary wave generators designed and construe-ted for this study were capable of a high degree of reproducibility of wave height.
In Chapter 2 previous studies of uplift forces on platforms and related phenomena are surveyed. In Chapter 3 an analysis is presented by which one may predict peak pressures, slowly-varying pressures,
I . .
and related phenomena. In Chapter 4 the experimental equipment and procedure are discussed, with pa:dicular attention given to the subject
in-vestigated in detail, with a procedure proposed for correcting peak pressure data. In Chapter 6 experimental results, including photo-graphs of the wave profile, are presented, compared with analytical predictions, and discussed. Conclusions and suggestions for future study are presented in Chapter 7.
CHAPTER 2
LITERATURE SUR VEY
2.1 Theoretical Analysis of Uplift Forces on Platforms with Zero
Soffit Clearance.
There is a considerable body of literature concerning water waves
propagating towards a rigid, plane shore having a slope
ur.
WhenO<trr<-rr /2, the problem is one of waves breaking on a beach; for URrr /2,
the waves can be considered to be striking a cliff, vertical or
over-hanging; When 1U=1T, there is What has been Called the 11
dOCk problem. II
This family of problems has been collectively treated for the
two-dimensional case by Friedrichs (1948), Friedrichs and Lewy (1948),
John (1948), and Isaacson (1948); the work has been summarized by
Stoker (1957). A paper from this collection by Friedrichs and Lewy (1948)
on the dock problem presents solutions for the flow (and hence the
pres-sure) beneath a flat_, horizontal, semi-infinite dock situated at still
water level, against which sinusoidal waves of small amplitude
propa-gate from x=+00 • As in all other cases in this family of problems, it
is shown that there are two standing wave solutions. One solution
pre-'
diets finite amplitude waves at the seaward edge of the dock (or the
shoreline, for the beach and cliff problems) and small co sinusoidal
waves at x=+00 ; the other, with logarithmic singularity at the dock edge
(or shoreline), predicts waves of infinite height there and small
sinu-soi<;lal waves at x=+oo. At x=+00 the solutions are out of phase by 90 0 ;
the problem is linear and homogeneous, so that the solutions may be
combined to represent waves progressing towards the dock (or the
progres-sive waves bearing energy shoreward are predictable without use of the singular solution.
Heins ( 1948) treated the problem of a dock of infinite width and semi-infinite length, where the water was of finite depth and the waves not necessar.ily normally incident on the dock. In this case, too, there is a regular solution, and a solution with a logarithmic singularity at the dock edge, obtained by differentiating the bounded solution. The
solutions are presented as infinite series, the terms of which must be computed to provide useful results.
Stoker (1957) discusses the problem of a rigid board of finite length and of infinite width freely floating or rigidly fixed on the water surface. The channel is of finite constant depth, and small sinusoidal waves approach the board normally. The shallow-water approximation
is applied, so that variations of flow quantities with depth are neglected. For the case of the rigidly fixed board, the flow beneath the board is uniformly horizontal and sinusoidally dependent on time. The
re-sultant pressure on the board at any given position is sinusoidally dependent on time, and at any given time is linearly dependent on dis-tance.
2. 2 Related Flow Phenomena.
The mathematical treatments discussed above all deal with a
mathe-matical treatments discussed in the previous section a free surface
beneath the platform was not considered, and high peak pressures
propagating beneath the platform were not predicted. To study the peak pressure, then, one may turn to analysis of other flows which in
some way resemble the flow beneath a platform, at least in the region
where peak pressures are generated.
2. 2. 1 Pressures on planing bodies.
In his studies on the planing of water craft, Wagner (1932, 1948)
described the ideal fluid flow near an infinitely wide flat plate planing
on the water surface at high Froude number. To an observer moving
with the plate, the steady flow appears to have a stagnation point on
the underside of the plate which approaches the front edge as the angle
ofinclinabon of the plate with respect to the still water surface
approaches zero. Forward of the stagnation point the flow shoots
for-ward as spray. If one is able to determine the velocity distribution
beneath the plate, the pres sure distribution follows from Bernoulli Is
equation, with the gravitational term negligible because of the high
Froude number. Qualitatively, the distribution has a sharp peak at
the stagnation point,_with the peak pressure simply equal to p
u
212,where U is the velocity of the flow at infinity, and p is the fluid
den-sity. The width of the pressure peak increases with the angle of
inclination of the plate with the still water surface. The pressure
distribution with its peak is , reminiscent of the distribution on a plat-. form with a wave beneath it, and suggests that the pressure peak
2. 2. 2 Forces on a vertical wall.
Occasionally when a water wave breaks against a vertical wall, it generates an intense pressure of short duration, which.has often
been called "shock pressure, 11
"impact pressure," or, in French,
11gifle. 11 Ther~ is always a slowly-varying pressure, or 11
bourrage, 11
upon which the impact pressure is superposed, if it occurs. There has been considerable study of this problem, in theory and in laboratory and prototype experiments (Bagnold, 1939; Minikin, 1950; Denny, 1951;
Ross, 1954; Rundgren, 1958; Nagai, 1960; Garcia, 1968). The problem
of waves breaking against walls is not directly related to that of wave uplift on platforms, but it is true that both problems deal with wave action on coastal structures, and that a prominent feature in both cases is the intense pressure peak.
The first recent work on the wall problem is by Bagnold (1939),
who in laboratory experiments observed that shock pressures occurred
only if the wave struck the wall at its precise moment of breaking. If
the wave never broke or if it broke before striking .the wall, there was no shock, but only the slowly-varying bourrage.
At breaking, the front surface of the wave was found to lie very nearly in a forward-moving vertical plane; it was when this near
-vertical front surface struck the solid wall that shock pressur es were
generated. It happened that the wave would also trap a thin cushion of
air against the wall.
Bagnold concluded that (1) the "shock pressures occur only when
the shape of the advancing wavefront is such as to enclose an air
peak pressure observed from wave to wave was due to variation in the air cushion thickness, in turn due to random irregularities on the water surface; (3) although the peak pressures varied greatly from wave to wave, the integral of the pressure-time curve tended to
approach and not exceed a definite value; (4) the pressure peaks and the maximum pressure -time areas were measured only in the part of the wall where the air-cushion was formed; (5) in the model experiments, peak pressure values never exceeded one-sixth of the theoretical
"water-hammer" value. The duration was at least ten times the dura-tion time predicted for "water-hammer"; thus the impact energy was apparently absorbed in compression of the air rather than of the water.
Denny ( 1951) made a statistical analysis of impact pressures and impulses. Whereas the pressures appeared to be randomly distri-buted, Denny, like Bagnold, observed that the impulses tended to approach but never exceed a definite maximum value. The ranges of values of impulse measured by Denny (1951), by Ross (1954), and by Garcia (1968) are compared with uplift impulse in Section 6. 6.
2. 2. 3 Velocity of, and pressures related to, a propagating air cavity. In a theoretical treatment of various aspects of gravity currents, Benjamin ( 1968) chose as a convenient fundamental formulation of gravity-current problems the case of a void or ai~-filled cavity propa-gating along the upper horizontal boundary of a liquid-filled region of finite depth. This case is approximated by that in which a solitary wave has struck a platform, and the liquid is in the process of receding from the platform. The expression obtained by Benjamin for the
platform. Benjamin's expression for the negative pres sure on the upper boundary is equivalent to Equation 3. 51 in Section 3. 2 for
neg-ative pressure related to the flow at the wave of recession.
2. 3 Experimental Studies of Wave Uplift Forces on Docks and Quay Aprons.
El Ghamry's work (1963) is to the writer's knowledge the first experimental uplift study. The main objectives were: 11(1)
to study the nature of forces acting on a horizontal deck under the action of break-ing and non-breakbreak-ing periodic waves and for certain geometric con-ditions, (2) to determine the feasibility of using the existing theories in predic~ing the magnitude of these forces, (3) to correlate these
forces with measurable wave parameters, (4) to study the instantaneous pressures at some points along the deck and (5) to provide information about the effect of some geometric parameters on the relationships between the induced forces and the wave characteristics. 11
(El Ghamry, 1963, p. 7).
The experiments were performed in a wave tank 3 ft deep, 1 ft wide and 100 ft long. The dock was 4 ft long and nearly as wide as the tank. For the 11non-breaking waves" case, the tank bottom was horizontal beneath the dock, and there was no beach. Ample space for air to escape from beneath the dock ahead of the advancing wave was provided between the dock edges and the tank walls. For all tests the mean water depth was 2. 00 ft. The soffit clearance was varied between 0 and O. 20 ft above the mean water level.
force-meter system built into the two supports from which the dock was sus -pended enabled total uplift force and moments to be measured.
For the "breaking waves11 case a rigid, smooth beach was
installed, the toe of which was offshore of the front of the dock. The dock extended back to meet the beach. For one series of runs ample space was again provided at the dock edges; for another series, the spaces between the dock edges and the walls and beach were caulked to trap the air.
For the case of no beach and non-breaking waves, the data from six consecutive waves were averaged for each test. In comparing his results with those of the Stoker analysis already described, El Ghamry found the force F(t) to be not a simple sine function but a complicated periodic function dependent on the wave period and the soffit clearance. Neither the maxin1um positive and negative pressures nor the durations of positive and negative pressures were equal, even for zero soffit clearance. He also determined the center of force for the positive and negative uplifts, finding them dependent on wave height and on the ratio of wave length to platform length.
With the passage of each wave, the pressure records showed a
high pulse of short duration, reminiscent of the impact pres sure ex-erted on vertical walls. A slowly-varying pressure of much less amplitude, sometimes positive and sometimes negative, followed the impulse, or peak pressure. There was much variation in the peak pressure even when there was little variation in generating conditions.
The peak pressure head rarely exceeded 2. 5 times the trough-to-crest waveheight.
El Ghamry concluded that such a dock can be an efficient breakwater if of sufficient length and at the proper soffit clearance. For the case of breaking waves, statistical analysis of six consecutive waves showed a Gaussian distribution of pressure maxima, whether the air was trapped or was allowed to escape. The mean peak pressure when air was
trapped was about twice as high as when air was not trapped, but in either case the standard deviation was about half the mean value. The maximum recorded pressure head was 17. S times the incident wave height. The maximum uplifts had approximately a Rayleigh distribu-tion. Wher.e there was complete air entrapment, the pressure and force records showed only a single impulsive shock for each wave, with little or rio slowly-varying part.
The pressure transducers were modified versions of the Statham Model 264 TC, with the sensitive diaphragms mounted flush with the dock soffit. According to the manufacturer, this model has a sensitive diaphragm 1 /2 inch in diameter.
El Ghamry made several suggestions for future studies. For the two-dimensional, or wide-dock, case he suggested further tests with a variety of dock lengths, different beach slopes between l: 10 and 1 :2,
and different shapes of bulkheads in different w ater depths. He also suggested that the instantaneous pressure distribution on the dock be measured, and that motion pictures be used to aid flow visualization.
incident irregular wind waves, and prototype pressure measurements. For purposes of comparison, El Ghamry' s uplift force and peak pres-sure data are presented in Sections 6. 5 and 6. 6.
Wang (1967), noting the presence of peak pressures and positive and negative uplift pressures as observed in El Ghamry and in his own experiments, derived simple theoretical values for peak pressures and slowly-varying pressures generated by standing waves, periodic pro-gressive waves, and dispersive wave trains.
To determine the peak pressure he adapted an approximate analy-sis for the transient force on an immersing wedge, derived by
von Karman (1929), in relating peak pressure to the celerity of the
wave front and to the vertical fluid element velocity in the wave near the wave front.
The slowly-varying pressure head he simply took as the pressure in the undeformed wave at elevation s; near the breaker zone, where vertical accelerations contribute to the pressure but never exceed the acceleration of gravity, g, the pressure head is therefore equal to one to two times the local water surface elevation, less the soffit clearance
(i. e., the elevation of the platform above still water level). These theories predict that the slowly-varying pressure depends strongly on the soffit clearance, whereas the peak pressure does so to a much lesser extent.
These theories for peak pressure and slowly-varying pressure are applied in the analysis of standing waves, periodic progressive waves and dispersive waves striking a narrow dock. (It may be noted that Wang's is the only study discussed here that has dealt with a
infinitely wide.) Wang was not able to compare his predicted pressures with experimental results for the standing-wave case, since he knew of no such data; for the periodic-progressive wave case he compared his theory for peak pressures with El Ghamry's data, and for the disper-sive wave case he compared his theory with his own data.
For peak pressures due to periodic waves, the agreement with the El Ghamry data was fairly good, considering the large variation inherent in peak pressure measurements. The slowly-varying pressure maxima due to dispersive waves showed a wide range of scatter, but for the most part fell within the predicted range.
The peak pressures associated with dispersive waves from his own experiments correlated poorly with analytical values. Evidently,
individual data were plotted; if Wang had been able to average pressures due to several identical waves, the correlation might well be better.
Wang made only cursory exam.ination of the details of the pres -sure pulse. For 15 waves, the pulse was recorded on an oscilloscope at a sweep speed of 10 m sec. /div. The traces are described as
"single- or dual-peaked, • • [existing) for a period of 6 to 16 msec. " With incident waveheights of about 0. 16 ft., Wang proposed the rang e-relationship
t = ( 15 to 40)
J1f ,
where t is the pulse duration in milliseconds and H is the waveheight in feet.
frequency of 250 kc. The signals from the CEC transducer were dis-played on an oscillograph, whereas the signal from the Susquehanna transducer, used to measure the high-frequency components, was dis-played on an oscilloscope. The sizes of the transducers were not
indicated.
· The CEC transducer output was susceptible to temperature shift, presenting a problem similar to that encountered by the writer (see Section 4. 4). Wang's solution was to build a shallow manifold on the upper side of the dock so that water pumped from the basin could be
circulated around the housing of each transducer. A small clearance between transducer and dock allowed the coolant to leak down to the transducer face as well. Before an experiment was begun, the water was circulated continuously around the pier for at least two hours to bring pier and instruments to the same temperature as the water in the basin. Despite this precaution there was still a small temperature shift in the record which was minimized by an appropriate data re-duction procedure.
Wang's peak-pressure data are compared with the writer's data in Section 6. 6.
Furudoi and Murata ( 1966) studied experimentally the total uplift force on a horizontal platform extending seaward from a vertical wall.
had a sloping beach. The average pressure h~ad on the platform was from 1 to 8 times the incident wave height.
An empirical formula derived from the laboratory data relating uplift force to incident wave height and soffit clearance was found to be in fair agreement with some hindcasted prototype data.
2. 4 The Solitary Wave.
LaITib (1945, p. 423) defines the solitary wave as 11
a wave con-sisting of a single elevation, of height not necessarily small compared with the depth of the fluid, which, if properly started, may travel for
a considerable distance along a uniform canal, with little or no change of type. 11 Stoker (1957, p. 342) adds the condition that the form be
symmetric.
The history of experimental and theoretical study of the solitary wave is given by Ippen and Kulin (1955) and by Laitone (1963), and so will be only briefly discussed here. Study of the solitary wave began in
1834 when J. Scott Russell (1844) observed a single intumescence prop-agating with constant form along a canal, generated when a volume of water impounded by a lock was suddenly released to the canal. Of the many theoretical studies of the solitary wave, three are m entioned here, and are compared with experimental results in Section 6. 1. The analysis of Boussinesq (1872) is the earliest known to the writer.
McCowan's analysis (1891) has been adapted by Munk (1948) and applied to the analysis of surf. Lai tone's study ( 1963) is one of the most
first approximation to the solitary wave is identical to the expression developed by Boussinesq (1872); the second approximation is that pre-sented in Table 6. 1.
Keulegan ( 1948) developed a theoretical expression for the de -crease of amplitude of a solitary wave due to energy dissipation in the boundary layer. In Section 6. 1, the expression is compared with experimental values of amplitude decay measured in a study by Ippen, Kulin, and Raza (1955), and in the present study.
Daily and Stephan (1952) studied the solitary wave experiment-ally, using a l
6t
in. wide channel with a horizontal smooth bottom, with undisturbed water depths between O. 2 and 0. 4 ft. They concludedthat the celerity relationship derived empirically by Russell (1844) and analytically by Boussinesq (1872), Rayleigh (1876), Korteweg and de Vries (1895 ), and others is adequate for practical applications, but that the theoretical celerity is somewhat greater than the observed celerity. They found the experimental profile to be closely approxi -mated by the formula of Boussinesq (1872). The data of Daily and Stephan for celerity and wave profile are presented in comparison with data from the present study in Section 6. 1.
Perroud (1957) measured profiles of waves in a uniform channel, finding them well represented by the profile derived by Boussinesq (1872). However, waves in a channel with converging side walls had
profiles that wer e relatively wider than the Boussinesq profile, and
no longer symmetric.
I pp en, Kulin, and Raz a ( 19 5 5), in their study of damping char ac -teristics of the solitary wave, found that the formula for amplitude
only for a ratio of wave height to still wafer depth of about O. 4. For
lesser values, the formula predicted lower rates of decay than
measured; for greater values, the formula predicted a greater rate
of decay than was measured. The data of Ippen, Kulin, and Raza
(1955), along with that of the present study, are compared with the
Keulegan formula in Section 6. 1.
In Chapter 1, a reason stated for the choice of the solitary wave
as the experimental incident wave was that the solitary wave is a
relevant model of an ocean wave in shoal water. Munk (1948) reasoned
that the solitary wave would be a suitable model for the theoretical
study of surf problems. He noted that whereas periodic waves in deep
water can be characterized by the. ratio of wavelength to water depth
and by wave steepness, waves in shallow water have narrow crests
separated by wide troughs, where, as with solitary waves, the
character of the isolated crests depends strongly on the ratio of wave
height to water depth, rather than on wave length.
Use of the solitary wave theory was further prompted by 11an
obvious resemblence between the theoretically derived wave profile
and the observed profile in the region just outside the breaker zone11
(Munk, 1948).
Munk applied the solitary wave theory, as developed by Mc Cowan
(1891), to the forecasting of breaker characteristics, wave refraction,
longshore currents, and rise in the sea surface caused by onshore
wave momentum. Laboratory and field observations, while showing
considerable scatter, gave 11
the overall impression . . • that the
solitary wave theory provides a useful tool for the study of various
surf phenornena11
2. 5 Solitary Wave Generators.
In the literature there are several different methods described
for generating solitary waves, but all designs may be classified as
being of either the "plunger type" or the "piston type. 11 11
Plunger
type 11 wave generation usually consists of a body of finite displacement
being driven down through the free water surface, then kept in an
im-mersed or partly-immersed position. "Piston type" generation
usually consists of a flat vertical plate being driven along the tank in a
single finite_ stroke, then kept in its advanced position. In either case,
a
finite volume of water is displaced at one end of the tank, and there results a solitary wave travelling away from the generator,trans-porting a volume of water equal to the volume originally displaced by
the generator.
The ideal wave generator would displace water in precisely the
same manner as a fully-developed solitary wave does as it propagates
along a channel. Several methods have been used to move the piston or
plunger in as ideal way as possible. Usually the best design efforts
fall short of perfection, however, in that the wave generated, while in
it~elf possessing most of the symmetry, form, and permanence
attri-buted to the ideal wave, is followed by a train of parasitic wavelets.
Often a cut-off gate is installed near the generator to r emove the
para-sitic wavelets: the gate is r aised to let the major wave pass, then
quickly lowered to cut off the following wavelet train.
Caldwell ( 1949) used plunger type genera tor consisting of a
rectangular floating body hinged along one side to the end wall of the
tank. The other side of the body could be pulled downward by a chain,
r-driven cam. was cut so that the rate of displacement of water by the body approximated the rate of horizontal displacement in a fully-formed solitary wave. A cut-off gate was used to remove the para-sitic wavelets. Romita (1954) evidently generated satisfactory solitary waves simply by pushing a piston by hand, and by using a cut-off gate.
Because of the human factor, one could obviously not expect a high degree of reproducibility. Hall and Watts (1953) used a piston driven by a falling weight, acting through a mechanical linkage. A fair degree of reproducibility was claimed. Perroud (1957) used a piston driven by an electrically released falling weight. The weight and stroke were adjustable. Reproducibility of wave height was within 4%.
A procedure followed by Daily and Stephan (1952), Ippen and Kulin (1955), and Ippen, Kulin, and Raza (1955) was to drive a piston by impounding a quantity of water in a reservoir behind it, then sud-denly releasing it to surge against the piston and drive it forward.
A more sophisticated device is an hydraulically driven piston controlled by an electric servosystem. Such a system provides for greater reproducibility than is available with manual or water-driven systems, yet there is no constraint on the form of the input displace -ment function, and the stroke amplitude may be varied. In the wind, water-wave research facility at Stanford University (Hsu, 1965), the electrohydraulic system is programmed to drive the piston as
CHAPTER 3
ANALYSIS
In Chapter 3 a first-order analysis is presented to predict and
-explain the transient hydrodynamics of a solitary wave striking a
horizontal platform. Simplifying assumptions and the conditions
neces-sary for valid application of each part of the analysis are set forth
here. In Chapter 6, where the analysis is compared with experimental
results, the validity of each simplifying assumption is examined.
The two-dimensional case studied consists of a fluid-filled
region above which is suspended a rigid platform. The plane y
=
0represents the rigid, horizontal bottom of the channel. The
fluid-filled region extends from x
= -
co to x=
+
ro and has a local depth d+
T\,where d is the still water depth and T\ is the local elevation above still
water level. The platform, whose flat horizontal soffit has a
clearance s above the still-water level, or d
+
s above the tank bottom,extends from x
=
0 at its seaward end to x=
+
ro. (The effect of theshoreward end of the platform is thus not to be considered.)
Initially, a solitary wave approaches from x = - ro (Figure 3. 1a).
If the wave has a height H greater than the soffit clearance s, the wave
will strike the platform at its seaward end, i.e. at x
=
0 (Figure 3. 1b).A transmitted wave disturbance then continues to propagate beneath
the platform in the
+
x direction, and a reflected wave train propagates--SEAWARD
SHOREViARD
-,-s---u
0l//J'~1;~~~luu////kJ///
[image:42.542.27.521.11.709.2]$
Figure 3. la. Solitary wave approaching the platform.
~SEAVJARD
SHOREVJARD
e-Figure 3. 1 b. Wave striking the platform.
_,__ SEAVvARD
3. 1. General Considerations
The analysis that follows may depend on one or more of the following assumptions:
1. The form of a free surface wave profile remains approximately constant, i.e. the propagation celerity is the same for all locations on the profile at a given instant, although the celerity may change with time.
A mathematical expression of this assumption is:
au
(t) _ax--
0,where U is the wave celerity.
2. The effects of surface tension, air entrainment, and viscous boundary shear stress are negligible. Vorticity is negligible, except in areas of concen -trated energy dissipation, such as an hydraulic jump.
3. The horizontal fluid velocity beneath the seaward edge of the platform, and the water surface elevation at the seaward edge, are approximately the same as for the case when there is no platform pre sent.
(3. 1)
The surface elevation may be expressed as T\
=
T\ (x-Ut), indi-eating that a water wave is propagating in the+
x direction with celerity U. The total time derivative is zero:It should be stated with reference to Equation 3. 2 (and to Equation 3. 18
which is to appear later) that the operation : t
=
:t
+ Uix
denotes thetime rate of change of a quantity measured at a position fixed with
respect to an observer moving with the wave at celerity U .
In the following analysis, the familiar hydrodynamic differential
equations are used. The equation of continuity is:
au+ av= 0;
ax
oy
the equation of motion in the x-direction is:
au+ u OU + v OU +~ oP
=
O·ot
axoy
pax
,
the equation of motion in the y-direction is:
ov
+
ov
ov
1 8P O·at
uax
+ voy
+p
oy
+ g= '
and the equation of vorticity is:
OU av
oy -
ax= o.
(3. 3)
(3. 4a)
(3. 4b)
(3. 5)
Equations 3. 4 and 3. 5 are subject to the assumption that the effects of viscosity, surface tension, and air entrainrnent are negligible. Equation 3. 5 violates this assumption in areas of concentrated energy dissipation,
When Equation 3. 5 is substituted into Equations 3. 4, the latter
may be integrated to give the familiar Bernoulli equation:
2 2
P
+
u+
v+
+
8cp=
F (t)p 2 gy
at
,
(3. 6)where cp is the velocity potential and F is a function dependent on t
alone. The Bernoulli equation is applicable only where Equation 3. 5 is
val id; i. e. for irrotational flows.
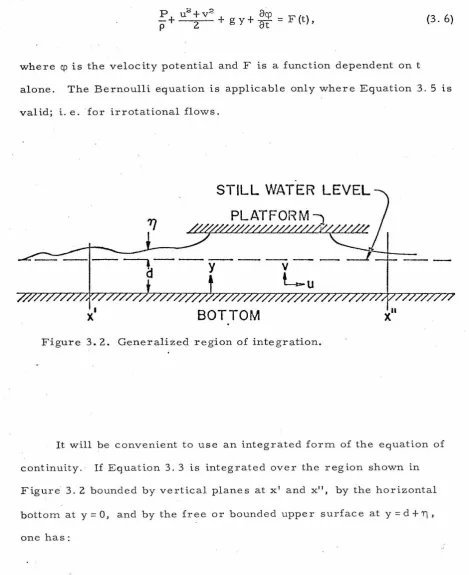
STILL
V/ATER
LEVEL
- - - . - - - -
d
y
v
Lu
x'
BOTTOM
x"
Figure 3. 2. Generalized region of integration.
It will be convenient to use an integrated form of the equation of
continuity. If Equation 3. 3 is integrated over the region shown in
Figure· 3. 2 bounded by vertical planes at x' and x11
, by the horizontal
bottom at y
=
0, and by the free or bounded upper surface at y=
d+
T), [image:45.542.29.499.110.686.2]r
llr
+
T\(~~
+
~;)dy
dx =o.
x' o
(3. 7)
Leibnitz' formula for the differentiation of integrals (see Bronwell,
1953, p. 110 or other mathematics texts) is:
a.2
dF(a.,u)
=
_!i_(
f( ) d=
du duJr x,u x
a.1 .
of(x, u)
au
dx, (3. 8)where F
(a,
u) is differentiable and where the limits a.1 ,a
2 are functionsof u. When the formula is applied to the first term in Equation 3. 7,
and when the second term is integrated, Equation 3. 7 becomes:
x" d
+
T\~}-:x
L
udy _ u s Q.!l 0 x+
vsl dx _\ = 0, (3. 9)where the subscript () indicates a value on the upper surface. The
s
kinematic free surface condition (Milne-Thomson, 1960, p. 390) is
When Equations 3. 10, and then 3. 2, are substituted into Equation
3. 8, one obtains:
(1
x'
U 011
+
o
ox
8x
jo
t
+
r, u d yJ
dx~
0. (3. 11)Since it is assumed that at a given instant U is independent of x in the
region of integration, Equation 3. 11 may be integrated to:
d
+
11 x"[t
u d y - UT! ] x'=
O, (3. 12)or:
d
+
ri~
u dy - U11 = Const. (3. 13)0
In the pre sent study, the constant is zero, because far ahead of any
disturbance, u = 0 and 11=0. Thus the continuity equation becomes
d +11
~
udy=U11, (3.14)0
u(d+T)) =UT). (3. 15)
Similarly, it is convenient to use Equation 3. 4a, the equation of
horizontal motion, after it has been integrated over a region such as
that shown in Figure 3. 2:
~
x" ~d
+ T) [au OU OU 1 oPJ- + u - + v - + - - dy dx = O.
at
ax
ay
pax
I
x 0
(3. 16)
Rearrangement of the third term and introduction of the equation of
continuity (Equation 3. 3) gives:
x" d
+
T)~. ~
[~+
x 0
Now:
2 u ou 8x +
o
Cly (uv) + __! p 8PJ d 8x dx = OY •
du=
ou
+ U oudt 8t 8x
(see the paragraph following Equation 3. 2).
(3. 17)
(3. 18)
Th e quantity ·
dt
du ts · not, in · genera 1 , equa 1 to zero; rat h er, it is pro-portional to~~,
as may be seen by differentiating Equation 3. 14 withd
+'Tl
I
du dU-dt dy
='Tl-
dt·
(3. 19)0
Introduction of Equation 3. 18 into Equation 3. 17 gives:
u
OU+
2 u OU+
..!.
oP
+
du+
a
(uv)J dy dx=
0
OX
ax
pax.
dtoy
(3. 2 0)With the application of Leibnitz' formula, Equation 3. 20 becomes:
x"
j
x'
r1'\
[~
+
u
2-
Uu]
dy -'i.
es
+
u
>
8 -
uu.J
0
+
u v+
s s
d+ 'Tl
J
dx=
0,0
where again the subscript () . indicates that the quantity is to be
s
(3. 2 1)
evaluated on the surface.
a
P
Now a
'Tl
_ s=
0 everywhere on the surface. When the kinematicuX p
surface condition {Equation 3. 10) and Equation 3. 2 are applied to the
second bracketed term in Equation 3. 21, and when the first bracketed
r~
0
x"
+
f
x"
Jd
+
T} duill
dy dx=
0I
x 0
(3. 22)
x'
The momentum equation at this point is subject to the assumptions of
constant wave form, negligible viscosity, surface tension, and air
entrainment.
For the case where horizontal flow is uniform and vertical
velocity is zero for x=x' and for x=x", the first bracketed term of
Equation 3. 22 may be evaluated as follows: the equation of vertical
motion, Equation 3. 4b, becomes:
1 8P
p
ay
+
g = 0; (3. 23)i.e., the pressure is hydrostatic ally distributed. Integration with
.respect to y and evaluation of the integraticn constant in terms of the
surface pressure P gives:
s
d
+
T}J
f
d F(:s
+
g(d~~l)
(
a+m
.
0
(3. 24)
Since in this case u is assumed to be independent of y at x
=
x ' andx
=
x", the velocity terms in the first bracketed term of Equation 3. 22are easily integrated. When the integrated equation of continuity
x" x" (PS+ g(d+TJ) - U
2
T]d \) (d+TJ)
p 2 (d
+
T))2+
~
x' x'
~
d+T]
du-dydx=O. dt
0
(3. 25)
This form of the equation of motion is subject to the assumption that ou
=
O and the assumption that effects of surface tension and viscosityax
are negligible, and is restricted to the case where at x = x' and x = x" pressure is hydrostatic and horizontal velocity is independent of depth.
3. 2 Application of the Analysis. 3. 2. 1. Conditions at x = O.
In the third assumption listed at the beginning of the section, it was supposed that as the wave strikes and propagates beneath the platform, as in Figure 3. 1 b, the horizontal fluid velocity beneath the
seaward edge of the platform and the surface elevation at the seaward edge of the platform are approximately the same as would be found if the platform were not present.
This assumption is somewhat similar to one made by Wiegel (1960, 1964): the power being transmitted by a wave in the range of depth between the bottom of a thin, rigid, vertical barrier and the ocean bottom, is the same as the power transmitted by the wave in that range of depth if the barrier were not there. Wiegel used his assumption to develop a theory to predict the height of waves trans-mitted past the barrier. Comparing measured heights of waves pro-duced in the labor atory with the theoretical wave heights, Wiegel concluded that the theory is 11
useful to the engineer11
, although 11improven1ents in the theory are needed11
The assumption made in the present study takes no account of
the presence of the vertical front face of the platform and is thus
equally applicable to the case of a "thin" horizontal platform with
no front face.
The horizontal fluid element velocity in a solitary wave (with
no platform present) is given by Boussinesq (1872) as:
u
=
IK[
ri -rr
+
(d2 -~)
g
J,
, / d 4d 3 2 dx (3. 26)
where 11 is the elevation of the surface above still water level, d is
the still water depth, and x is the horizontal coordinate. The surface
elevation 11 is given by Boussinesq as:
Tl = H sech2
fYlf"
~,
,/4
dd
(3. 27)where His the wave height. By differentiating Equation 3. 27 twice
with respect to x, and substituting Equation 3. 27 into the result, one
obtains the relationship:
d211 =
dx2
3H11 (
2d3 2 - (3. 28)
Substituting Equation 3. 28 into Equation 3. 26, one obtains an
expres-sion for normalized horizontal fluid velocity u/
,Jgd
in terms of thenormalized quantities Tj/d, H/d:
Equation 3. 27 is an expression for the surface profile as viewed
by an observer moving with the wave at its celerity of propagation U .
0
To a fixed observer, the time ·history of the surface elevation may be
expressed by replacing x with the quantity U (t + t ), where t is a
0 0 0
constant:
11 = H h2 [
rr-Ii
U0 (t +to)J
d
d
secj4
d
d (3. 30)As the wave approaches the point of observation, values oft + t0 are
negative. When the crest passes the observer, t + t
0
=
O; after thewave has passed, t + t0 is positive.
In this study, t = 0 is defined as the time when the approaching
wave first makes contact with the soffit at x
=
0, at an elevation sabove still water level. Therefore, still considering the case where
no platform is present, one must assign to the constant t a value
0
such that when t = 0, 11 = s:
H h2 [
ffli"(
Uo tas
=
secj
4
cl
d) J .
(3. 31)The value of t0 should be negative, since the wave crest is still
ap-preaching the point of observation at t
=
0. (It may be pointed out thatthe absolute value of t
0 is the time needed for the wave crest to arrive
at the point of observation, measured from the time when 11 = s at the
point of observation.)
Therefore at the point of observation x = 0, with no platform
present, the theory of Boussinesq (1872) predicts the fluid velocity