The Labour Market Characteristics and Labour
Market Impacts of Immigrants in Ireland
ALAN BARRETT,*ADELE BERGIN AND DAVID DUFFY The Economic and Social Research Institute, Dublin
Abstract: The purpose of this paper is twofold. We first produce a labour market profile of non-Irish immigrants who arrived in Ireland in the ten years to 2003. We then go on to use the labour market profile in estimating the impact of immigration (non-Irish) on the Irish labour market. Immigrants are shown to be a highly educated group. However, they are not all employed in occupations that fully reflect their education levels. The model of the labour market that we use to simulate the impact of immigration differentiates between low-skilled and high-skilled labour. This allows us to estimate the impact of immigrants (a) if they were employed at a level fitting their education and (b) if they were employed in occupations below their educational level. Our results show that under scenario (a) immigrants who arrived between 1993 and 2003 increased GNP by between 3.5 and 3.7 per cent, largely by lowering skilled wages by around 6 per cent and increasing Ireland’s competitiveness. Under scenario (b), the increase in GNP is reduced to 3 per cent because the impact on skilled wages is lower. If we assume that immigration is primarily unskilled, the impact on earnings inequality found under (a) and (b) is reversed.
I INTRODUCTION
T
he purpose of this paper is twofold. We first produce a labour market profile of non-Irish immigrants (as opposed to returning Irish migrants) who arrived in Ireland in the ten years to 2003. In taking this period, we are essentially looking at immigrants who arrived in Ireland in response to the1
economic growth of the “Celtic Tiger” era. We then go on to use the labour market profile in estimating the impact of immigration on the Irish labour market. This is achieved by running simulations in a structural model of the Irish labour model. In particular, we look at the impact on high-skilled and low-skilled wages and also at the impact on GNP and GNP per head.
As Ireland has only begun to experience large-scale immigration in the last decade, it is clearly important that the nature and consequences of this phenomenon be analysed and understood. From a broader international perspective, Ireland’s experience raises important questions for economic research on the impact of immigration and also for policy. As will be seen below, immigrants into Ireland have notably higher levels of education relative to the domestic population. This in itself makes the Irish experience of interest. However, immigrants in Ireland are not employed in occupations that fully reflect their educational attainment. For this reason, in estimating labour market impacts this “occupational gap” must be taken into account. In addition, policy with regard to immigrants must address the issue of how to reduce the “occupational gap” if the potential contribution of immigrants is to be maximised.
In an earlier paper, Barrett et al. (2002) looked at the labour market impacts of all immigration into Ireland in the mid-1990s (i.e., both non-Irish immigration and returning Irish migrants). They used the educational levels of immigrants in estimating impacts and so did not attempt to capture the possibility of immigrants being employed in occupations below that which their education levels might suggest. As immigration into Ireland at the time was made up primarily of returning Irish migrants and other English speakers who were less likely to suffer any occupational disadvantage, this approach was appropriate. But with an increase in non-Irish and non-English speaking immigration in this decade, it is now important to take account of the occupation issue.
The paper is structured in the following way. In Section II, we begin by describing the data that we use to develop the profile of the labour market characteristics of immigrants in Ireland; we then present the profile. The core findings are that immigrants in Ireland are highly educated relative to the native population but that their occupational distribution does not fully reflect their educational attainment. In Section III, we take these findings and use them in estimating the impact of immigration on variables such as output, earnings and unemployment. We conduct the estimation through a simulation exercise using a model of the labour market. This approach, used by Barrett
II DATA AND LABOUR MARKET PROFILE
The data used to develop the labour market profile of immigrants in Ireland is the Quarterly National Household Survey (quarter 2 of 2003). The survey is undertaken by the Central Statistics Office and its main purpose is to produce quarterly labour force estimates. Throughout the year 3,000 households are surveyed each week; hence each quarterly sample contains 39,000 households. The Central Statistics Office make the micro-data available, although some of the collected data is omitted or aggregated. The sample we use has 101,500 observations. We only look at the adult population (i.e., over the age of 15 years) as our interest is in labour market characteristics. This still leaves a sample of over 75,000.
Our next task is to set out precisely how we define “immigrants” and the groups of “natives” against which we will compare them. We define immigrants in the following way: people who describe their nationality as being other than Irish, were not born in Ireland and have lived here for under ten years. This residency restriction is imposed by the data because individuals who were not born in Ireland are classified as either being resident for more than ten years or less. While a more disaggregated classification would have been useful, the “under ten year” category results in the analysis being focused on immigrants who arrived after the emergence of Ireland’s economic surge.1We compare this group with people who describe themselves as Irish nationals and who say they were born here. This means we omit Irish nationals who were born outside of Ireland. These selections produce two sub-populations – 71,995 natives and 3,530 immigrants.
We present the profile in the following way. We begin with the basic demographic characteristics of age and gender. We then go on to look at the characteristics that will feed into our simulation analysis in Section III, namely, participation, education and occupation. In Appendix 2, we look at some additional characteristics that are of interest in developing an overall labour market profile of immigrants – these include the sectoral distribution of immigrants and a breakdown of education and occupation along gender lines.2
1It should be noted that the immigrants now resident in Ireland are more likely to have arrived
in the last five years rather than being evenly distributed over the ten-year period. Between 1993 and 1999, net inflows averaged around 8,000 per annum; between 2000 and 2004 this figure was over 32,000.
2As the QNHS does not contain data on wages, we are unable to consider this variable. While this
Age and Gender
[image:4.556.104.465.294.460.2]We now turn to developing the labour market profile of immigrants. We begin by looking at the demographic variables age and gender as these are likely to impact upon rates of labour force participation. In Table 1, we show the age distribution of natives and immigrants, with the immigrant group subdivided into four categories, as provided by the CSO in the data file.3The picture that emerges is of an immigrant population that is young relative to the native population. While 44.2 per cent of the native adult population is aged between 20 and 44 years, the corresponding figure for the immigrant population is 81.5 per cent. While this age distribution will impact positively on rates of participation, it is also of interest in the context of Ireland’s ageing population since a younger inflow will offset ageing.
Table 1: Age Distribution of the Native and Immigrant Populations (%s)
Rest of Total
Age Group Irish UK American EU-15 Other Immigrant
15-19 Years 10.7 7.4 4.4 4.8 5.7 6.0 20-24 Years 10.2 7.8 28.2 18.1 24.7 20.3 25-34 Years 16.5 27.3 46.2 25.7 45.4 39.9 35-44 Years 17.5 29.2 15.1 31.4 18.4 21.3 45-54 Years 16.9 12.5 3.6 8.6 4.7 6.8 55-59 Years 7.2 6.3 1.1 2.9 0.6 2.3 60-6 Years4 5.6 3.8 0.9 3.8 0.4 1.5 65+ Years 15.4 5.7 0.5 4.8 0.2 1.9 Total 100.0 100.0 100.0 100.0 100.0 100.0 Mean 40.8 37.2 28.8 35.3 29 31.3 N 71,995 992 563 105 1,868 3,528
As the age distributions are so different across natives and immigrants, it might be argued that the tables below on participation, education etc., should be presented by age category. We prefer not to do this but instead to look at the full native and immigrant populations. Our reason for doing this is that our analysis of the impact of immigration in Section III considers what happens when an immigrant population is added to an existing population, and not some sub-component of it. Also, a regression analysis at the end of this section contains a comparison of the immigrant and native populations controlling for certain variables.
3Generally, in order for non-EEA citizens to work in Ireland they need a work permit. Based on
In Table 2, we look at the gender distribution. There is little difference between natives and immigrants, or across the immigrant categories, with the immigrant population having almost the same proportion of males as the native group.
Table 2: Gender Distribution of the Native and Immigrant Populations (%s)
Rest of Total
Irish UK EU-15 American Other Immigrant
Male 49.0 50.9 47.1 48.6 52.7 51.2 Female 51.0 49.1 52.9 51.4 47.3 48.8 Total 100 100 100 100 100 100 N 71,995 992 563 105 1,868 3,528
Participation, Education and Occupation
We now turn our attention to the variables that will feed into the simulation exercises in Section III and ask what proportions of the native and immigrant populations are employed, unemployed and non-participants. Table 3 shows the distribution of immigrants and natives across ILO categories. The figures shown imply a labour force participation rate of 63.1 per cent for immigrants as against 58.1 per cent for the native population.
The unemployment rates in Table 3 are 6.8 per cent for immigrants and 4.2 per cent for natives and so in relative terms, there is a substantial divergence. This observation of higher unemployment among immigrants is not unusual (Frijters et al., 2003). Generally, possible explanations would include a lack of local labour market information that reduces job search efficiency and a lack of informal local contacts. However, the higher unemployment rates amongst UK and US immigrants relative to the “rest of the EU-15” do not fit well with these explanations. Many of the immigrants in the “other” group are likely to need work permits to be in Ireland, so the low unemployment rate among them is likely to be driven by that requirement. We have no similar ready explanation for the UK, US/rest of EU-15 differential.
Narrowing our focus to people who are labour force participants (i.e., the employed plus the unemployed and excluding those marginally attached and not economically active), we look at the education levels of immigrants relative to natives.4It will be recalled from the Introduction that immigrants in the mid-1990s were observed to have had a high level of educational attainment
4In looking at labour force participants, we are including participants over the age of 65 years.
(Barrett and Trace, 1998). While this might have been the result of Ireland being an attractive destination for highly educated people, it might also have been the result of an information effect, whereby better educated people were the first to know about improving economic conditions in Ireland. The presence of highly educated people might also have been the result of the efficacy of the work permit system,5 if permits had been restricted to high-skilled occupations. As the issuing of work permits expanded in the 2000s (from under 6,000 in 1999 to over 40,000 in 2002) and the permits during this time were mainly for unskilled occupations (Ruhs, 2003), it would be possible that the average education level of the immigrant population had fallen since the mid-1990s.
[image:6.556.104.464.142.401.2]In Table 4, we present the distribution of educational attainments and it can be readily seen that the immigrant population in Ireland is still characterised by high educational levels. This finding replicates that of Minns (2005) which was based on data derived by the OECD from the 2002 Census. Over a half of immigrants (54.2 per cent) have third level qualifications, Table 3: ILO Labour Force Status Distributions of the Native and Immigrant
Populations (%s)
Rest of Total
Irish UK EU-15 American Other Immigrant
In Employment
full-time 45.8 50.4 62.9 37.1 47.4 50.4 In Employment
part-time, not
underemployed 9.8 9.0 9.2 3.8 7.9 8.3 In Employment
part-time, underemployed 0.1 0.0 0.2 0.0 0.2 0.1 Unemployed, seeking
full-time work 2.0 4.2 3.2 5.7 3.6 3.8 Unemployed, seeking
part-time work 0.4 1.2 0.5 0.0 0.2 0.5 Marginally attached 0.4 0.3 0.5 1.9 0.5 0.5 Others not economically
active 41.5 34.9 23.4 51.4 40.1 36.3 Total 100.0 100.0 100.0 100.0 100.0 100.0 Participation rate 58.1 64.8 76.0 46.7 59.3 63.1 UE rate 4.2 8.4 4.9 12.2 6.4 6.8 N 71,995 992 563 105 1,868 3,528
compared with just over a quarter (27.3 per cent) of the native population. At the other end of the educational distribution, while 32.9 per cent of the native population have only lower secondary qualifications or less, only 15.1 per cent of the immigrant population have this low level of attainment. This means that Ireland’s immigration experience continues to differ from that of the US where immigration has been primarily low skilled.
Table 4: Distributions of Educational Attainment for the Native and Immigrant Populations (%s)6
Rest of Total
Irish UK EU-15 American Other Immigrant
No formal/ primary
education 13.7 6.7 1.3 6.8 5.5 Lower secondary 19.2 19.6 2.5 4.3 5.8 9.6 Upper secondary 27.5 18.8 24.9 14.9 23.3 22.0 Post Leaving 12.3 10.5 8.1 8.3 8.8 Third level –
non-degree 10.6 15.8 14.5 6.4 12.9 14.0 Third level –
degree or above 16.7 28.4 48.6 74.5 42.8 40.2 Total 100.0 100.0 100.0 100.0 100.0 100.0 N 41,612 626 393 47 878 1,944
We can take an alternative, although less direct, look at the skills distribution across the two populations by looking at the occupations held by both immigrants and natives and so in Table 5 we show the occupational distributions of the different groups. The figures on education presented in Table 4 would have led us to expect a wider divergence in occupational distributions than we find in Table 5. While immigrants are more heavily concentrated in professional/associate professional occupations, this is only marginally the case. Also, immigrants are less well represented in the management/administrator category. As the “other or not stated” category captures the low skilled occupations, it appears that immigrants are slightly more concentrated in this group relative to natives.7
6As we are now restricting the sample to labour force participants, cell sizes are getting smaller.
For this reason, we need to be cautious in interpreting the figures within immigrant categories, especially the US category.
7Minns (2005) also points to this education/occupation discrepancy when comparing the education
Table 5:Occupational Distribution of Natives and Immigrants (%s)
Rest of Total
Irish UK EU-15 American Other Immigrant
Managers and
administrators 17.7 16.8 9.1 22.4 6.9 10.5 Professional 10.5 14.5 15.2 22.4 10.7 12.9 Associate professional
and technical 8.7 10.9 10.7 18.4 11.6 11.4 Clerical and secretarial 12.2 11.5 16.8 6.1 6.6 10.0 Craft and related 13.6 13.5 5.6 0.0 10.4 10.1 Personal and protective
service 9.8 11.8 19.9 12.2 20.2 17.5 Sales 8.2 5.9 9.3 8.2 6.4 6.9 Plant and machine
operatives 9.8 7.2 6.1 4.1 11.6 9.1 Other (includes
not stated) 9.6 7.9 7.2 6.1 15.6 11.6 Total 100 100 100 100 100 100 % in top three
categories 36.9 42.2 35 63.2 29.2 34.8 N 41,831 643 428 49 1,108 2,228
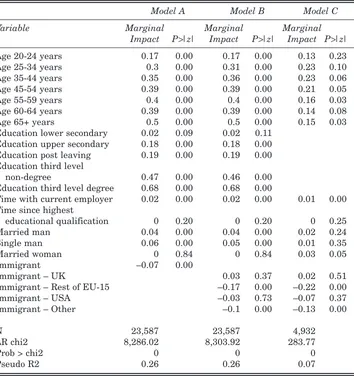
While the education level of the immigrants should work to increase their occupational level, the relative youth of the group (as shown in Table 1) should work in the opposite direction. In order to isolate the effects of these variables and to establish if there is an independent “immigrant” effect on occupational attainment, we ran a probit model with the dependent variable equal to one if the individual’s occupation is manager, professional or associate professional and zero otherwise. The independent variables include age cohorts, education levels, time with the current employer/self-employed, time since graduation, three gender/martial status dummy variables (the omitted category is single female) and a dummy variable equal to one if the individual is an immigrant and zero otherwise.
Turning to the immigrant dummy variable, the negative and significant coefficient indicates that immigrants have lower levels of occupational attainment, controlling for the other variables.8 There are a number of possible explanations for this finding. It could be that employers in Ireland discount educational qualifications earned outside of Ireland and so will offer
8A similar observation has been made in the case of Israel which has also experienced high-skilled
[image:9.556.100.454.141.517.2]immigration (Eckstein and Weiss, 2004).
Table 6: Probit Models of Occupational Attainment (Dependent Variable: Occupation is Manager/Professional/Associate Professional or Otherwise)
Model A Model B Model C
Variable Marginal Marginal Marginal
Impact P>|z| Impact P>|z| Impact P>|z|
Age 20-24 years 0.17 0.00 0.17 0.00 0.13 0.23 Age 25-34 years 0.3 0.00 0.31 0.00 0.23 0.10 Age 35-44 years 0.35 0.00 0.36 0.00 0.23 0.06 Age 45-54 years 0.39 0.00 0.39 0.00 0.21 0.05 Age 55-59 years 0.4 0.00 0.4 0.00 0.16 0.03 Age 60-64 years 0.39 0.00 0.39 0.00 0.14 0.08 Age 65+ years 0.5 0.00 0.5 0.00 0.15 0.03 Education lower secondary 0.02 0.09 0.02 0.11
Education upper secondary 0.18 0.00 0.18 0.00 Education post leaving 0.19 0.00 0.19 0.00 Education third level
non-degree 0.47 0.00 0.46 0.00 Education third level degree 0.68 0.00 0.68 0.00
Time with current employer 0.02 0.00 0.02 0.00 0.01 0.00 Time since highest
educational qualification 0 0.20 0 0.20 0 0.25 Married man 0.04 0.00 0.04 0.00 0.02 0.24 Single man 0.06 0.00 0.05 0.00 0.01 0.35 Married woman 0 0.84 0 0.84 0.03 0.05 Immigrant –0.07 0.00
a lower occupational grade to an immigrant relative to a similarly qualified Irish national. Alternatively, it could be the case that recently arrived immigrants lack local labour market knowledge and so accept jobs below those appropriate to their skill levels while they search for better jobs.9Minns (2005) suggests that the work permit system might be responsible if high-skilled people accept work permits for low-skilled jobs with a view to getting a foothold in the Irish labour market.
In order to investigate this finding of an immigrant “occupational gap” more closely, we re-ran the probit model but distinguished between the four groups of nationalities. One question that can be answered using this approach is whether the work permit system is responsible for the occupational gap. The results are presented in Model B of Table 6. It can be seen that the occupational gap applies to both “rest of EU-15” immigrants and to “others”. This would suggest that the work permit system is not solely responsible since “rest of EU-15” immigrants are outside of this system. Also, the estimated gap for “rest of EU-15” immigrants is stronger than that for “others”.
The fact that UK and US immigrants suffer no occupational disadvantage prompts a suspicion that the occupation gap observed in Model A may be related to English language skills. If this is so, it implies that the finding of a negative coefficient on the immigrant dummy variable could be related to an unobserved variable that is highly correlated with immigrant status and not strictly to being an immigrant. Finally, if we recall the findings on unemployment from Table 3, especially in the case of the rest of EU-15, the result in Model B for this group may point to a greater willingness to accept lower level jobs while searching for better jobs.
The important implication of this finding of an “immigrant occupation gap” will arise in the following section when we estimate the impact of immigrants. If immigrants are employed at a level below that implied by their educational qualifications, it would not be appropriate to treat immigrants with a given level of education as being identical to a native worker with the same level of education (as was done in Barrett et al., 2002). Instead, we should “discount” immigrants’ skills. We return to this point in Section III.
Before leaving this sub-section, we should note that we ran additional probit models to investigate further the occupational gap. In the first additional model, we re-ran the model from Model B but excluded people who had reported their principle economic status as being a student. It could be the case that the gap we are observing is the result of well-educated students
9It should be recalled from footnote 3 that most of the immigrants will have arrived in the later
working part-time in casual jobs. The impact on the immigrant coefficients was minimal and so we can discount this possibility.
In the second set of additional probit models, we divided the sample into the six educational categories and re-ran the equation from Model B. We did this in order to see if the occupational gap was restricted to certain educational categories. Within most of the categories, we found no evidence of an occupation gap. However, the exception to this was the third-level degree group and so we report the results under Model C of Table 6. When we ran the probit for this group only, negative and statistically coefficients were found for immigrants from the “rest of the EU” and “other”. This suggests that the occupational gap relates to third level degree holder from these areas not accessing the occupations that we might expect relative to natives. In an analysis of immigrants to Israel, Friedberg (2000) found that their earnings disadvantage relative to existing Israeli residents could be explained by an undervaluing in the Israeli labour market of education and experience acquired elsewhere. Clearly, a similar process could be at work in Ireland.
III ESTIMATING THE IMPACT OF IMMIGRANTS
We now turn to our estimation of the labour market impacts of immigrants in Ireland. Following the approach of Borjas et al. (1997) and Barrett et al.
(2002) we undertake our analysis in a national framework, through the use of a structural model of the Irish labour market. This approach differs from an approach used in earlier studies of the impact of immigrants on the labour market outcomes of natives. In these earlier studies, changes in the regional variations in immigrant concentrations were correlated with changes in native wage and employment rates in an effort to measure immigrant impacts (Altonji and Card, 1991; LaLonde and Topel, 1991).
In general, studies of this type tended to find little or no impact of immigrants on natives outcomes. However, Borjas et al., (1997) pointed out that regionally based studies were likely to suffer from the following problem. If native workers decided to leave a region (or not to migrate to it) that had experienced a large inflow of immigrants, the impact of immigration would not be captured through regional comparisons. For this reason, they argued that impacts had to be studied at a national level and through simulation exercises using estimates of labour demand elasticities.
The theoretical structure of the model includes four key behavioural relations, namely, output determination, labour supply (which incorporates the migration decision), labour demand and the wage/unemployment equilibrium. The parameters of the model are then estimated using data from 1966 to 2002.
The equation specifications and variable definitions can be found in Appendix 1 so here we only present some of the key features of the model. Output determination is based on a small open economy model where multinational enterprises select a location for production on the basis of world demand and Ireland’s relative cost competitiveness (Bradley and Fitz Gerald, 1988; Bradley et al., 1993; Bergin et al.2003). The labour market is modelled differently depending on the educational qualifications of workers.10 As domestic production has become more technologically advanced and the educational levels of the workforce have improved, high-skilled and low-skilled workers have become less substitutable. Our estimates suggest that by the mid to late 1990s there is essentially a zero elasticity of substitution between high-skilled and low-skilled labour. High-skilled labour supply is very elastic because of the ready availability of migration flows and those with high levels of education are typically more mobile. It also reflects the relatively high-skilled female labour supply elasticity.11High and low-skilled labour are assumed to be complements at the level of the economy as a rise in the cost of either will serve to reduce Ireland’s competitiveness and, therefore, output and employment of both types of labour. We include two possible mechanisms for adjustment within the low-skilled labour market. In one case, low-skilled wages are assumed to be a fixed mark up on social welfare payments; this places a floor on low-skilled wages and so adjustment is through changes in unemployment. In the other case, market clearing operates and adjustment is through wages.
We base the simulations on the net inflow of non-nationals over the ten-year period to 2003. Over this period, net immigration of non-nationals was approximately 72,000.12 From Table 4, we can see that 85 per cent of the immigrant population in Ireland who arrived between 1993 and 2003 is high skilled, compared with 67 per cent of the native population. We apply this per-centage to the number of immigrants who arrived between 1993 and 2003. Hence, in estimating the impact of immigration on the Irish labour market, we
10We define high skilled as those who have at least a higher secondary qualification and low
skilled as those with at most a lower secondary qualification.
11See Doris (2001) for a discussion of the difference between male and female participation
elasticities.
12 This figure refers to non-national immigrants over the age of fifteen. Data on net migration
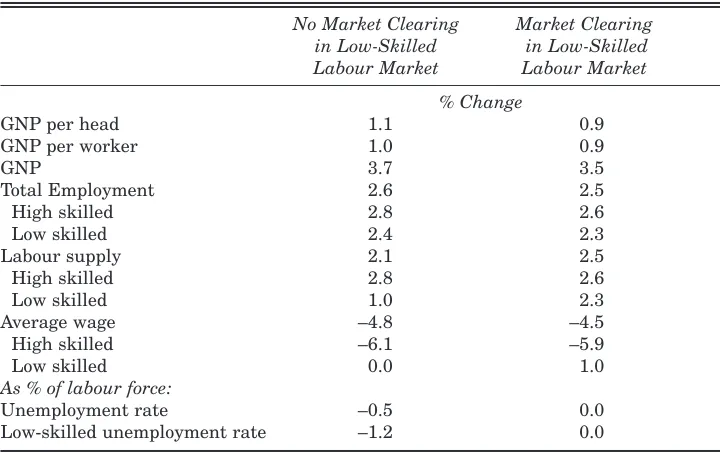
simulate the effects of increasing skilled labour supply by 61,000 (~72,000*0.85) and increasing the low-skilled labour supply by 11,000 (~72,000*0.15). The results are presented in Table 7.
Table 7:Effects of Immigration into Ireland (1993-2003) with Full Utilisation of Immigrant Skills
No Market Clearing Market Clearing in Low-Skilled in Low-Skilled Labour Market Labour Market
% Change
GNP per head 1.1 0.9 GNP per worker 1.0 0.9 GNP 3.7 3.5 Total Employment 2.6 2.5 High skilled 2.8 2.6 Low skilled 2.4 2.3 Labour supply 2.1 2.5 High skilled 2.8 2.6 Low skilled 1.0 2.3 Average wage –4.8 –4.5 High skilled –6.1 –5.9 Low skilled 0.0 1.0
As % of labour force:
Unemployment rate –0.5 0.0 Low-skilled unemployment rate –1.2 0.0
This simulation highlights the crucial role of immigration in the determination of wage and employment levels and the positive role that skilled immigration has played in the Irish economy. The increase in the high-skilled labour supply exerts downward pressure on the high-high-skilled wage, which falls by around 6 per cent in the long run, with the precise estimate depending on which adjustment process in the low-skilled labour market is assumed. This improvement in competitiveness leads to an increase in output, employment and productivity, with GNP being between 3.5 and 3.7 per cent higher than it would have been in the absence of the skilled immigration.
results of Barrett et al. (2002) who find that immigration of skilled or experienced workers in the mid-1990s may have helped reduce earnings inequality and unemployment of those with lower levels of education. The result contrasts with that of Borjas et al. (1997). They showed low-skilled immigration into the US lowering low-skilled wages and acting to increase earnings inequality.
This simulation treats immigrants and natives with the same level of educational attainment as being identical. However, we found in Section II that the occupational pattern of immigrants and natives differs in such a way that immigrants appear to experience an “occupational gap”. Hence, if we treat immigrants and natives with the same level of education as being identical we could well be over-estimating the positive effects of immigration. For this reason, we will consider the estimates in Table 7 to be upper bound estimates of the impacts.
In an attempt to capture this occupational gap we run the simulation assuming that immigrants have the same skills mix as the native population. In essence, we assume that immigrants have the same proportion of people in the no formal qualifications/lower secondary category as the native population (see Table 4). We make this assumption based on the similarity in the occupational distributions of natives and immigrants (see Table 5) and in the absence of a reliable mapping between education levels and occupation levels. It might be argued that this is too strong an adjustment. We would argue in response that the results from this round of estimation should be seen as a lower bound estimate on the impacts of immigration. By combining these estimates with the upper bound estimates above, a good sense of the magnitude of immigration impacts can be established. The results are presented in Table 8.
The overall impact of immigration on the economy is now more muted when the occupational gap is taken into account. The increase in GNP falls from 3.5-3.7 per cent to 2.8-3.0 per cent. This is because wages fall by less than in the previous simulation and so the impact on Irish competitiveness is smaller. The smaller output effect means that the demand impact on low-skilled workers is reduced. This leads to low-low-skilled wages falling in this simulation, when market clearing is assumed (or low-skilled unemployment rising, when market clearing is not assumed).13
Despite the “immigrant occupational gap” the overall estimated macro-economic impact of immigration in Ireland remains positive. However, the
13A similar result is obtained by Cohen and Hsieh (2000) when they look at the impact of
Table 8:Effects of Immigration Adjusting for Occupational Penalty
No Market Clearing Market Clearing in Low-Skilled in Low-Skilled Labour Market Labour Market
% Change
GNP per head 0.5 0.4 GNP per worker 0.8 0.8 GNP 3.0 2.8 Total Employment 2.1 2.1 High skilled 2.2 2.1 Low skilled 1.9 1.9 Labour supply 2.2 2.0 High skilled 2.2 2.1 Low skilled 2.1 1.9 Average wage –3.9 –3.7 High-skilled –4.9 –4.6 Low-skilled 0.0 –0.2
As % of labour force:
Unemployment rate 0.1 0.0 Low-skilled unemployment rate 0.2 0.0
Table 9:Effects of Immigration Reversing the Skills Mix of Immigrants
No Market Clearing Market Clearing in Low-Skilled in Low-Skilled Labour Market Labour Market
% Change
GNP per head –1.4 –1.2 GNP per worker 0.2 0.2 GNP 0.7 0.8 Total Employment 0.5 0.6 High skilled 0.5 0.6 Low skilled 0.4 0.5 Labour supply 2.4 0.6 High skilled 0.5 0.6 Low skilled 5.5 0.5 Average wage –0.9 –1.1 High skilled –1.1 –0.5 Low skilled 0.0 –3.7
As % of labour force:
[image:15.556.96.455.411.642.2]results are sensitive to the educational distribution of the immigrants. To highlight this and to get a sense of what the impact of immigration would be if there was a large inflow of unskilled people, we reverse the skills mix of the immigrants and simulate what the impact on the Irish economy would be if only 15 per cent are high skilled and the remaining 85 per cent are low skilled. The results are presented in Table 9.
As with the earlier simulations, the immigration inflow increases GNP, albeit by a smaller percentage. However, this hides some negative outcomes. In particular, low-skill workers do badly whether we assume market clearing or not. With market clearing, low-skilled wages fall by 3.7 per cent. As this fall in low-skilled wages is greater than the percentage fall in high-skill wages, the simulation suggests that low-skilled immigration would increase earnings inequality. Without market clearing, low-skill unemployment rises by 4.1 per-centage points. More generally, GNP per head falls. To the extent that GNP per head rather than GNP itself captures living standards, it could be argued that low-skilled immigration has a negative impact.
IV CONCLUSIONS
The labour market profile of immigrants in Ireland has shown them to be a young and highly educated group. If it were the case that immigrants and natives were employed in an identical manner in the Irish labour market, our estimation exercise suggests that immigrants who arrived in the five years between 1993 and 2003 increased GNP by between 3.5 and 3.7 per cent. They may also have had another beneficial impact; by reducing earnings of skilled workers and raising those of unskilled workers, the immigrant inflow acted to reduce earnings inequality.
However, the analysis suggests that immigrants experience an occupational gap, by which we mean that, controlling for a range of factors, immigrants have lower occupational attainment relative to natives. This is an important finding because it alters the impact that immigrants will have on the labour market, a point recognised by Cohen and Hsieh (2000). By factoring this into the simulation exercise, we see that the positive impact of immigration on GNP may have been closer to 3 per cent. Similarly, the impact on earnings inequality is reduced largely because the demand impact which acted to bid up low-skilled wages (or reduce low-skilled unemployment) is lower when the skilled immigrants are not “fully employed”.
unemployment rise by 4.1 percentage points. Also, GNP per head would fall under this scenario, suggesting a decline in living standards.
It should be noted that in focusing our estimation exercise on the direct labour market impacts of immigration, there are a number of other potential impacts of immigration that we are not modelling and hence not capturing. For example, if immigration increases the profitability of firms and hence investment, there could be an outward shift in the labour demand line and hence a second round of effects. Equally, if immigrants put additional pressures on an inelastic housing stock, they could bid up house prices and thereby shift the labour supply curve inwards. While these impacts might be important, our results capture interesting first round impacts against which any additional impacts would have to be assessed.
From a policy perspective, the lessons would appear to be twofold. First, while Ireland has benefited from a high-skilled inflow in recent times, there is no guarantee that the inflow will continue to be high skilled. For this reason, to the extent that policy can impact upon the skill level of immigrants, it should aim to promote the inflow of high-skilled people. In truth, as Ireland is now a small region in a large area of free labour movement (4 million out of an EU-25 population of 450 million), it is questionable as to how much influence can be brought to bear on the nature of the inflow into Ireland. However, to the extent that the demographic structure of many non-EU countries will lead them to be major suppliers of immigrants in the future, this is still an important policy consideration.
REFERENCES
ALTONJI, J. and D. CARD, 1991. “The Effects of Immigration on the Labor Market Outcomes of Less-skilled Natives” in J. Abowd and R. Freeman (eds.),
Immigration, Trade and the Labor Market, Chicago, IL: University of Chicago Press.
BARRETT, A. and F. TRACE, 1998. “Who Is Coming Back? The Educational Profile of Returning Migrants in the 1990s”, Irish Banking Review, Summer.
BARRETT, A., J. FITZ GERALD and B. NOLAN, 2002. “Earning Inequality, Returns to Education and Immigration into Ireland”, Labour EconomicsVol. 9, No. 5. BERGIN, A., J. CULLEN, D. DUFFY, J. FITZ GERALD, I. KEARNEY and D. MCCOY,
2003. Medium Term Review 2003-2010, Dublin: The Economic and Social Research Institute.
BERGIN, A. and I. KEARNEY, 2004. “Human Capital, the Labour Market and Productivity Growth In Ireland”, ESRI Working Paper No. 158, Dublin: The Economic and Social Research Institute.
BORJAS, G., R. FREEMAN and L. KATZ, 1997. “How Much Do Immigration and Trade Affect Labour Market Outcomes?”, Brookings Papers on Economic Activity, Vol. 1, pp. 1-67.
BRADLEY, J. and J. FITZ GERALD, 1988. “Industrial Output and Factor Input Determination in an Econometric Model of a Small Open Economy”, European Economic Review, Vol. 32, pp. 1227-1241.
BRADLEY, J., J. FITZ GERALD and I. KEARNEY, 1993. “Modelling Supply in an Open Economy using a Restricted Cost Function”, Economic Modelling, Vol. 10, No. 1, pp. 11-21 January.
COHEN, S. and C.-T. HSIEH, 2000. “Macroeconomic and Labour Market Impact of Russian Immigration in Israel”, mimeo, Princeton University.
CENTRAL STATISTICS OFFICE, 2003. Usual Residence, Migration, Birthplaces and Nationalities,Census 2002, Volume 4, Dublin: Stationery Office.
CENTRAL STATISTICS OFFICE, 2004. Population and Migration Estimates, Dublin: CSO.
DORIS, A. 2001. “Labour Supply Elasticity Changes during the 1990s”, Quarterly Economic Commentary, December, Dublin: The Economic and Social Research Institute.
ECKSTEIN, Z. and Y. WEISS, 2004. “On the Wage Growth of Immigrants: Israel 1991-2000”, Journal of the European Economic Association, Vol. 2, No. 4.
FANNING, B., S. LOYAL and C. STAUNTON, 2000. Asylum Seekers and the Right to Work in Ireland, Dublin: Irish Refugee Council.
FITZ GERALD, J. and I. KEARNEY, 2000. “Convergence in Living Standards in Ireland: The Role of the New Economy?”, ESRI Working paper No. 134, Dublin: The Economic and Social Research Institute.
FRIEDBERG, R.M., 2000. “You Can’t Take It with You? Immigrant Assimilation and the Portability of Human Capital”, Journal of Labor Economics, Vol. 18, No. 2. FRIJTERS, P., M.A. SHIELDS and S. WHEATLEY-PRICE, 2003. “Immigrant Job
Search in the UK: Evidence from Panel Data”, IZA Discussion Paper No. 902. LALONDE, R. and R. TOPEL, 1991. “Labor Market Adjustments to Increased
MINNS, C., 2005. “How Skilled Are Irish Immigrants? Evidence and Implications”, paper delivered to the Statistical and Social Inquiry Society of Ireland, 24 February.
APPENDIX 1
LABOUR MARKET MODEL
High-skilled labour supply:
The high-skilled participation decision is modelled as a function of the high-skilled consumption wage and a time trend.
NH wH
––––– = f
––––, time POPH pcThe high skilled population is a function of the natural increase and net immigration, where migration is assumed to be driven by lagged changes in the relative wage between Ireland and the UK.
POPH= f (NIPOPH, M)
M= f (relw)
We assume a fixed frictional unemployment rate so that these equations together determine the changes in the wage rate necessary to clear the market.
Low-skilled labour supply:
The low-skilled participation decision is modelled as a function of the real low-skilled consumption wage and a time trend.
NL wL
––––– = f
––––, time POPL pcWithin the low-skilled labour market if the replacement ratio is above a certain threshold then the low-skilled wage rate is determined by the replacement ratio. If the replacement ratio falls below this threshold then the low-skilled labour market clears using the same mechanism as in the high-skilled labour market, with the participation equation determining the wage rate and a fixed unemployment rate.
sw
If ––– > wL_ min
wL
sw
then wL= –––––––
else wL= f (NL, POPL, pc, time)
Output Determination:
Irish output is a function of world output and competitiveness (vis-à-vis
the UK and Germany) where competitiveness is measured in terms of relative unit labour costs.
Qi= f (Q
w, ulci, ulcj)
Labour Demand:
Labour demand for the composite labour input is a function of output and relative factor prices:
w L= f
Qi, ––pk
Within the total labour input bundle the relative demand for high-skilled labour is determined as a function of the relative wage and technical progress (time).
wH LH= f
–––, timewL
Other equations which close the model:
wH*LH+ WL* LL w = ––––––––––––––––––
L L =LH+ LL
N =NH+ NL
Mt = (POPHt– POPHt–1– NIPOPHt)
POPL = NIPOPL+ ML
POP = POPL+ POPH
YWNA ULC = ––––––
GNP
VARIABLE DEFINITIONS AND DATA SOURCES
All data from ESRI databank (Bergin and Fitz Gerald, 2003) unless otherwise stated.
GNP: Constant price GNP.
L: Non-agricultural employment, total.
HK: Human capital index, see Appendix 1.
PC: Personal consumption deflator.
WL: Low-skilled wage, measured as average wage in clothing sector.
WH: High-skilled wage, measured as average wage in non-agricultural sector excluding clothing.
NH: High-skilled labour supply.
RELW Relative after-tax wage between Ireland and the UK.
POPH: High-skilled population of working age, where high skilled is defined as those aged 15-64 years with at least higher secondary education.
T: Annual time trend, measured as actual calendar year.
NL : Low-skilled labour supply.
POPL: Low-skilled population of working age, where low skilled is defined as those aged 15-64 years with education below higher secondary level.
WUK: Wage rate in business sector, UK.
PCUK: Consumer price index, UK.
WSW: Average rate of unemployment benefit for 1 adult and 3 dependents.
WL_MIN: threshold replacement ratio, = 0.65.
M: Net immigration.
NIPOPH: Natural increase in high-skilled population.
NIPOPL: Natural increase in low-skilled population.
APPENDIX 2
ADDITIONAL DESCRIPTIVE STATISTICS – SECTORS, UNIONISATION, CONTRACT TYPES AND GENDER
[image:23.556.97.456.365.640.2]In order to develop further the labour-related picture of immigrants in Ireland, we look at the distribution of immigrants across sectors in Table A1. The sector with the largest divergence between natives and immigrants is “hotels and restaurants”; immigrants are three times more likely to be in that sector (18.2 per cent versus 5.7 per cent). The other sectors in which immigrants are over-represented by notable margins are “real estate, renting and business activities” (13 per cent versus 8.2 per cent) and “health” (13 per cent versus 9.1 per cent). Unsurprisingly, immigrants are under-represented by large margins in “agriculture, forestry and fishing” and “public administration, defence and social security”. The under-representation of immigrants in “wholesale and retail” is possibly more surprising (9.7 per cent versus 14.3 per cent), as is the under-representation in “construction” (7.1 per cent versus 11 per cent).
Table A1: Distribution of Immigrants and Natives by Sector (%s)
Rest of Total
Irish UK EU-15 American Other Immigrant
A Agriculture, Forestry,
Fishing 7.0 2.4 1.2 0.0 2.8 2.3 C Mining and Quarrying 0.4 0.5 0.0 0.0 0.1 0.2 D Manufacturing 15.9 14.9 17.5 18.8 19.4 17.7 E Electricity, Gas and Water
Supply 0.7 0.5 0.5 0.0 0.2 0.3 F Construction 11.0 12.4 3.5 0.0 5.7 7.1 G Wholesale and Retail 14.3 10.2 8.5 12.5 9.6 9.6 H Hotels and Restaurants 5.7 7.8 18.2 14.6 24.3 18.2 I Transport, Storage,
Communication 6.3 4.4 6.4 4.2 2.9 4.1 J Financial Intermediation 4.1 7.1 4.0 4.2 2.7 4.2 K Real Estate, Renting and
Business Activities 8.2 14.4 18.2 16.7 9.9 13.0 L Public Administration;
Two other variables that we will consider, union membership and whether the person’s job is permanent or temporary, are of interest partly in the context of our earlier finding of higher unemployment among immigrants. This could be the result of greater insecurity in the jobs held by immigrants. Obviously, the nature of a job contract is closely related to job security; however, union membership may also be correlated with job security.
[image:24.556.104.465.296.382.2]The proportions of immigrants and natives who are unionised are shown in Table A2 and it can be seen that immigrants are substantially less unionised. In Table A3, we present data on the proportions of immigrants and natives reporting that their jobs are permanent or temporary. A higher proportion of immigrants are in temporary jobs but the percentage (5.6 per cent) is small.
Table A2: Union Membership among Natives and Immigrants (%s)
Rest of Total
Irish UK EU-15 American Other Immigrant
Yes 40.3 22.3 8.9 12.8 11.9 14.0 No 59.7 77.7 91.1 87.2 88.1 86.0 Total 100.0 100.0 100.0 100.0 100.0 100.0 N 32,220 484 381 985 39 1,889
Table A3: Proportions of Immigrants and Natives with Temporary and Permanent Jobs (%s)
Rest of Total
Irish UK EU-15 American Other Immigrant
Permanent Job 96.2 98.1 94.9 94.1 92.2 94.4 Temporary Job 3.8 1.9 5.1 5.9 7.8 5.6 Total 100.0 100.0 100.0 100.0 100.0 100.0 N 30,371 432 316 807 34 1,589
[image:24.556.104.465.431.517.2]The patterns that emerged in the earlier tables are essentially repeated in the gender breakdowns. In Table A4, it can be seen that both the participation rate and the unemployment rate are higher for immigrant men relative to native men and for immigrant women relative to native women. Higher education levels for both male and female immigrants are seen in Table A5, while in Table A6 we see more similar occupation distributions than might have been expected given the differences in education attainment.
Table A4:ILO Status by Gender (%s)
Males Females
Irish Immigrants Irish Immigrants
In Employment full time 61.2 60.5 31.1 39.8 In Employment part time,
not underemployed 4.5 6.0 14.9 10.7 In Employment part-time,
underemployed 0.1 0.1 0.1 0.2 Unemployed, seeking
full-time work 2.9 5.0 1.1 2.4 Unemployed, seeking
part-time work 0.2 0.2 0.6 0.9 Marginally attached 0.5 0.7 0.2 0.3 Others not economically active 30.6 27.5 52.0 45.6 Total 100.0 100.0 100.0 100.0 Participation rate (%) 68.9 71.8 47.8 54.1 Unemployment rate (%) 4.5 7.3 3.6 6.1 N 35,243 1,808 36,752 1,722
Table A5: Education by Gender (%s)
Males Females
Irish Immigrants Irish Immigrants
[image:25.556.99.456.509.641.2]Table A6:Occupation Distribution by Gender (%s)
Males Females
Irish Immigrants Irish Immigrants