Laser Induced Breakdown Spectroscopy for
Identification & Quantification of Elemental
Composition of Steel Structures: A Study of Early Stage
Rust Behaviour in Steel
Osayuwamen Ogboghodo
University of Aberdeen, School of Engineering, Aberdeen, AB24 3UE, United Kingdom
Abstract- The investigation of the signal intensity and plasma temperature parameters involved with steel structures experiencing early stage rust are described. A simple laboratory set-up involving a ruby laser, mirror, focusing lens, collecting optics and a miniaturised spectrometer were used to conduct the experiments. The spectra from the first two shots on the rust steel sample correlates to that of the rust layers where Carbon (C) was the only sensitive element detected. However, the significant presence of C in subsequent shots could be as a result or a combination of: material alteration due to the rust layer, presence of the analyte line in both the layer and underlying bulk material; and residual rust particles still present in the crater or perimeter of the ablation region. Investigating the temperature parameter for both the rust layer and regular surface showed no significant distinction in the values.
I. INTRODUCTION
aser Induced Breakdown Spectroscopy (LIBS) is a useful technique for material characterisation in terms of elemental composition and quantification. Because of its relatively fast measurement, LIBS can be used for real time, in situ analysis without the hassle of exporting the target sample back to the laboratory. Furthermore, LIBS is suitable for non-destructive and non-invasive testing of materials since a small amount of mass and surface area is usually interrogated by the laser. LIBS for field applications require no elaborate equipment set-up and sample preparation [1-10].
LIBS analysis of steel mainly involves the identification of atomic constituents of the sample and with useful calibration standards, determining its concentration (quantitative/semi-quantitative analysis). Rust layers on steel often indicate the presence of iron oxides [1-7] [11-16].
For qualitative analysis, identifying the element emissions in air due to higher ionised species (>10eV) could be difficult because electron-ion recombination (to form neutrals) occurs early due to the restricted plasma expansion [1] [3] [7] [17-18]. As the ambient pressure decreases in air (after the laser shot), the plasma lifetime also decreases due to less trapping and recycling of the absorbed energy in the plasma volume thus species with higher ionisation potential will have recombined with free electrons in the cooling plasma [1-3] [5-6] [19]. In vacuum, the plasma expands freely away from the surface with the ions, electrons, atoms/molecules (ejecta) expanding at different
speeds, thus recombination process occurs at a much latter stage as opposed to air [7]. In water, there is even more difficulty as the plasma exhibits strong plasma confinement and quenching effects making the lifetime of the plasma too short and presence of highly ionised species unlikely. The resulting spectrum is typically dominated by intense background light with little spectroscopic information and broadened emission lines due to the high optical density of the plasma. In some cases, only major elements from ablated samples can be detected. Poor signal output can be attributed to the thermal conductivity, density and incompressible nature of water. Also, majority of the pulse energy after absorption losses is used to create vapour cavity on the solid surface with little or no energy used for excitation purposes [10] [19-38]. However, LIBS signals from rust steel underwater are somewhat low and the ablated particles reduce the water transparency for subsequent laser shots [36].
et al. analysed steel samples using Vacuum Ultraviolet LIBS and compared results with Spark Discharge-Optical Emission Spectroscopy (SD-OES) [42]. Similar sensitivities were obtained for identifying elements of interest related to process control in steel manufacturing. SD-OES showed better Limits of Detection (LOD) in agreement with [18].
Carbon steel as an engineering material accounts for a great percentage of steel production worldwide even with its limited corrosion resistance. It is used in nuclear and fossil fuel power plants, transportation, marine, petroleum production and refining, pipelines, chemical processing, metal processing, mining and construction. In an event where carbon steel is exposed to moist air or a thin film of water, rust formation can accelerate further in an atmosphere containing gaseous atmospheric constituent capable of strong electrolytic activity.
In hazardous areas where physical access is not possible, LIBS can be a useful tool for in situ analysis on steel structures experiencing early stage (I/II) rust; providing single shot spectroscopic information from repetitive sampling at the same location to interrogate both the non-uniform surface and underlying bulk composition. This paper aims to investigate signal intensity as well as plasma temperature parameters of rust steel and identify analyte elements from the surface alteration due to early stage rust.
II. EXPERIMENTAL
Ruby laser of wavelength, pulse width and repetition rate of 694.3 nm, 50 ns, 0.1 Hz respectively were used to interrogate the sample. The pulse energy was kept relatively stable at about 30 mJ through the experiments. The pulse energy level prevented excess material ablation on the rust layer particularly after the first laser pulse and allowed for proper shot-to-shot material analysis.
The laser pulse was directed to the sample via a ruby 45º mirror and 110 mm UV fused silica lens. The collecting optics compacted in an optical cage consisted of:
• Thor labs LB4592 UV fused silica bi-convex uncoated lens with focal length (f= 60 mm), diameter (⌀=50.8 mm)
• Thor labs LB4821 UV fused silica bi-convex uncoated lens with focal length (f= 100 mm), diameter (⌀=50.8 mm)
• Short-pass filter placed between the LB4821 lens and the fibre optic probe to cut-off wavelength above 650 nm, preventing both signal intensity saturation and potential damage of the fibre optic cable
The 600 µm core diameter fibre optic cable was positioned at the end of the cage to collect and transmit plasma light to the entrance slit of the ocean optics USB 2000+ spectrometer with the integration time set to 1ms. The flashlamp of the laser was internally triggered with a Q-switch delay of 1200 µs. To resolve the spectral window against background light and for optimum signal, the pulse generator was used to adjust the delay (to about 1200 µs) between the flashlamp sync pulse and output trigger pulse to the spectrometer. The measured spectrometer delay was
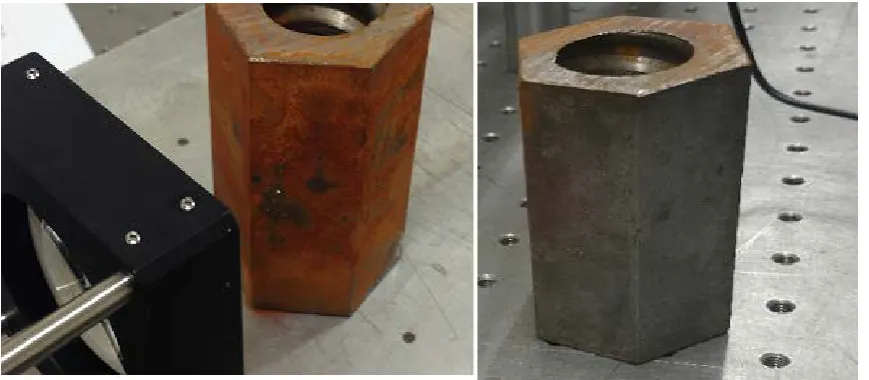
Fig 1. Mild Steel sample showing rust layer and regular surface sections
Fig 2. Laboratory based LIBS set-up
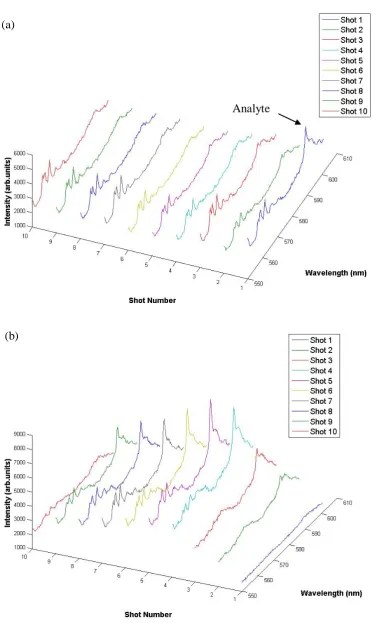
III. RESULTS AND DISCUSSION The first 2 shots on the rust layer show the absence of
the sensitive bulk matrix [Fe (I)] lines within the spectral
window which could only be observed clearly from the 4th shot onwards after more layer ablation and interrogation of
Ruby Laser Pulse
Generator
Mirror
Optical cage Computer
Lens
Spectrometer
[image:3.595.90.471.362.666.2]the bulk composition (Figure 3). This could imply that the
spectra from the initial two shots depicts to a level, the
characteristics of the rust layer. Although the first shot
yields no meaningful spectroscopic information, the
second shot shows the presence of the 588.9 nm analyte
(C) line. From the 4th to 10th shot where sensitive bulk matrix lines appear, the analyte line is still persistent with
significant intensity. This indicates the analyte is present in
both the layer and underlying bulk material. Comparing
with the spectra from the regular surface (Figure 4a), the
analyte line is only significant in the first shot but no clear
observations in subsequent shots as the lines appear
indistinct. Figure 5 shows the intensity variations of the
analyte and bulk matrix lines with shot number for the
[image:4.595.95.489.318.601.2]regular surface and rust layer.
Fig 4 LIBS spectra obtained from regular surface (a) and rust layer (b) section highlighting the analyte line variations
with shot number
(a)
Analyte
Fig 5. Signal Intensity variation with shot number for analyte and bulk matrix lines [(a) regular surface, (b) rust layer]
(a)
The contrast in the analyte line intensity behaviour
could be attributed to the layer characteristics. The rust
layer spectra observation shows similarities to
interrogating a layered material; except in this case, a
particular analyte line sensitivity relating to the layer
composition still persists after layer ablation. To further
validate the results seen in figure 5, the most sensitive Fe
bulk matrix line (526.65 nm) and the analyte line signals
were investigated for the carbon steel sample (regular
surface and rust layer) and compared with the CRM
sample – carbon steel (Figure 6). The standard error bars
were inserted to acknowledge shot-to-shot plasma
variation form the single laser shots. The CRM sample
containing 0.598 % C; shows similarities to the regular
surface of the test carbon steel sample in terms of the
variation trend in the analyte signals. Although, the CRM
shows a better measure of signal repeatability as seen in
the lower error bars (Figure 6c). Greater error bars in the
measured analyte signal observed in figure 6b could be
attributed to the surface non-uniformity from the rust
process. The presence of useful quantity carbon in the rust
layer spectra could be as a result of the presence of iron
carbide in the steel structure and the subsequent leaching
with Fe to form solutions in the event of rust. In steel, none
of carbon is present on its own as it is all dissolved in the
iron as part of the microstructures during manufacturing.
Depending on the stage, rust process could produce a new
and less desirable material from the original steel product.
However, these deductions will have to be validated with
further experiments.
Fig 6. Signal Intensity variation with shot number for analyte and bulk matrix line (Fe/526.65 nm) [(a) regular surface,
(b) rust layer, (c) CRM - Carbon Steel]
8 bulk matrix Fe lines (ranging from 488 nm to 540
nm) were selected and its intensity variation investigated
and compared with the analyte line (C) for both rust layer
and regular surface as shown in figure 5. The selected lines
were subsequently used for Boltzmann plot to measure the
temperature and observe a similar variation for each shot.
The plasma temperature calculated from each plot is
dependent on experimental parameters such as the time
(b)
delay, integration time (gate width) and measured signal
intensity. The slope (eV-1) of the linear plot and the Boltzmann constant (eV/K) were used to determine the
Boltzmann temperature. Table 1 shows the temperature
[image:9.595.98.490.166.497.2]and slope results from the Boltzmann plots.
Fig 7. Selected Fe lines used for Boltzmann plot to measure the plasma temperature
Table 1 Plasma temperature results generated from the Boltzmann plots.
Temperature Slope
Value (K) Accuracy
Error (%)
Standard Error
(K)
Value (eV-1) Accuracy Error (%)
Standard Error
(eV-1)
Regular Surface 7976 ± 57 0.7 ± 18 -1.455 ± 0.01 0.7 ± 0.003
Rust Layer 7886 ± 75 0.95 ± 24 -1.4716 ± 0.014 0.96 ± 0.004
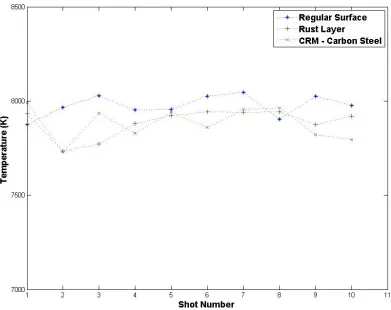
[image:9.595.38.551.589.698.2]Temperature variations relating to the Regular surface, Rust Layer and CRM for each shot are shown in figure 8. There is no
significant distinction as observed in the signal intensity investigation. Under the same experimental conditions, the rust layer showed
the highest mean temperature value over 10 shots. The results in table 1 validate the experimental accuracy of LIBS for single shot
interrogation because of the accuracy errors (not greater than 1.1 %). The calculated plasma temperature relies strongly on the slope of
the Boltzmann plots and thus, temperature accuracy is also dependent on the standard error of the slope. Values of intercept in
Boltzmann plots are rarely used to validate the accuracy of the measured plasma temperature. To ensure some sort of reliability of
using temperature measurements to characterise the rust sample using LIBS, approximations must be adopted to define the plasma
[image:10.612.107.498.256.566.2]state.
Fig 8. Temperature variation with shot number for the clean surface and rust layer sections
IV. CONCLUSION
LIBS usefulness as a method to interrogate rust metals lies on its repeatability, invasiveness, accessibility and analytical power. The spectra from the first two shots on the carbon steel sample correlates to that of the rust layers where C was the only sensitive element detected. However, the significant presence of C in subsequent shots could be as a result or a combination of: material alteration with respect to the bulk composition owing to the rust layer, presence of the analyte line in both the layer and
underlying bulk material and residual rust particles still present in the crater of the ablated region. Investigating temperature variation with shots for both rust and clean surface did not result greatly in distinguishing rust layer characteristics.
Results from studying fundamental intensity and temperature parameters validate to confident degree, LIBS as a fast, real-time,
in situ analytical tool for providing spectroscopic information from repetitive sampling.
• Studying the effects of the presence of the underlying bulk material of steel on LIBS signal related to the rust layer. • Studying the effects of pulse energy on spectra analysis
relating to bulk matrix and analyte signal intensity; and investigating what pulse energy range has the most reduced influence on bulk matrix and analyte signal interaction. • Investigating the effects of rust layer and underlying bulk
composition have in identifying higher ionised elements of interest (notably Fe).
REFERENCES
[1] Singh, Jagdish P, Thakur, Surya N. Laser-Induced Breakdown Spectroscopy; 2007.
[2] Radziemski LJ, Cremers DA. Laser-Induced Plasmas and Applications; 1989.
[3] Noll R. Laser-Induced Breakdown Spectroscopy. : Springer-Verlag Berlin Heidelberg; 2012.
[4] Laser Induced Breakdown Spectroscopy (LIBS): Application to material processing. Pacific Rim Conference on Lasers and Electro-Optics, CLEO - Technical Digest; 2009.
[5] Musazzi S, Perini U. Laser-Induced Breakdown Spectroscopy: Theory and Applications. : Springer; 2014.
[6] Miziolek AW, Palleschi V, Schechter I. Laser-Induced Breakdown Spectroscopy (LIBS): fundamentals and applications. : Cambridge University Press; 2006.
[7] Cremers DA. Handbook of Laser-Induced Breakdown Spectroscopy. Chichester : John Wiley & Sons; 2006.
[8] Stelmaszczyk K, Rohwetter P, Méjean G, Yu J, Salmon E, Kasparian J, et al. Long-distance remote laser-induced breakdown spectroscopy using filamentation in air. Applied Physics Letters 2004; 85(18):3977-3979. [9] LAT 2010: International Conference on Lasers, Applications, and
Technologies. Proceedings of SPIE - The International Society for Optical Engineering; 2011.
[10] The First International Conference on Laser-Induced Plasma Spectroscopy and Applications (LIBS 2000). Spectrochimica Acta - Part B Atomic Spectroscopy; 2001.
[11] Different calibration strategies to overcome matrix effect in steel analysis by Laser-Induced Breakdown Spectroscopy. Proceedings of SPIE - The International Society for Optical Engineering; 2011.
[12] Rapid analysis of steels using laser-based techniques. Proceedings of the Process Technology Conference; 1985.
[13] Gruber J, Heitz J, Strasser H, Bäuerle D, Ramaseder N. Rapid in-situ analysis of liquid steel by Laser-Induced Breakdown Spectroscopy. Spectrochimica Acta - Part B Atomic Spectroscopy 2001; 56(6):685-693. [14] Boué-Bigne F. Laser-Induced Breakdown Spectroscopy applications in the
steel industry: Rapid analysis of segregation and decarburization. Spectrochimica Acta - Part B Atomic Spectroscopy 2008; 63(10):1122-1129.
[15] Nasrazadani S, Namduri H. Study of phase transformation in iron oxides using Laser-Induced Breakdown Spectroscopy. Spectrochimica Acta - Part B Atomic Spectroscopy 2006; 61(5):565-571.
[16] Sturm V, Peter L, Noll R. Steel analysis with Laser-Induced Breakdown Spectrometry in the vacuum ultraviolet. Applied Spectroscopy 2000; 54(9):1275-1278.
[17] Investigation of historical metal objects using Laser Induced Breakdown Spectroscopy (LIBS) technique. THE 8TH INTERNATIONAL CONFERENCE ON LASER APPLICATIONS‐ICLA 2011: AIP Publishing; 2011.
[18] Application of Laser Induced Breakdown Spectroscopy (LIBS) Technique in Investigation of Historical Metal Threads. THE 7TH INTERNATIONAL CONFERENCE ON LASER APPLICATIONS—ICLA 2009: AIP Publishing; 2009.
[19] Laser-Induced underwater plasma and its spectroscopic applications. AIP Conference Proceedings; 2008.
[20] Thornton B, Ura T. A study of Laser-Induced Breakdown Spectroscopy for analysis of the composition of solids submerged at oceanic pressures. OCEANS 2011. Proceedings of MTS/IEEE Conference; 2011.
[21] Thornton B, Ura T. Effects of pressure on the optical emissions observed from solids immersed in water using a single pulse laser. Applied Physics Express 2011; 4(2).
[22] Laser-Induced Breakdown Spectroscopy for in situ chemical analysis at sea. 2013 IEEE International Underwater Technology Symposium, UT 2013; 2013.
[23] Simileanu M, Radvan R. Remote method and set-up for the characterization of the submerged archaeological remains. Journal of Optoelectronics and Advanced Materials 2011; 13(5):528-531.
[24] Pichahchy AE, Cremers DA, Ferris MJ. Elemental analysis of metals underwater using Laser-Induced Breakdown Spectroscopy. Spectrochimica Acta - Part B Atomic Spectroscopy 1997; 52(1):25-39.
[25] Oceanic applications of Laser-Induced Breakdown spectroscopy: laboratory validation. OCEANS, 2005. Proceedings of MTS/IEEE Conference; 2005. [26] Characteristics of pulsed discharge plasma in water. Digest of Technical
Papers-IEEE International Pulsed Power Conference; 2007.
[27] Spectroscopy and imaging of Laser-Induced Plasmas for chemical analysis of bulk aqueous solutions at high pressures. OCEANS 2011. Proceedings of MTS/IEEE Conference; 2011.
[28] Matsumoto A, Tamura A, Fukami K, Ogata YH, Sakka T. Single-pulse underwater Laser-Induced Breakdown Spectroscopy with non-gated detection scheme. Analytical Chemistry 2013; 85(8):3807-3811.
[29] Evaluation of Laser-Induced Breakdown Spectroscopy (LIBS) as a new in situ chemical sensing technique for the deep ocean. OCEANS 2006. Proceedings of MTS/IEEE Conference; 2006.
[30] A novel approach for LIBS enhancement of cations underwater. Proceedings of SPIE - The International Society for Optical Engineering; 2009.
[31] Lu Y, Li Y, Wu J, Zhong S, Zheng R. Guided conversion to enhance cation detection in water using Laser-Induced Breakdown Spectroscopy. Applied Optics 2010; 49(13):C75-C79.
[32] Lazic V, Laserna JJ, Jovicevic S. Insights in the Laser-Induced Breakdown Spectroscopy signal generation underwater using dual pulse excitation - Part I: Vapour bubble, shockwaves and plasma. Spectrochimica Acta - Part B Atomic Spectroscopy 2013; 82:42-49.
[33] Lazic V, Jovicevic S, Fantoni R, Colao F. Efficient plasma and bubble generation underwater by an optimized laser excitation and its application for liquid analyses by Laser-Induced Breakdown Spectroscopy. Spectrochimica Acta - Part B Atomic Spectroscopy 2007; 62(12):1433-1442.
[34] Lazic V, Colao F, Fantoni R, Spizzichino V, Jovićević S. Underwater sediment analyses by Laser-Induced Breakdown Spectroscopy and calibration procedure for fluctuating plasma parameters. Spectrochimica Acta - Part B Atomic Spectroscopy 2007; 62(1):30-39.
[35] Lazic V, Colao F, Fantoni R, Spizzicchino V. Recognition of archaeological materials underwater by Laser-Induced Breakdown Spectroscopy. Spectrochimica Acta - Part B Atomic Spectroscopy 2005; 60(7-8):1014-1024.
[36] Lazic V, Colao F, Fantoni R, Spizzicchino V. Laser-Induced Breakdown Spectroscopy in water: Improvement of the detection threshold by signal processing. Spectrochimica Acta - Part B Atomic Spectroscopy 2005; 60(7-8):1002-1013.
[37] Beddows DCS, Samek O, Liška M, Telle HH. Single-pulse Laser-Induced Breakdown Spectroscopy of samples submerged in water using a single-fibre light delivery system. Spectrochimica Acta - Part B Atomic Spectroscopy 2002; 57(9):1461-1471.
[38] De Giacomo A, Dell'Aglio M, De Pascale O, Capitelli M. From single pulse to double pulse ns-Laser Induced Breakdown Spectroscopy under water: Elemental analysis of aqueous solutions and submerged solid samples. Spectrochimica Acta - Part B Atomic Spectroscopy 2007; 62(8):721-738. [39] Yao S, Lu J, Chen K, Pan S, Li J, Dong M. Study of Laser-Induced
Breakdown Spectroscopy to discriminate pearlitic/ferritic from martensitic phases. Applied Surface Science 2011; 257(7):3103-3110.
[41] Ardakani HA, Tavassoli SH. Numerical and experimental depth profile analyses of coated and attached layers by Laser-Induced Breakdown Spectroscopy. Spectrochimica Acta - Part B Atomic Spectroscopy 2010; 65(3):210-217.
[42] Hemmerlin M, Meilland R, Falk H, Wintjens P, Paulard L. Application of vacuum ultraviolet Laser-Induced Breakdown Spectrometry for steel analysis - Comparison with Spark-Optical Emission Spectrometry figures of merit. Spectrochimica Acta - Part B Atomic Spectroscopy 2001; 56(6):661-669.
AUTHORS
First Author – Osayuwamen Ogboghodo, University of

![Fig 5. Signal Intensity variation with shot number for analyte and bulk matrix lines [(a) regular surface, (b) rust layer]](https://thumb-us.123doks.com/thumbv2/123dok_us/9093416.982272/6.595.54.446.88.397/signal-intensity-variation-number-analyte-matrix-regular-surface.webp)
![Fig 6. Signal Intensity variation with shot number for analyte and bulk matrix line (Fe/526.65 nm) [(a) regular surface, (b) rust layer, (c) CRM - Carbon Steel]](https://thumb-us.123doks.com/thumbv2/123dok_us/9093416.982272/8.595.42.420.70.335/signal-intensity-variation-number-analyte-regular-surface-carbon.webp)