Georgia State University
ScholarWorks @ Georgia State University
Public Health Theses School of Public Health
Spring 5-7-2016
Association of Physical Activity and Sedentary
Behavior among obese adolescents across
ethnicity: Examination of 2007-2012 NHANES
data.
Tharushi Samaraweera
Follow this and additional works at:https://scholarworks.gsu.edu/iph_theses
This Thesis is brought to you for free and open access by the School of Public Health at ScholarWorks @ Georgia State University. It has been accepted for inclusion in Public Health Theses by an authorized administrator of ScholarWorks @ Georgia State University. For more information, please contact [email protected].
Recommended Citation
Samaraweera, Tharushi, "Association of Physical Activity and Sedentary Behavior among obese adolescents across ethnicity: Examination of 2007-2012 NHANES data.." Thesis, Georgia State University, 2016.
Association of Physical Activity and Sedentary Behavior among obese adolescents across ethnicity: Examination of 2007-2012 NHANES data.
by
THARUSHI SAMARAWEERA
B.S., BERRY COLLEGE
A Thesis Submitted to the Graduate Faculty of Georgia State University in Partial Fulfillment
of the
Requirements for the Degree
MASTER OF PUBLIC HEALTH
APPROVAL PAGE
Association of Physical Activity and Sedentary Behavior among obese adolescents across ethnicity: Examination of 2007-2012 NHANES data.
by
THARUSHI SAMARAWEERA
Approved:
Dr. Richard Rothenberg Committee Chair
Dr. Monica Swahn Committee Member
Acknowledgements
I would like to thank Dr. Rothenberg, my thesis committee chairperson, for his
Author’s Statement Page
In presenting this thesis as a partial fulfillment of the requirements for an advanced degree from Georgia State University, I agree that the Library of the University shall make it available for inspection and circulation in accordance with its regulations governing materials of this type. I agree that permission to quote from, to copy from, or to publish this thesis may be granted by the author or, in his/her absence, by the professor under whose direction it was written, or in his/her absence, by the Associate Dean, School of Public Health. Such quoting, copying, or publishing must be solely for scholarly purposes and will not involve potential financial gain. It is understood that any copying from or publication of this dissertation which involves potential financial gain will not be allowed without written permission of the author.
TABLE OF CONTENTS
ACKNOWLEDGMENTS ...ii
LIST OF TABLES………...vi
CHAPTER I: INTRODUCTION……….7
1.1 Background……….7
1.2 Purpose of Study……….9
CHAPTER II: Review of the Literature………..10
2.1 Physical Activity.………..10
2.2 BMI………….………12
2.3 Sedentary Activity……….14
2.4 Racial/Ethnic Differences………..16
2.5 Gender……….18
REFERENCES………..20
CHAPTER III: MANUSCRIPT……… ..23
INTRODUCTION………...23
METHODS………...25
RESULTS………...30
DISCUSSION………...33
REFERENCES………..37
List of Tables
Table 1: Demographic Characteristics of Study Population, stratified by Ethnicity
Table 2: Demographic Characteristics of Study Population, stratified by BMI status
Table 3:Univariate Analysis of Association of Independent Variables with Obesity
Table 4: Distribution of BMI categories with Ethnicity, Vigorous Physical Activity, and Moderate
Physical Activity
Table 5: Mean (SE) of self-reported minutes/day spent sitting stratified by BMI status and
ethnicity
Table 6: Association between Vigorous and Moderate physical activity with Obesity, stratified
CHAPTER 1
INTRODUCTION
1a. Background
The prevalence of obesity among Americans have increased dramatically over the past 30 years. Since 1980, childhood obesity rates have more than tripled and adult obesity rates have more than doubled . (Fryer et al.,2014). From 2001 to 2012, approximately 17 percent of
States and across other countries, an inactive lifestyle has contributed to the people’s becoming overweight and obese (National Institute of Health, 2012). However, according to the trends in physical activity and sedentary behaviors among US adolescents from 2001-2009, there have been significant increases in the number of days engaging in physical activity, and decreases in television viewing and consumption of sweets and sugar-sweetened beverages across the time period (Iannotti and Wang, 2013). A review of various longitudinal studies related to the relationship of physical activity and sedentary behavior with development of overweight had suggested that increased physical activity and decreased sedentary activity provide a protective effect against relative weight and weight gain over childhood and into adolescence (Must and Tybor, 2005). According to the Youth Risk Behavior Surveillance in 2007, the percentage of US high school students who engaged in the recommended levels of physical activity (at least 60 minutes of physical activity for at least the 5 of 7 days preceding the survey) varied by gender and ethnicity (Li et al., 2010). Among the participants, 43.7% of boys and 25.6% of girls had met the physical activity recommendations. Regarding race/ethnicity groups, more White students (37%) had met the physical activity recommendations compared to Black (31.1%), Hispanic (30.2%), and Other (32.4%) high school students. Promoting adolescent participation in physical activity through support from parents and peers, along with greater opportunities for
Evaluating the trends in physical activity and sedentary activity across racial/ethnic groups will provide evidence on which groups can benefit from focused intervention efforts.
1b. Purpose of Study
Many studies have provided evidence that a lack of physical activity and sedentary lifestyle are risk factors for developing obesity among adolescents (Larsen et al, 2002). Across racial/ethnic groups, prevalence estimates of adolescents’ BMI have varied due to a combination of variables involving economic contextual factors, cultural influences, and extent of stress-related experiences throughout adolescence (Hernandez and Pressler, 2015). The primary purpose of this study will be to evaluate the association between physical activity and sedentary activity with obesity among adolescents across Non-Hispanic White, Non-Hispanic Black, and Mexican-American populations in the U.S. Both moderate-intensity and vigorous-intensity types of physical activity will be evaluated. Sedentary activity involving minutes of sedentary activity each day will be analyzed between obese adolescents and those who are not obese, across ethnicity. This study will utilize secondary data involving demographic, examination, and questionnaire information among adolescents 12-15 years old from NHANES datasets through 2001-2010. Through analysis of the data, the study will provide further information on the disparities among racial/ethnic groups related to the association between physical activity and sedentary activity with obesity in adolescents.
CHAPTER II
REVIEW OF THE LITERATURE
2a. Physical activity
The benefits of physical activity have been widely studied throughout the years in the U.S. and across many countries. According to the American Health Association, physical activity has been shown to reduce the risk of the most prevalent health conditions today, including heart disease, stroke and diabetes. Engaging in physical activity regularly can help people maintain a healthy weight, improve cognitive functions, and reduce the risk of many chronic diseases and condition (Warburton et al.,2006). Along with healthy diet, participation in physical activity has also been shown to reduce one’s risk of cancer and chronic diseases (Eyre et al., 2004). Physical activity can be measured in metabolic equivalents, also known as METs (Bushman, 2012). The terms “light”, “moderate”, and “vigorous” are the three types of exercise intensities described when measuring exercise activity. Light intensity activities involve activities such as slow walking and engaging in light work such as cooking and washing dishes while standing.
Moderate intensity activities require more effort than light-intensity activities and increases one’s heart rate (WHO, 2016). Examples of moderate intensity activities include brisk walking, heavy cleaning and recreational bicycling. Vigorous activities require a large amount of effort and result in rapid breathing and a substantial increase in one’s heart rate (WHO, 2016). This intensity-type activities include hiking, jogging, and intense bicycling.
in the recommended amount of physical activity each week. Related to socioeconomic status, more educated adults and whose family income is above the poverty level are more likely to meet the 2008 Physical Activity Guidelines, compared to adults with less education and families with income at or near the poverty level. The CDC reports that less than 3 in 10 high school students get at least 60 minutes of physical activity every day (2015). According to data from the National Health and Nutrition Examination Survey (NHANES) and the NHANES National Youth Fitness Survey in 2012, only about one-quarter (24.8%) of U.S. adolescents, aged 12-15, met the federal physical activity guidelines of engagement in moderate to vigorous physical activity for at least 60 minutes each day. The survey also found that only 27% of boys and 22.5% of girls had engaged in moderate to vigorous physical activity for 60 minutes or
more daily in 2012; however, these results were not statistically significant. The CDC states that most studies of physical activity among children and adolescents have found boys to be more physically active than girls.
The recommendations for physical activity depend on one’s age and differ related to intensity and time participating in physical activity during a week. For children and adolescents, ages 6-17 years old, the CDC recommends 60 or more minutes of physical activity each day. Aerobic, muscle strengthening, and bone strengthening activities are the types of activities suggested for this age group (2014).
The trends in physical activity among adolescents in the U.S. have been analyzed in studies through several years. A study conducted by Adams (2006) analyzed the trends in
period; however, the study reports that the overall changes are insignificant. A study evaluating the trends in physical activity in U.S. adolescents, ages 11-16, from 2001-2009 found that participation in physical activity increased over time and adolescents reported significantly more engagement in physical activity in 2009-2010 than in 2001-2002 (Iannotti and Wang, 2013). The same study also reported that these trends are encouraging, and efforts to maintain physical activity in adolescents and decrease sedentary behaviors are essential for this age group. The prevalence of physical activity and obesity among adults in the U.S. between 2001-2011 was analyzed through data from the Behavioral Risk Factor Surveillance System (BRFSS) and the NHANES survey (Dwyer-Lindgren et al.,2013). The results of this study indicated that both physical activity and obesity rates had increased during this time period. The researchers in this study noted that although the rise in physical activity rates will have a positive impact on Americans’ health, more aggressive strategies to prevent obesity are necessary. Incorporating physical activity into adolescents’ lifestyle will encourage positive behavior changes and prevent obesity in adulthood.
2b. Body Mass Index (BMI)
An individual’s body mass index, also known as BMI, a measure utilized as a screening
same gender or age in the U.S. (CDC, 2015). The table below provided by the CDC illustrates the BMI-for-age status categories and the corresponding percentiles, which were based on expert committee recommendations.
The CDC also provides the corresponding BMI-for-age growth charts for children and adolescents ages 2-20 years old, separated by gender. Although calculating a child or
adolescent’s BMI is a screening method for weight and health issues, it cannot be utilized as a diagnostic tool to determine if the individual’s excess fat is an issue. Further assessments of skinfold thickness measurements, diet, physical activity and family history are necessary to evaluate excess fat in the individual. According to the CDC’s “Body Mass Index, U.S., 1960-2002” report, the average BMI among female and male adolescents in the U.S. had increased significantly for every age group (Ogden et al., 2004). The largest BMI increases were among males 17 years old and females who were 19 years old and over. In the book “An Invitation to Health” (2003), the author, Dianne Hales, reports that “obesity among children in America has increased 100 percent in the last 20 years” and that 14 percent of adolescents are were
overweight. She also reports that overweight adolescents 15- to 17-years old have a greater chance of become obese as adults, compared to other adolescents who have healthy weights. Children and adolescents ages 2-19 years old who have BMI percentiles in the overweight range have a greater risk of developing hypertension, hyperlipidemia, and cardiac risk factors.
and social discrimination due to their weight. These children and adolescents are also more likely to become overweight or obese in adulthood (Freedman et al,, 2008).
A study involving approximately 12,800 adolescents enrolled in The national Longitudinal Study of Adolescent Health explored the association between overweight
adolescents in the U.S. with physical activity and inactivity levels over a 1-year period (Larson et al.,2001). The study also analyzed the ethnic and racial differences among these variables. The prevalence of overweight was highest among adolescent Non-Hispanic black girls, Non-Hispanic white boys, and Hispanic white girls. The results after the 1-year period showed that an increase in moderate to vigorous physical activity led to reduced BMI among the adolescents in all racial groups. This finding was found to have the greatest potential among Non-Hispanic white and black adolescents; and excluding Asians. In regards to the sedentary activity variable, TV/video viewing, the odds of overweight adolescents were approximately 50% or higher with increased TV/video viewing activity. This study depicts how physical activity and sedentary activity
behaviors have an influence on adolescents’ BMI during a time period. The author’s in the study noted that specific intervention programs could target adolescents in racial groups at risk for developing obesity and unhealthy behaviors.
3c. Sedentary activity
nutritious diet, regular physical activity and limiting sedentary behaviors such as TV viewing, leisure-time computer use, and video games to prevent obesity among youth. According to an issue brief “Sedentary Behaviors and Youth” based on a research review, the article notes that the majority of children and adolescents are not meeting the national guidelines goal of
participating in at least 60 minutes of moderate-to-physical activity every day. The increase of sedentary activities has contributed to this finding (Lou, 2014). The issue brief also emphasizes that sedentary behavior also increases the risk for overweight and obesity in adulthood. The research review found that children and adolescents spend an average of 6-8 hours per day engaging in sedentary behaviors, both during and outside of school. The review reported that there are relatively strong links between TV viewing and obesity, along with increased fat mass and higher BMI. Related to racial differences, the review illustrated that African American children report spending more time participating in sedentary behaviors compared to that of White children. Also, children of lower income families had reported more time doing sedentary behaviors than children of more affluent families (Lou, 2014). Among adolescents, other health outcomes such as substance use, reduced self-worth, depression, and reduced quality of life have been linked to their time spent watching TV (Reeves et al.,2008). A cross-sectional study
differences should be considered when developing interventions focused on this age group. Sedentary behaviors among adolescents can be incorporated into interventions by developing strategies to decrease the amount of time adolescents are spending watching television along with playing video games and engaging in excessive cellphone use. By minimizing the sedentary behaviors among adolescents and encouraging them to participate in activities or sports they may be interested in, they will likely develop healthier behaviors and reduce their risk of developing obesity or other related conditions in adulthood.
2d. Racial/Ethnic Differences
differences across racial groups, more beneficial strategies could be developed in interventions or policies to target potential socioeconomic or cultural influences on adolescent behavior. A study evaluating the association between technology and food cravings over a 1-week period among adolescents found that Non-Hispanic adolescents had showed stronger
associations between television viewing and cravings for all categories of food and drinks (Borgogna et al., 2014). However, compared to other ethnicities, Hispanic adolescents had stronger associations between phone messaging and cravings for similar unhealthy snacks. The study noted that the extent to which these groups are affected related to these findings are
necessary to determine as technology continues to evolve. Adolescent and adult obesity rates are higher among the Hispanic population and lower in the Asian population, compared to that of whites in the in the U.S (Albrecht et al.,2007). Between 1986-1998, the prevalence of overweight Hispanic adolescents had increased 120% compared to 50% for white adolescents (Strauss and Pollack, 2001). A study conducted by Albrecht and Gordon-Larsen (2013) analyzed longitudinal data from the National Longitudinal Study of Adolescent Health from 1996-2009. The
researchers found that among Hispanic adolescents, persons of Mexican and Puerto Rican origin had shown greater increases in BMI both in adolescence and in adulthood, relative to white adolescents. However, these findings were not found to be attributable to the measured social and behavioral factors in the study. In comparison, Asian adolescents had significantly lower BMI values and slower BMI increases in adulthood. The observed trajectories in BMI were unable to be accounted for; however, the study reported that social, cultural, and other
Previous research has shown that overweight status and obesity during adolescence is affected by community and family adversities that result in socioeconomic problems in young adulthood (Burdette and Needham, 2012). In a study involving a representative sample of more than 37,000 adults in California, the strength of the relationship between BMI and SES
significantly differ with larger effects for whites, compared to that of the black and Hispanic population. A study conducted by Bae et al., 2014 involved analysis of the racial/ethnic
differences in the influence of early socioeconomic conditions on the level and rate of change in youth BMI on socioeconomic attainment in young adulthood. Their results indicated that the initial levels of adolescent BMI and the rate of change in BMI independently contribute to the consequent socioeconomic attainment as young adults. Moreover, the effect of this finding was stronger among white adolescents compared to blacks. This association was attributed to blacks possibly experiencing less pressure to conform to conventional social norms for weight status compared to white adolescents. The study also emphasized that early socioeconomic adversity had influenced BMI levels and growth among white adolescents compared to their Asian peers, possibly due to white adolescents experiencing more benefits of early socioeconomic affluence, such as recreation and educational facilities. These findings among the various studies suggest that BMI differences among racial groups may influenced by cultural factors along with socioeconomic adversities and life experiences during adolescence.
2e. Gender
(2014) also showed that there was a stronger, positive relationship between early adversity and the level and growth in BMI among women compared to men. Their findings suggested that female adolescents are more susceptible to early socioeconomic adversity than male adolescents. Females and males have been shown to respond to stress associated with adverse events
differently, both from a behavioral and physiological view (Epel at el., 2001). These differences were noted to contribute to disparities in weight status between genders. Adverse family stressors during early childhood such as maternal depression and father incarceration place girls at risk for early-onset obesity (Suglia et al.,2012). Also, exposure to cumulative childhood poverty
REFERENCES
Adams J. (2006). Trends in physical activity and inactivity amongst US 14–18 year olds by gender, school grade and race, 1993–2003: evidence from the Youth Risk Behavior Survey. BMC Public Health;6:57
Albrecht, S. S., & Gordon-Larsen, P. (2013). Ethnic Differences in Body Mass Index
Trajectories from Adolescence to Adulthood: A Focus on Hispanic and Asian Subgroups in the United States. PLoS ONE, 8(9), e72983.
Bae, D, Wickrama, K.A., O’Neal, C.W. (2014). Social consequences of early socioeconomic adversity and youth BMI trajectories: gender and race/ethnicity differences. J Adolesc, 37, pp. 883–892.
Boone, Janne E.; Gordon-Larsen, Penny; Adair, Linda S.; Popkin, Barry M. (2007). Screen Time and Physical Activity During Adolescence: Longitudinal Effects on Obesity in Young
Adulthood. International Journal of Behavioral Nutrition and Physical Activity 4(26): 1-10.
Borgogna N, Lockhart G, Grenard JL, Barrett T, Shiffman S, Reynolds KD. Ecological
momentary assessment of urban adolescents’ technology use and cravings for unhealthy snacks and drinks: differences by ethnicity and sex. J Acad Nutr Diet. 2014. In Press.
Brug, J., van Stralen, M. M., te Velde, S. J., Chinapaw, M. J. M., De Bourdeaudhuij, I., Lien, N., … Manios, Y. (2012). Differences in Weight Status and Energy-Balance Related Behaviors among Schoolchildren across Europe: The ENERGY-Project. PLoS ONE, 7(4), e34742.
Burdette AM, Needham BL. Neighborhood Environment and Body Mass Index Trajectories from Adolescence to Adulthood. J Adolesc Health. 2012;50(1):30–37.
Centers for Disease Control and Prevention. “Facts about Physical Activity”. 23 May 2014. Retrieved. <http://www.cdc.gov/physicalactivity/data/facts.html>.
Bushman, B. A. (2012). How can I use METS to quantify the amount of aerobic exercise. ACSM's Health & Fitness Journal, 16(No. 2), 5-7.
Epel, E., Lapidus, R., McEwen, B., Brownell, K. (2001). Stress may add bite to appetite in women: a laboratory study of stress-induced cortisol and eating behavior
Psychoneuroendocrinology 26 (1), 37–49. http://dx.doi.org/10.1016/S0306-4530(00) 00035-4. Eyre H., Kahn R., Robertson R.M. (2004). Preventing cancer, cardiovascular disease, and diabetes: a common agenda for the American Cancer Society, the American Diabetes Association, and the American Heart Association. Circulation. 109:3244-3255.
Flegal, Katherine M.; Graubard, Barry I.; Williamson, David F.; Gail, Mitchell H. (2005). Excess Deaths Associated with Underweight, Overweight, and Obesity. Journal of the American
Flegal KM, Carroll MD, Kit BK, Ogden CL. (2012). Prevalence of Obesity and Trends in the Distribution of Body Mass Index Among US Adults, 1999-2010. Journal of the American Medical Association 307(5):491-497. doi:10.1001/jama.2012.39.
Fryar CD, Carroll MD and Ogden, C (2012). Prevalence of Overweight, Obesity, and Extreme Obesity Among Adults: United States, Trends 1960-1962 Through 2009-2010. National Center for Health Statistics E-Stat, 2012.
Hernandez, D.C., Pressler, E.A., Dorius, C., Mitchell, K.S. (2004). Does family instability make girls fat? Gender differences between instability and weight. J. Marriage Fam. 76,199–214. Hernandez, D. C. & Pressler, E. (2015). Gender disparities in the association between cumulative stress and adolescent weight status. Preventive Medicine, 73, 60-66. DOI:
10.1016/j.ypmed.2015.01.013.
Gordon-Larsen P, Adair L, Popkin BM. (2002). US adolescent physical activity and inactivity patterns are associated with overweight: The National Longitudinal Study of Adolescent Health. Obesity Research 10: 141-149.
Gordon-Larsen, P., Adair, L. S. and Popkin, B. M. (2002), Ethnic Differences in Physical Activity and Inactivity Patterns and Overweight Status. Obesity Research, 10: 141–149. Iannotti RJ, Wang J. (2013). Trends in physical activity, sedentary behavior, diet, and BMI among US adolescents, 2001-2009. Pediatrics;132(4):606-614.
Powel, L.M., Roy Wada, Krauss, R.C., Wang, Y. (2012). Ethnic disparities in adolescent body mass index in the United States: the role of parental socioeconomic status and economic contextual factors. Soc. Sci. Med., 75 (3)
Li S, Treuth MS, Wang Y. How active are American adolescents and have they become less active? Obes Rev. 2010;11:847–862. doi: 10.1111/j.1467-789X.2009.00685.x.
Must, A., and D.J. Tybor. (2005). Physical activity and sedentary behavior: a review of longitudinal studies of weight and adiposity in youth. Int. J. Obes. (Lond.) 29(Suppl. 2):S84– S96.
NHLBI, NIH. 13 July 2012. “What Causes Overweight and Obesity?” Retrieved
http://www.nhlbi.nih.gov/health/health-topics/topics/obe/causes#
Ogden CL, Carroll MD, Kit BK, Flegal KM. (2014). Prevalence of childhood and adult obesity in the United States, 2011-2012. JAMA, 311(8):806-814.
Robert Wood Johnson Foundation. 2010. Overweight and Obesity Among African-American Youths.
Scharoun-Lee, M., Kaufman, J.S., Popkin, B.M., Gordon-Larsen, P. (2009). Obesity,
race/ethnicity and life course socioeconomic status across the transition from adolescence to adulthood. J. Epidemiol. Community Health 63 (2), 133–139.
Silventoinen K, Rokholm B, Kaprio J, Sorensen TIA. (2010). The genetic and environmental influences on childhood obesity: a systematic review of twin and adoption studies. Int J Obes;34:29–40. doi: 10.1038/ijo.2009.177.
Strauss RS, Pollack HA. Epidemic increase in childhood overweight, 1986-1998. (2001). JAMA.;286:2845-2848.
Suglia, S.F., Duarte, C.S., Chambers, E.C., Boynton-Jarrett, R. (2012). Cumulative social risk and obesity in early childhood. Pediatrics 129 (5), e1173–e1179. http://dx.doi.org/10.1542/peds. 2011-2456.
Warburton DER, Nicol CW, Bredin SSD. (2006). Health benefits of physical activity: the evidence. CMAJ : Canadian Medical Association Journal. 174(6):801-809.
doi:10.1503/cmaj.051351.
WHO. Global Strategy in Diet. (2016). "What Is Moderate-intensity and Vigorous-intensity Physical Activity?" Retrieved
CHAPTER III MANUSCRIPT INTRODUCTION
The prevalence of childhood and adolescent obesity in the U.S. and in other countries has been increasing at an alarming rate over the last several decades. This concerning epidemic has led to the development of many intervention efforts and organizations focused on obesity prevention and treatment. Obesity is associated with a reduced quality of life along with poor mental health and development of serious diseases and health conditions (NHLBI, 2013). According to the CDC, from 1980 to 2012, the proportion of obese children aged 6-11 years in the U.S. had increased from 7% to 18%. Among adolescents during the same time period, the percentage of obesity similarly increased from 5% to 21%. In 2012, more than one-third of children and adolescents were either overweight or obese (CDC,2015). Those who are
overweight and obese as teenages are more likely to become overweight as adults, according to a study which found that 80% of children overweight at 10-15 years old were obese adults at 25 years old (Whitlock et al.,2005). The period of adolescence is an essential stage for establishing healthy dietary and exercise habits, which has been shown to last into adulthood (Challenges in Adolescent Health Care: Workshop Report. 2007). Incorporating positive behaviors such as a healthy diet and regular physical activity throughout adolescence will encourage adolescents to continue a healthy lifestyle into adulthood, by also reducing their risk of developing obesity and other long-term health conditions.
youth ages 12-15 years old had reported engaging in 60 minutes of moderate-to-vigorous physical activity daily (NYFS,2012). These results had also shown a difference among
demographics, with males and non-White ethnicities being more active compared to females and Whites. A study that analyzed from 2003-2006 NHANES data among adolescents aged 12-19 years old indicated that adolescents who had spent more time engaging in light-intensity activities had positive cardiometabolic health results, including lower diastolic blood pressure and higher HDL cholesterol values (Carson et al., 2013). Sedentary activity has been considered a contributing risk factor to developing obesity and resulting health conditions. Estimated data has indicated that children and youth are spending an average of 7 hours each day doing
sedentary activities (NHANES,2010). As children and adolescent get older, they engage in more sedentary activities involving TV viewing, video game use, and computer time (NHANES, 2010). A longitudinal study analyzing TV viewing and childhood obesity found that the amount of time spent watching television significantly impact the prevalence of childhood, adolescent, and adult obesity (Gortmaker et al., 1990). The data from the prior study also revealed that decreases in physical activity throughout the time period had reduced lean body mass and lowered energy requirements. Multiple health behaviors including diet, physical activity, and sedentary activity should be addressed to improve outcomes of obesity interventions.
The racial/ethnic disparities among adolescent obesity have been recognized through existing research, and differences in socioeconomic, cultural, and nutritional and family routine backgrounds between ethnicities have been noted as possible contributing factors to the
Foundation, 2010). Relating to inactivity patterns during 1-year study period, Non-Hispanic black adolescents engaged in higher levels of sedentary behaviors compared to other ethnicities (Gordon-Larsen et al., 2002). According to Belcher et al., (2010), youth ages 6-19 years old who were Non-Hispanic black males had spent less time engaging in vigorous physical activity compared to Mexican-American and Non-Hispanic black males. However, white males were shown to have lower obesity rates in the study. These differences in among ethnicities have been analyzed through various time periods and throughout adolescence into adulthood.
The purpose of this study is to analyze the association of physical activity and sedentary activity with obesity prevalence among adolescents 12-15 years old across racial/ethnic groups in the U.S, utilizing data from the 2007-2012 datasets that have been provided by the CDC. The associations will provide further information on how physical activity and sedentary is associated with risk of obesity in each ethnicity. The analysis will also include the univariate association of the these variables and sociodemographic variables with obesity. This study will provide further information on which ethnicities may benefit from efforts focused on changing specific health behaviors to reduce the prevalence of obesity throughout adolescence.
METHODS
Data source
in the survey are selected through a statistical process, sampling the civilian, noninstitutionalized populations in the U.S., by using information provided in the census. Those who were 16 years or older and emancipated minors were interviewed directly, while a proxy respondent presented information to survey participants who were less than 16 years old or those who could not
answer the questions themselves. The respondent in the survey was defined as the first household person 18 years or older listed on the household member roster, who owns or rents the residence where the household members live. The actual survey involves a home interview and health examination. The NHANES interview involves demographic, socioeconomic, dietary, and health-related questions. The examination section includes medical, dental, physiological measurements, and laboratory tests administered by medical personnel. This study used the combined 2007-2008, 2009-2010, and 2011-2012 NHANES datasets involving demographics and questionnaire files for analysis.
Study population
This study only included participants who were males and females between 12-15 years old, and those who identified themselves as Non-Hispanic White, Non-Hispanic Black, and Mexican-American. All other age groups and ethnicities were excluded for the purposes of this study. Involvement in physical activity and sedentary behaviors were assessed from the
Variables
Ethnicity
Ethnicity identification was self-reported and derived from responses to the survey questions on race and Hispanic origin. The original ethnicity variable in the dataset represented five categories, including Mexican-American, Other Hispanic, Hispanic White,
Non-Hispanic Black, and Multi-racial/Other. The new ethnicity variable used in this analysis included a smaller sample of three ethnicity categories; those who were Hispanic White as “1”, Non-Hispanic Black as “2”, and Mexican-American were categorized as “3”.
Physical activity
In the NHANES questionnaire dataset, variables associated with both vigorous-intensity and moderate-intensity activities were utilized for the analysis. For the vigorous-intensity variable, respondents were asked the question “Do you do any vigorous intensity sports, fitness, or recreational activities that cause large breathing or heart rate like running or basketball for at least 10 minutes continuously?”. Participation in vigorous-intensity activity was determined as positive if the respondent answered “yes” to the question. For the moderate-intensity variable, respondents were asked “Do you do any moderate intensity sports, fitness, or recreational activities that cause a small increase in breathing or heart rate such as brisk walking, bicycling, swimming, or golf for at least 10 minutes continuously?”. Participation in moderate-intensity activity was determined as positive if the respondent answered “yes” to the question.
Sedentary Activity
places, or with friends, and also included time spent reading playing cards, watching television, or using a computer.
BMI status
The BMI values calculated for the study’s participants use measured height and weight values as follows: weight(kg)/height(meters^2). The age- and sex- specific BMI percentiles for obesity according to the Centers for Disease Control and Prevention reference standards were provided (CDC, 2007). Adolescent weight status categories and corresponding percentiles were used to determine obese status among the participants. Adolescents whose BMI values were equal to or greater than the 95th percentile were classified as obese according to the BMI categories. Those who had BMI values corresponding to less than the 95th percentile were categorized as “not obese”. To evaluate the distribution of BMI categories, another variable was created to represent adolescents who were categorized as “underweight”, “normal weight”, “overweight”, and “obese”, according to the corresponding percentiles (CDC,2007).
Covariates
groups. Families that had an income less than $44,999 were categorized as “1”, income values ranging from $45,000-$74,999 were categorized as “2”, and income from $75,000 and over was categorized as “3”. The education level of the household reference person was obtained and categorized into four groups. Those who earned less than a high school degree were categorized as “1”, high school degree as “2”, education from some college as “3”, and college degree or above as “4”. Parent marital status was also determined according to the household reference person, and categorized as “1” if married”, “2” if widowed”, and “3” if divorced.
Statistical Analysis
RESULTS
The total sample of NHANES respondents that met the eligibility criteria for the study included 939 adolescents who were 12-15 years old. The demographic characteristics of the study population across ethnicity are included in Table 1. In the sample, 345 (36.7%) of the respondents identified themselves as Non-Hispanic White, 307 (32.7%) as Non-Hispanic Black, and 287 (30.5%) as Mexican-American. Males and females were roughly equally represented in the sample, 49.5% and 50.5% respectively. Across all three ethnicity groups, approximately 40% of the adolescents in the sample were categorized as obese according to the age- and sex-
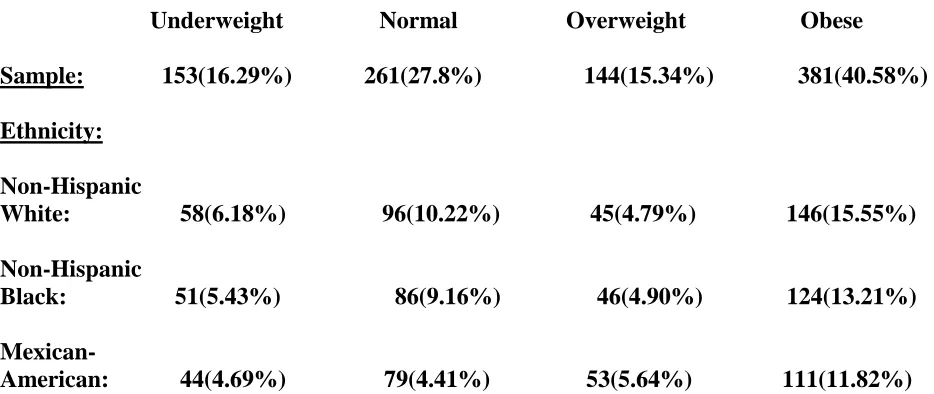
specific BMI percentiles (Table 4). Approximately 15% of adolescents were categorized as overweight, 29% were categorized as normal weight, and 16% percent were categorized as underweight. In each ethnicity, Non-Hispanic White adolescents had the highest prevalence of obesity with (15.5%), followed by Non-Hispanic Black (13.21%), and Mexican-American (11.82%) adolescents. The demographic characteristics of the data illustrated that more Mexican-American households reported having an income of less than $44,999 compared to
Non-Hispanic White and Black families (Table 1). The results also indicated that Non-Non-Hispanic White households had reported a family income of more than $45,000 compared to households of the other two ethnicities. A greater prevalence Mexican-American respondents in the household (17.57%) reported having less than a high school education compared to Non-Hispanic Black and Non-Hispanic White households. However, these socioeconomic differences across ethnicity were not statistically significant according to the analysis (p>0.05). These demographic
A univariate association was conducted to determine the association between the independent variables and obesity in adolescents (Table 3). Non-Hispanic Black and Mexican-American adolescents were less likely be obese compared to Non-Hispanic white adolescents, at 6.3% and 14.4% respectively(OR=0.938; 95%CI:0.678-1.296),(OR=0.856; 95%CI:0.615-1.191). Compared to male, females were 17.3% less likely be obese (OR=0.837; 95%CI:0.581-1.208). Respondents who reported no smoking in the household were also less likely to have obese adolescents in the household, compared to households with family members who smoke. The results also show some indication that households in the median income range ($45,000-$74,999) were more likely to have obese adolescents residing in the household, compared to households with lower than $44,999 family income and higher than $75,000 income (OR=1.082; 95%CI:0.752-1.556). Household members who reported having a high school diploma or being a college graduate or above were found to to have obese adolescents living with them (OR=1.034; CI:0.711-1.556),(OR=1.025; 95%CI:0.686-1.532). However, all of these differences related to sociodemographic characteristics were small and not statistically significant (p>0.05). The data in Table 3 also noted that among obese adolescents, those who had engaged in moderate-intensity physical activity showed some indication of a decreased odds of obesity, compared to adolescents who had not engaged in moderate-intensity physical activity (OR=0.937;
The logistic regression analysis evaluated the association between vigorous and moderate-intensity physical activity with obesity, stratified by ethnicity and adjusted for all covariates. (Table 6). Compared to Non-Hispanic White obese adolescents, Non-Hispanic black obese adolescents had an increased odds of engaging in vigorous-intensity activity (OR=1.009; 95%CI:0.516-1.975). Obese Mexican-American adolescents had decreased odds of engaging in vigorous activity, compared to Non-Hispanic White adolescents (OR=0.897;95%CI:0.516-1.975). Regarding moderate-intensity activity, Mexican-American obese adolescents also had a decreased odds (NS) of engaging in moderate-intensity physical activity (OR=0.845;
no significant difference in time spent sitting per day for those obese (M=353.9,SE=10.69) and not obese(M=366.3,SE=9.14) conditions; t(854)=0.88, p=0.3765.
DISCUSSION
The main focus of this study was to evaluate the association of physical activity and sedentary activity with obesity prevalence among adolescents across ethnicities. In the sample, most of the adolescents were categorized as “obese”, compared to those in the other BMI categories. This finding was also similar across the three ethnicities. The results of this analysis showed some indication that obese adolescents were less likely to engage in vigorous and moderate physical activity compared to those where not obese. Across the three racial groups, Non-Hispanic black obese adolescents were more likely to participate in vigorous-intensity physical activity compared to Non-Hispanic White adolescents. Conversely, Mexican-American obese adolescents were less likely to participate in vigorous-intensity physical activity compared to Non-Hispanic white adolescents. Regarding moderate-intensity activity, both Non-Hispanic Black and Mexican-American obese adolescents were less likely to engage in activity compared to Non-Hispanic white adolescents. However, these results were only significant for the
findings were similar to the results of a previous study comparing family income and children’s obesity in California from 2010-2012, which noted that low income families may live in
Although these findings were found not to be statistically significant, these associations provide further evidence along with previous studies the importance of encouraging adolescents to participate in physical activity. When evaluating the means of time spent sitting each day among adolescents, obese adolescents who were either Non-Hispanic White or Mexican-American had reported fewer minutes of time spent sitting when compared to not-obese
adolescents. Non-Hispanic black adolescents regardless of BMI status, had similar means of time spent sitting each day. Overall, obese adolescents had spent approximately 12 minutes less time sitting compared to those who were not obese. However, these results were not significant according to the t-test that was conducted. Compared to many studies that have shown evidence of the positive association between sedentary activity and obesity, the results of this analysis have shown the opposite relationship. There are various factors that could have resulted in this finding including respondents inaccurately estimating their amount of sedentary activity by overestimating or underestimating how much time they spend sitting each day. Some participants may have also reported extreme values that could have altered the association. Also, adolescents who were categorized as non-obese may have different dietary habits, compared to obese
adolescents and eat healthier foods even though they reported higher minutes of sedentary activity. Likewise, even though obese adolescents may be reporting fewer minutes of sedentary activity, they may be eating unhealthier foods which contribute to their weight gain.
period that may provide more representative findings. Also, adolescents may have either under-reported or over-under-reported answers to the survey questions due to cultural influences and
expectations.
In conclusion, the findings in this study have illustrated that the differences among physical activity and sedentary activity across ethnicities are more similar than different,
according to the data used for this study. Further research related to these health behaviors could focus on differences in availability of recreational facilities and dietary behaviors among
ethnicities in the US. Also, evaluating social and cultural norms related to physical activity could reveal underlying factors that could influence exercise behaviors among adolescents. By
REFERENCES
American Academy of Pediatrics. (2016). Media and Children. Retrieved
https://www.aap.org/en-us/advocacy-and-policy/aap-health-initiatives/pages/media-and-children.asp
Barlow SE. (2007).Expert committee recommendations regarding the prevention, assessment, and treatment of child and adolescent overweight and obesity: Summary report. Pediatrics;120:S164-S192.
Baumann B. Diversities in conceptions of health and physical fitness. J Health Hum Behav 1961;2(1):39–46.
Belcher, B. R., Berrigan, D., Dodd, K. W., Emken, B. A., Chou, C.-P., & Spuijt-Metz, D. (2010). Physical Activity in US Youth: Impact of Race/Ethnicity, Age, Gender, & Weight Status. Medicine and Science in Sports and Exercise,42(12), 2211–2221.
Carson V, Ridgers ND, Howard BJ, Winkler EA, Healy GN, Owen N, et al. (2013). Light-intensity physical activity and cardiometabolic biomarkers in us adolescents. PLoS One;8:e71417.
Challenges in Adolescent Health Care: Workshop Report. (2007). Washington, D.C.: Committee on Adolescent Health Care Services and Models of Care for Treatment, Prevention, and Healthy
Development. Board on Children, Youth, and Families, Division of Behavioral and Social Sciences and Education.
Centers for Disease Control and Prevention.(2015). Adult Obesity Causes and Consequences. Retrieved
http://www.cdc.gov/obesity/adult/causes.html
Gordon-Larsen, P., Adair, L. S. and Popkin, B. M. (2002), Ethnic Differences in Physical Activity and Inactivity Patterns and Overweight Status. Obesity Research, 10: 141–149. doi: 10.1038/oby.2002.23.
Gortmaker SL, Dietz WH, Cheung LW. (1990). Inactivity, diet, and the fattening of America. J Am Diet Assoc. Sep; 90(9):1247-52, 1255.
Gortmaker SL, Dietz WH Jr, Sobol AM, Wehler CA. (1987). Increasing pediatric obesity in the United States. AJDC;141:535-540.
Jin Y, Jones-Smith JC. (2015). Associations Between Family Income and Children’s Physical Fitness and Obesity in California, 2010–2012. Prev Chronic Dis;12:140392.
Lamerz A., Kuepper-Nybelen J., Wehle C.. et al. (2005). Social class, parental education, and
obesity prevalence in a study of six-year-old children in Germany. Int J Obes (Lond); 29: 373–
80.
National Physical Activity Plan Alliance. (2014). United States Report Card on Physical Acitivity for Children. Columbia, SC.
NHLBI. (2013). Managing Overweight and Obesity in Adults: Systematic Evidence Review from the Obesity Expert Panel.
Robert Wood Johnson Foundation. (2010). F As In Fat: How Obesity Threatens America's Future.
Whitlock, Evelyn P.; Williams, Selvi B.; Gold, Rachel; Smith, Paula R.; Shipman, Scott A. (2005). Screening and Interventions for Childhood Overweight: A Summary of Evidence for the U.S. Preventive Services Task Force. Pediatrics 116(1): e125-144.
World Health Organization. (2011) Notes for the media: New physical activity guidance can help reduce risk of breast, colon cancers.
FIGURES AND TABLES
Table 1: Demographic Characteristics of Study Population, stratified by Ethnicity: Adolescents 12-15 years old, NHANES (2007-2012)*
Non-Hispanic Non-Hispanic
White Black Mexican-American Total
Sample size 345 (36.75%) 307 (32.69%) 287 (30.56%) 939
Gender Males: 172 (36.99%) 154 (33.12%) 139 (26.89%) 465
Females 173 (36.50%) 153 (32.38%) 148 (31.22%) 474
Socioeconomic Characteristics: Smoking in Household: 68 (45.03%) 61(40.40%) 22(14.57%) 151
Family income: < $44,999: 133(27.20%) 175 (35.79%) 181(37.01%) 489
$45,000-$74,999: 75(42.61%) 64(36.36%) 37(21.02%) 176
$75,000 and over: 120(58.54%) 47(22.93%) 38(18.54%) 205
Parent education level Less than HS: 62(20.20%) 80(26.06%) 165(53.75%) 307
HS: 77(38.31%) 70(34.43%) 54(26.87%) 201
Some college: 110(40.29%) 117(42.86%) 46(16.85%) 273
College graduate or above: 96(60.76%) 40(25.32%) 22(13.92%) 158
Parent marital status Married: 242(46.63%) 101(19.46%) 176(33.91%) 519
Divorced: 53(44.54%) 42(35.29%) 24(20.17%) 119
Widowed: 4(13.33%) 18(60%) 8(25.67%) 30 *Values for categorical variables presented weighted proportion and percentage. P-values were generated by Chi square test.
Table 2: Demographic Characteristics of Study Population, stratified by BMI status: Adolescents 12-15 years old, NHANES (2007-2012).
Obese Not obese Total
Gender
Males: 201(52.76%) 228(48.00%) 429 Females 180(47.24%) 247(52.00%) 427
Race
Non-Hispanic White: 146(46.20%) 170(53.80%) 316 Non-Hispanic Black: 124(44.60%) 154(54.40%) 278 Mexican-American: 111(42.37%) 151(57.63%) 262
Moderate-intensity
Activity: 160(45.45%) 192(54.55%) 352
Vigorous-intensity
Activity: 107(47.14%) 120(52.86%) 227
Socioeconomic Characteristics:
Smoking in Household: 66(7.75%) 71(8.33%) 137
Family income:
< $44,999: 202(25.35%) 248(31.12%) 450(56.46%) $45,000-$74,999: 74(9.28%) 84(10.54%) 158(19.82%) $75,000 and over 82(10.29%) 107(13.43%) 189(23.71%)
Parent education level
Less than HS: 124(14.49%) 156(18.22%) 280(32.71%) HS: 83(9.70%) 101(11.80%) 184(21.50%) Some college: 108(12.62%) 137(16%) 245(28.62%) College graduate or above: 66(7.71%) 81(9.46%) 147(17.17%)
Parent marital status
Table 3: Univariate Analysis of Association of Independent Variables with Obesity: Adolescents 12-15 years old, NHANES (2007-2012).
Variable N OR 95% CI P-value
Race
Non-Hispanic White 345 Referent
Non-Hispanic Black 307 0.938 (0.678,1.296) 0.6963 Mexican-American 287 0.856 (0.615,1.191) 0.3557
Gender
Male: 465 Referent
Female: 474 0.827 (0.631,1.083) 0.1668
Smoking in Household
Yes: 137 Referent
No: 737 0.838 (0.581,1.208) 0.3429
Family income
< $44,999: 489 Referent
$45,000-$74,999: 176 1.082 (0.752,1.556) 0.6714 $75,000 and over: 205 0.941 (0.668,1.325) 0.7281
Parent education
Less than HS: 307 Referent
HS: 201 1.034 (0.711,1.503) 0.8614 Some college: 273 0.992 (0.702,1.401) 0.9626 College graduate 158 1.025 (0.686,1.532) 0.9037 or above:
Moderate
Physical Activity
No: 504 Referent
Yes: 352 0.937 (0.713,1.232) 0.6417
Vigorous
Physical Activity
No: 629 Referent
Table 4: Distribution of BMI categories with Ethnicity, Vigorous Physical Activity, and Moderate Physical Activity: Adolescents 12-15 years old: NHANES (2007-2012):
Underweight Normal Overweight Obese Sample: 153(16.29%) 261(27.8%) 144(15.34%) 381(40.58%)
Ethnicity: Non-Hispanic
White: 58(6.18%) 96(10.22%) 45(4.79%) 146(15.55%) Non-Hispanic
Black: 51(5.43%) 86(9.16%) 46(4.90%) 124(13.21%) Mexican-
American: 44(4.69%) 79(4.41%) 53(5.64%) 111(11.82%) * Values for categorical variables presented weighted proportion and percentage. P-values were generated by Chi square test.
Table 5: Mean (SE) of self-reported minutes/day spent sitting stratified by BMI status and ethnicity: Adolescents 12-15 years old: NHANES (2007-2012).
Not Obese Obese P-value
Non-Hispanic
White: 350.3 (15.39) 327.6 (17.20) 0.32 Non-Hispanic
Black: 365.6 (15.49) 364.2 (18.68) 0.95 Mexican-
American 385 (16.60) 377.1 (19.50) 0.75 Total: 366.3 (9.14) 353.9 (10.69) 0.37
*SE=Standard deviation
Table 6: Association between Vigorous and Moderate physical activity with Obesity, stratified by ethnicity: Adolescents 12-15 years old, NHANES (2007-2012).
Variable OR 95% CI P-value
Vigorous activity
Non-Hispanic
White: Referent Non-Hispanic
Black:
-Adjusted: 1.009 (0.516, 1.975) 0.97
Mexican-
American:
-Adjusted: 0.897 (0.516, 1.975) 0.77
Moderate activity
Non-Hispanic
White: Referent Non-Hispanic
Black:
-Adjusted:* 0.544 (0.318,0.931) 0.02
Mexican-
American: