Georgia State University
ScholarWorks @ Georgia State University
Public Health Theses School of Public Health
Fall 1-8-2016
Glucose Challenge Test as a Predictor of Type 2
Diabetes
Rahsaan Overton
Follow this and additional works at:https://scholarworks.gsu.edu/iph_theses
This Thesis is brought to you for free and open access by the School of Public Health at ScholarWorks @ Georgia State University. It has been accepted for inclusion in Public Health Theses by an authorized administrator of ScholarWorks @ Georgia State University. For more information, please contact
Recommended Citation
1 | P a g e
Glucose Challenge Test as a Predictor of Type 2 Diabetes
by
Rahsaan Overton
B.S., University of Tennessee-Knoxville
A Thesis Submitted to the Graduate Faculty of Georgia State University in Partial Fulfillment
of the
Requirements for the Degree
MASTER OF PUBLIC HEALTH
2 | P a g e
Abstract
Background: The Centers for Disease Control and Prevention estimates that 30 million Americans are living with diabetes and by 2050, 1 out of 3 U.S. adults could develop diabetes.
Current screening and diagnostic methods for diabetes mellitus include the oral glucose tolerance
test (OGTT), hemoglobin A1c (HbA1c), and fasting plasma glucose (FPG) levels, but each test
when used alone will miss a portion of patients who have the disease. It has been suggested that
the 50-g glucose challenge test (GCT) could also serve as a useful diabetes screening test
particularly in light of its greater convenience compared to the FPG and OGTT. Given the
expected increases in the prevalence of diabetes, it is particularly important to identify
convenient and efficient screening tests which can effectively predict those individuals at highest
risk for the development of diabetes.
Objective:To determine the predictive utility of the GCT in identifying incident diabetes over
five years and to determine whether other important risk factors, including age, gender, race,
body mass index, waist circumference and lipid levels, modify the predictive utility of the GCT.
Methods:We performed a prospective observational study at the Atlanta Veterans Affairs
Medical Center (2009-2012). Eligible participants were those who did not have diabetes at
baseline based on an OGTT. Data on incident diabetes was collected during 5 years of follow-up.
Incident diabetes was defined by patient medical records and ICD-9 codes. Receiver operating
characteristics were used to assess the predictive utility of the GCT, HbA1c, and components of
the OGTT (fasting, 1-hour, and 2-hour measures). The GCT consisted of a 50 gram glucose load
3 | P a g e
Results: Of 1384 eligible participants, 94% were male, 73.4% Black, and median age and body
mass index was 56.0 years and 29.5 kg/m2, respectively. Among those with follow up within 5
years, 133 (9.6%) participants had a new diagnosis of diabetes. The area under the receiver
operating characteristics curves (AROC) for the GCTplasma, GCTcap, HbA1c, and the grouped
measures from the OGTT (fasting, 1-hour, and 2-hour) were 0.634, 0.643, 0.725, 0.657, 0.691
and 0.662, respectively. When comparing AROC values in predicting incident diabetes at five
years, the GCTplasma performed as well as the GCTcap, 2hr-OGTT, and FPG (p>0.05), but had
a significantly lower predictive utility than that of HbA1c and 1hr-OGTT (p <0.01). Among
subgroups of age, body mass index, waist circumference, and triglycerides AROC values for
diabetes risk were greater in patients aged <50 (0.684) and BMI ≥35 (0.713) compared to their
respective reference subgroups.
Conclusion:The GCT performed as well as the currently used 2hr-OGTT and FPG tests at
predicting future incidence of diabetes. Given its convenience as a non-fasting, 1-hour test, the
GCT may provide a practical and efficient approach in identifying those at risk of incident
4 | P a g e
Glucose Challenge Test as a Predictor of Type 2 Diabetes
by
Rahsaan Overton
Approved:
Matthew Magee, Ph.D. Committee Chair
Lawrence Phillips, M.D. Committee Member
Mary Rhee, M.D. Committee Member
5 | P a g e
Author’s Statement Page
In presenting this thesis as a partial fulfillment of the requirements for an advanced degree from Georgia State University, I agree that the Library of the University shall make it available for inspection and circulation in accordance with its regulations governing materials of this type. I agree that permission to quote from, to copy from, or to publish this thesis may be granted by the author or, in his/her absence, by the professor under whose direction it was written, or in his/her absence, by the Associate Dean, School of Public Health. Such quoting, copying, or publishing must be solely for scholarly purposes and will not involve potential financial gain. It is understood that any copying from or publication of this dissertation which involves potential financial gain will not be allowed without written permission of the author.
Rahsaan Overton
6 | P a g e
TABLE OF CONTENTS
LIST OF TABLES………….………...7
Chapter 1: INTRODUCTION...8
Chapter 2: REVIEW OF THE LITERATURE...10
Chapter 3: MANUSCRIPT………... 18
3.1 Abstract………..……….18
3.2 Introduction...…...19
3.3 Methods…………...21
3.4 Results...23
3.5 Discussion...24
7 | P a g e
List of Tables
Table 1: Blood Test Levels for Diagnosing Diabetes and Prediabetes
Table 2A: Comparison of Baseline Characteristics for Study Participants with Incidence of Diabetes and without Incidence of Diabetes over 5 Years
Table 2B: Comparison of Baseline Characteristics for Normal Glucose Tolerant Participants with Incidence of Diabetes and without Incidence of Diabetes over 5 Years
Table 3: Baseline Demographics and Characteristics of Study Participants Stratified by Diagnoses in each Year of Follow-up
Table 4: Comparison of Sensitivity, Specificity and AROC by Test
Table 5A: Comparison of ROC-contrast Probabilities
Table 5B: Comparison of ROC-contrast probabilities: Normal Glucose Tolerant Participants
Table 6: Patient Characteristics and GCTplasma Prediction of Incident Diabetes
8 | P a g e
Chapter 1: Introduction
Background
Diabetes mellitus is a metabolic disorder in which blood glucose levels rise above normal
[1, 2]. Type 2 diabetes is a result of the body not being able to use insulin effectively (insulin
resistance) and or the body’s inability to produce adequate amounts of insulin (insulin
deficiency). Insulin is a hormone produced by the pancreas and facilitates the transfer of glucose
from the bloodstream and into the cells of insulin-dependent tissues. If diabetes is left
uncontrolled, glucose levels will rise and can lead to the development of serious health
complications and other diseases, such as blindness, kidney disease, heart disease, and stroke [1,
2].
According to the CDC, over 200,000 deaths per year in the United States are attributed to
diabetes. Since 1980, the number of diagnoses of diabetes in adults has quadrupled and it is
projected that 1 out of 3 adults could have diabetes by 2050 [1]. Among the 30 million
Americans living with diabetes, approximately 8 million (28%) are undiagnosed, 90 to 95
percent of which have type 2 diabetes[1, 2]. Furthermore, an estimated 86 million individuals
have prediabetes, a high risk condition for the development of type 2 diabetes [1]. The risk of
diabetes also increases with age, is higher in males than females, and disproportionately affects
Hispanics and African Americans compared to non-Hispanic whites.
Early detection of diabetes and prediabetes is key to prevent or delay the progression
from prediabetes to diabetes and to ensure early intervention to combat the risk for
diabetes-related complications and. Large randomized controlled trials have shown that intensive
glycemic management in patients with diabetes leads to significant reductions in diabetes-related
9 | P a g e
reductions in risk compared to later initiation of intensive glycemic management [5] [6]. As
such, identification of effective screening approaches is essential for early diagnosis of diabetes
and in the interest of public health.
The American Diabetes Association (ADA) and National Institute of Health (NIH) have
identified several factors that can lead to increased risk diabetes. Age, gender, race, BMI, waist
circumference, and blood pressure all have been proven to influence the risk of developing type
2 diabetes. Current clinical practices use hemoglobin A1C (HbA1c), fasting plasma glucose
(FPG), and the oral glucose tolerance test (OGTT) to screen for and diagnose type 2 diabetes.
These methods have proven effective but also have individual disadvantages. The use of a
glucose challenge test (GCT) may serve as a more efficient and simple tool to screen for diabetes
and prediabetes given its convenience and low cost. The GCT, a standard screening test for
gestational diabetes during pregnancy, entails the ingestion of a 50-gram oral glucose load at any
time of day, irrespective of fasting or postprandial state, followed by a blood glucose
measurement one hour later. In a screening study by Phillips et al [7], the GCT was shown to be
more accurate in detecting glucose intolerance (diabetes or prediabetes) compared to other
standard methods. In combination with other publications, there is supporting evidence that the
GCT is not only successful in screening for diabetes but could be a useful predictor of future
incidence of diabetes.
Purpose of the Study:
The purpose of this study was to: 1) assess and compare the utility of the GCT, HbA1c and
OGTT (fasting, 1-hour, and 2-hour values) to predict incident diabetes among non-diabetic
patients, and 2) to determine whether other important risk factors including age, gender, race,
10 | P a g e
Research Aims
1. To determine the predictive utility of the glucose challenge test to predict the 5 year
incidence of type 2 diabetes among non-diabetic patients.
2. To compare the utility of the glucose challenge test against the hemoglobin A1c test and oral
glucose tolerance test (fasting, 1-hour, and 2-hour values) in predicting incident diabetes over
5 years, among non-diabetic patients.
3. To determine the predictive value, area under the receiver operating characteristics curve,
within subgroups of age, gender, race, body mass index, waist circumference and blood
pressure in detecting incidence of diabetes.
Hypotheses
1. The glucose challenge test will have greater accuracy in predicting 5-year incident diabetes,
as determined by receiver operating characteristics, than hemoglobin A1c and the oral
glucose tolerance test.
2. Body mass index will have the largest predictive value among the subgroups in detecting
diagnoses of diabetes.
Chapter 2: Review of Literature
Reducing the rate of progression to type 2 diabetes is critical in combating the many
health problems associated with the disease. The American Diabetes Association classifies
prediabetes as, blood glucose levels that are higher than normal but not yet high enough to be
diagnosed as diabetes [8]. The prevalence of prediabetes is estimated to be over 80 million in the
11 | P a g e
cardiovascular disease and stroke [1]. Consequently, diabetes along with cardiovascular disease
and stroke all fall within the top 10 leading causes of death in the United States. Thus it is of
great importance to continue to use our best methods to screen for diabetes and develop methods
to effectively predict future incidences of diabetes.
Predicting Diabetes
Developing accurate and effective measures to predict future incidence of diabetes could
be beneficial in reducing the increasing burden of type 2 diabetes. Growing interest and evidence
suggests that current screening practices and methods can be useful in predicting diabetes in
non-diabetic populations [9-11]. Hemoglobin A1c (HbA1c), fasting plasma glucose (FPG), and oral
glucose tolerance test (OGTT) are all currently used in the clinical setting to screen and diagnose
type 2 diabetes. Several recent publications have taken interest in the utility of these test to
predict future incidences of diabetes among non-diabetic populations.
HbA1c vs FPG
Edelman D. et al [10] in 2004 published a study that assessed the use of HbA1c to
independently predict future risk cases of type 2 diabetes. This prospective study conducted at
Durham Veterans Affairs Medical Center (DVAMC) followed 1253 patients ages 45-64 for 3
years. A baseline visit was conducted measuring HbA1c, those with HbA1c greater than or equal
to 6.0% were invited back and a FPG was taken. An annual phone call was made to patients
during year 1 and 2 to check for diagnoses of diabetes and a repeat visit identical to the baseline
exam was performed during year 3. There were 56 patients at baseline that were determined to
have unrecognized diabetes (HbA1c ≥ 7.0% or FPG ≥ 126 mg/dl) and were still included
12 | P a g e
New incidence of diabetes were calculated over the 3 year period by self-reporting, or
HbA1c ≥ 7.0% or FPG ≥ 126 mg/dl at the 3 year visit. Over the 3 year period, 73 new cases of
diabetes were identified. To assess HbA1c in its ability to predict future cases of diabetes, the
baseline results were stratified into 3 groups: normal (≤ 5.5%), high-normal (5.6- 6.0%), and
elevated (6.1-6.9%). The results showed that there was a correlation between rising HbA1c and
incidences of diabetes. The elevated subgroup of HbA1c had a significantly higher incidence rate
of 7.8 compared to the normal subgroup, 0.8. A multivariable logistic regression model was also
used to assess the known risk factor, age, sex, family history, BMI, and hypertension while
comparing those who did and did not develop a new diagnoses of diabetes. Out of these 5 risk
factors only BMI was seen to be associated with elevated risk after controlling for HbA1c.
Overall, HbA1c was seen in this study to predict future incidence of diabetes in this cohort.
OGTT (0, 30, 60, 120 min)
In 2009, Abdul-Ghani M. et al compared fasting plasma glucose (FPG) to the 75g-
OGTT post-load plasma glucose levels in a study using the results from the Botnia Study. The
study consisted of 2,442 non-diabetic participants from the Botnia Study in Western Finland.
The baseline visit collected plasma glucose and insulin levels measured at 0, 30, 60, and 120
minutes during the OGTT. Participants were then followed for 7-8 years for incidence of
diabetes using ADA criteria. Receiver operating characteristics (ROC) was used to measure the
predictive power at each post-load time point. Tree modeling analysis was also used and
categorized participants into 4 categories: normal glucose tolerance (NGT), impaired fasting
glucose (IFG), impaired glucose tolerance (IGT), and combined glucose intolerance (CGI)
(IFG+IGT). These groups allowed for detailed comparisons to be made across the different
13 | P a g e
The area under the curve (ROC AUC) was calculated for each time point strongest (0, 30,
60, 120 minutes) and concluded that the 1-hour (60 minute) post-load value was the predictor of
future incidence of diabetes with an ROC AUC of 0.795. The remaining time points also
indicated statistically significant results: 30 minute (0.735), 120 minute (0.688) and FPG (0.672).
Hemoglobin A1c (HbA1c) was also measures and resulted in an ROC AUC slightly better than
FPG, 0.679.
1-hour vs 2-hour plasma glucose and FPG
In 2010, Priya M. et al published a study that evaluated the 1-hour and 2-hour post-load
plasma glucose and FPG’s ability to predict progression to diabetes and prediabetes among NGT
subjects. The study was performed in Chennai, South India and consisted of 1,179 participants
selected from a diabetes specialty center. All participants were non-diabetic at baseline (FPG ≤
100 mg/dl) and had undergone an OGTT with a 1-hour and 2-hour plasma glucose sample
between 1997- 2010. The participants were then followed for 7-8 years and assessed for
diagnoses of diabetes or prediabetes at the end of follow-up using ADA criteria. ROC analysis
was used to compare the predictive ability of FPG, 1-hour plasma glucose, and 2-hour plasma
glucose. Sensitive and specificity at multiple cut off values was also assessed using ROC curves.
Incidence of prediabetes and diabetes were reported per 1,000 person-years, continuous variables
were displayed as averages and categorical variables as percentages or counts.
The results of this study concluded that the 1-hour plasma glucose level had a larger
AUC in comparison to the 2-hour plasma glucose and FPG in predicting prediabetes and
diabetes. The AUC for the 1-hour, 2-hour, and FPG in predicting diabetes was 0.689, 0.608, and
0.622 respectively. The 1-hour cutoff for optimal sensitive and specificity cutoff was determined
14 | P a g e
stratified into three categories: < 143 mg/dl, ≥ 143 md/dl - < 155 mg/dl, and ≥ 155 mg/dl. Further
analysis of these subgroups showed that those with 1-hour plasma glucose levels ≥ 155 mg/dl
had a larger proportion to develop diabetes (19.5%) and shorter time to diagnoses compared to
the < 143 mg/dl subgroup (6.6%).
1-hour plasma glucose vs IFG
A more recent study published in 2015 by Fiorentino T. V. et al. [11] also took interest in
the 1-hour post load plasma glucose measurement. This study consisted of 2 sample groups to
assess the 1-hour post load plasma glucose level in predicting future development of type 2
diabetes compared to IFG and IGT. The first group consisting of 595 white nondiabetic adults
from the European Network on Functional Genomics of type 2 diabetes (EUGENE2) project and
the second group contained 392 white adults that were current participants the Cat-Anzaro
Metabolic Risk Factors (CATAMERI) study. Each of the participants in both sample groups had
a 75g OGTT performed with blood samples taken at 0, 30, 60, 90, and 120 minute intervals.
Participants were then classified as having normal glucose tolerance (NGT), isolated IFG, or IGT
according to ADA criteria [8] in reference to the 1-hour plasma glucose. Those who fell into the
NGT group were then separated into a NGT 1h-low group if 1-hour plasma glucose levels were
below 155 mg/dl and NGT 1h-high if above 155 mg/dl.
In first group (EUGENE2 project) a cross-sectional study analysis was preformed to
observe the insulin sensitivity among the cohort. The categorical variables in this group were
compared using a Chi-square test and a general linear model was used to make multiple
comparisons for the variables age, gender, and BMI. In the second group (CATAMERI study), a
longitudinal study analysis was preformed to observe the risk of metabolic and cardiovascular
15 | P a g e
BMI to estimate the hazard ratio to develop type 2 diabetes of the NGT 1h-high, isolated IFG
and IGT groups compared to the NGT 1h-low group. The results from the CATAMERI cohort
showed that those in the NGT 1h-high category are at increased risk for developing type 2
diabetes compared to NGT 1h-low. The hazard ratio for NGT 1h-high, isolated IFG, and IGT
were 4.02, 1.91, and 6.67 respectively. The incidence rate among the entire NGT group was
6.4%, but once stratified into the subgroups, NGT 1h-high (16.7%) has a significantly higher rate
than the NGT 1h-low (2.9%) subgroup. The results of this study are of interest because the use of
the 1-hour plasma glucose measurement has possibly identified an at risk group that under
current ADA criteria would be overlooked and not identified. Evidence is also growing around
the 155 mg/dL 1-hour plasma glucose cutoff as a means to identify future risk of type 2 diabetes.
Screening for Diabetes
There are several screening methods used in detecting and diagnosing diabetes and
prediabetes. The oral glucose tolerance test (OGTT), hemoglobin A1c (HbA1c), and fasting
plasma glucose (FPG). It is recommended by the American Diabetes Association that these test
be repeat upon confirmation to assure accurate testing and greater likelihood of concurrence [12].
These test results are also used in conjunction with signs and symptoms of diabetes to make a
well informed clinical diagnoses of prediabetes or type 2 diabetes [8].
Several studies have shown that a substantial amount of patients can be missed by using
just one test and that some test capture more undiagnosed patients than other. The ADA reports
that HbA1c, FPG, and OGTT identify approximately 30-40%, 50%, and 90% of previously
undiagnosed patients, respectively [13]. These results are supported by the 2003-2006 NHANES
16 | P a g e
conclude that improved methods for the detection of diabetes are in the interest of the public
health community.
Screening using OGTT
The OGTT involves the ingestion of a 75-gram glucose load that must be administered
while fasting, followed by a blood glucose measurement two hours later. Results less than 140
mg/dl are normal, 140 mg/dl to 199 mg/dl indicates prediabetes, and greater than 200 mg/dl,
diabetes [8]. While this test is considered to be the most sensitive, it is often times not used in
clinical practice because it is inconvenient due to the required fasting and time constraint [7]
[16]. Acute stress and diet the day before the test can also alter the results making them not
consistently reproducible and nausea is a potential side effect from the glucose drink.
Screening using FPG
The fasting plasma glucose test is an easy and common laboratory test done to determine
blood glucose levels. It entails one plasma glucose collection under fasting conditions. Results
less than 100 mg/dl are normal, 100 mg/dl to 125 mg/dl indicate prediabetes, and 126 mg/dl or
higher, diabetes [8]. Though relatively simple to perform, like the OGTT, FPG can be easily
altered by day to day diet, illness, or stress resulting in inaccurate measurements [12].
Screening using HbA1c
The HbA1c is a test that measures the average blood glucose level over the past 2 to 3
months. Unlike the OGTT and FPG, no fasting or drinking is required making this test more
convenient to administer [8, 12]. An HbA1c value of less than 5.7% is normal, 5.7% to 6.4%
17 | P a g e
test, there are still limitations that include incomplete correlation between HbA1c and average
glucose levels in certain race/ethnicities and ages [12]. African Americans tend to have higher
HbA1c levels compared to non-Hispanic whites even with comparable FPG [12]. Elevated
HbA1c levels are also found among the aging population [17].
Investigational Screening using Glucose Challenge Test (GCT)
In the screening study by Phillips et al. [7], the glucose challenge test was used as an
alternate screening test to identify prediabetes, dysglycemia, and diabetes. The results indicated
that the GCT was an accurate, convenient, and inexpensive alternative to screen for diabetes and
prediabetes. The study included 1,573 participants that were administered a GCT followed by an
OGTT at a later visit. Fasting plasma glucose (FPG) along with hemoglobin A1c and lipid values
were also measured and recorded for each patient and diagnoses were made using ADA criteria.
Receiver operating characteristics (ROC) analysis was used to compare and determine the
effectiveness of the screening measurements by calculating the area under receiver operating
characteristic curves (AROCs). The GCT out preformed hemoglobin A1C, FPG, and random
plasma glucose (RPG) in detecting diabetes, prediabetes, and dysglycemia. The AROC results
indicated great generalizability to other populations and were unaffected by time of day or
18 | P a g e
Chapter 3: Manuscript
Abstract
Background: The Centers for Disease Control and Prevention estimates that 30 million Americans are living with diabetes and by 2050, 1 out of 3 U.S. adults could develop diabetes.
Current screening and diagnostic methods for diabetes mellitus include the oral glucose tolerance
test (OGTT), hemoglobin A1c (HbA1c), and fasting plasma glucose (FPG) levels, but each test
when used alone will miss a portion of patients who have the disease. It has been suggested that
the 50-g glucose challenge test (GCT) could also serve as a useful diabetes screening test
particularly in light of its greater convenience compared to the FPG and OGTT. Given the
expected increases in the prevalence of diabetes, it is particularly important to identify
convenient and efficient screening tests which can effectively predict those individuals at highest
risk for the development of diabetes.
Objective:To determine the predictive utility of the GCT in identifying incident diabetes over
five years and to determine whether other important risk factors, including age, gender, race,
body mass index, waist circumference and lipid levels, modify the predictive utility of the GCT.
Methods:We performed a prospective observational study at the Atlanta Veterans Affairs
Medical Center (2009-2012). Eligible participants were those who did not have diabetes at
baseline based on an OGTT. Data on incident diabetes was collected during 5 years of follow-up.
Incident diabetes was defined by patient medical records and ICD-9 codes. Receiver operating
characteristics were used to assess the predictive utility of the GCT, HbA1c, and components of
the OGTT (fasting, 1-hour, and 2-hour measures). The GCT consisted of a 50 gram glucose load
19 | P a g e
Results: Of 1384 eligible participants, 94% were male, 73.4% Black, and median age and body
mass index was 56.0 years and 29.5 kg/m2, respectively. Among those with follow up within 5
years, 133 (9.6%) participants had a new diagnosis of diabetes. The area under the receiver
operating characteristics curves (AROC) for the GCTplasma, GCTcap, HbA1c, and the grouped
measures from the OGTT (fasting, 1-hour, and 2-hour) were 0.634, 0.643, 0.725, 0.657, 0.691
and 0.662, respectively. When comparing AROC values in predicting incident diabetes at five
years, the GCTplasma performed as well as the GCTcap, 2hr-OGTT, and FPG (p>0.05), but had
a significantly lower predictive utility than that of HbA1c and 1hr-OGTT (p <0.01). Among
subgroups of age, body mass index, waist circumference, and triglycerides AROC values for
diabetes risk were greater in patients aged <50 (0.684) and BMI ≥35 (0.713) compared to their
respective reference subgroups.
Conclusion:The GCT performed as well as the currently used 2hr-OGTT and FPG tests at
predicting future incidence of diabetes. Given its convenience as a non-fasting, 1-hour test, the
GCT may provide a practical and efficient approach in identifying those at risk of incident
diabetes in a clinical setting.
Introduction
Diabetes mellitus is a metabolic disorder characterized by elevated blood glucose levels.
If left uncontrolled, diabetes can lead to the development of serious health complications,
including cardiovascular disease, kidney failure, blindness and stroke [1, 2, 18]. Diabetes is a
growing health concern in the United States, with over 200,000 deaths per year, and is ranked
the 7th leading cause of death in 2013 [1]. Since 1980, the number of diabetes diagnoses in U.S.
adults has quadrupled, and 1 of 3 adults is projected to have diabetes by 2050 [1]. An estimated 8
20 | P a g e
Early detection of type 2 diabetes and prediabetes is vital to prevent or delay the
progression from prediabetes to diabetes and to ensure early interventions to prevent or reduce
the complications associated with diabetes [18, 19]. Large randomized controlled trials have
shown that early initiation of intensive treatment, using medications such as sulfonylureas,
insulin, or metformin, provides long-term reductions in risk and complications compared to later
initiation of intensive glycemic management [4-6]. The American Diabetes Association
(ADA)[12] and US Preventive Services Task Force (USPSTF)[2] have both outlined guidelines
on screening for diabetes, but it would also be in the public health interest to determine if current
methods could also predict future incidence of diabetes among the non-diabetic population.
In an observational cohort study by Phillips et al [7] the glucose challenge test
(GCTplasma), similar to that used for routine screening of gestational diabetes in pregnancy [20,
21], was evaluated as a potential screening test for type 2 diabetes and prediabetes in a
non-pregnant population. The study found that the GCTplasma was more accurate at detecting
diabetes and prediabetes than hemoglobin A1c (HbA1c), the 2-hour oral glucose tolerance test
(2hr-OGTT) and fasting plasma glucose (FPG) – all standard tests for diabetes screening and
diagnosis. In addition to identifying undiagnosed diabetes, there has also been recent interest in
identifying those individuals with particularly high risk for future development of diabetes, and
therefore the predictive ability of current screening methods to identify this subpopulation
requiring closer and screening [9-11, 22, 23].
The purpose of this study was to determine the predictive utility of the GCT to identify
incident diabetes mellitus among non-diabetic patients, compare the utility of the GCTplasma,
21 | P a g e
and to determine whether other important risk factors including age, gender, race, body mass
index, waist circumference, and lipid levels, modify the predictive utility of the GCT.
Methods
Participants
This prospective observational study included the cohort of participants in a previously
conducted diabetes screening study [24] at the Atlanta Veterans Affairs Medical Center
(VAMC). The purpose of that screening study was to compare the diagnostic utility of the GCT
against standard clinical screening methods. The participants were recruited from June 2009 to
December 2012 during primary care visits at the Atlanta VAMC. Participants were eligible if
they were 45 years or older and had a BMI greater than 25 and no current clinical diagnoses of
diabetes. Participants underwent a 50-gram 1-hour GCT and a 75-gram 2-hour OGTT. Among
the original cohort of 1535 participants, the subset identified as non-diabetic at their baseline
visit (n=1384) by OGTT, according to the ADA criteria [8], served as the study cohort for the
current study
Study Design and Measures
Data was collected from the participant’s medical records for up to 5 years following the
initial screening visit. The primary outcome of interest was incident diabetes. A new diagnosis of
diabetes was defined as: a) any use of the diabetes ICD-9 code 250.xx [25] in conjunction with a
primary care attending outpatient visit and/or b) any two uses of the ICD-9 code 250.xx or c) an
outpatient prescription of a diabetes drug.
Collected demographic information included race, gender, and age. Race was categorized
into 3 groups black, white, and other. Body mass index, waist circumference, triglycerides, high
22 | P a g e
measurements were also obtained via medical records, if available. These variables were chosen
because of their known link to increased risk of diabetes [2, 26, 27]. All 1384 participants had
complete results for the GCT, OGTT, HbA1c, and FPG. Two additional test measurements, the
1-hr OGTT glucose and GCT capillary (GCTcap) glucose, which consisted of a point-of-care
finger stick glucose measurement in place of a standard venous blood draw, were also available
for a portion of the study population. All laboratory testing were preformed using standard
VAMC equipment and protocols.
Analysis
This study analyzed the performance of GCTplasma to predict future incidence of
diabetes and compared its utility to the 2hr-OGTT, HbA1c, and FPG. Descriptive statistics were
calculated for all variables which were included in the logistic analysis models (Table 2).
Generalized estimating equations (GEE) [28] were used to model the likelihood of being
diagnosed with diabetes given the results from the GCTplasma, GCTcap, 2hr-OGTT, 1-hr
OGTT, HbA1c, and FPG. This method of analysis was chosen to account for correlation of the
data and its ability to handle missing values among the covariates. All of the participants did not
have complete follow up history throughout the 5 years, in turn, two assumptions were made
during the analysis. First, if a participant was diagnosed in a given year we assumed that
participant remained a patient with diabetes for the following years. Second, if a person did not
have a follow up visit in a given year, we assumed that a diagnosis of diabetes was not made in
that year. The predictive utility of the tests and covariates was evaluated by using receiver
operating characteristic (ROC) analysis and comparing area under receiver operating
characteristic curves (AROCs) [29]. All analyses were performed using the SAS analysis system
23 | P a g e
Results
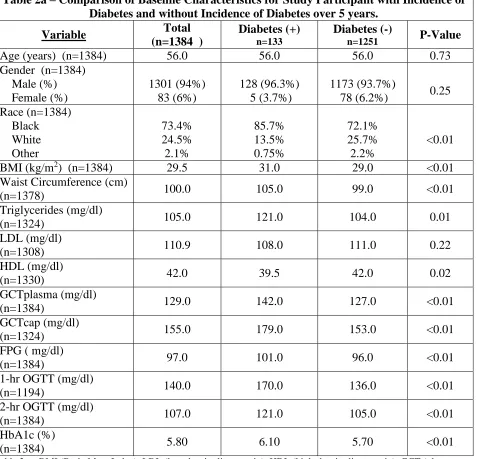
Among the cohort of 1384 participants, 94% were male, 73.4 % Black and the median
age was 56.0 years with a mean BMI and waist circumference of 29.5 kg/m2 and 100.0 cm,
respectively. Over the 5 years of follow up, 133 (9.6%) participants had incidence of diabetes.
Compared to those who remained diabetes-free, participants with incident diabetes were heavier
(1.0 kg/m2 BMI difference, p<0.01), had larger waist circumference (6.0 inches difference,
p<0.01), and higher triglyceride levels (17.00 mg/dl difference, p<0.01), (Table 2).
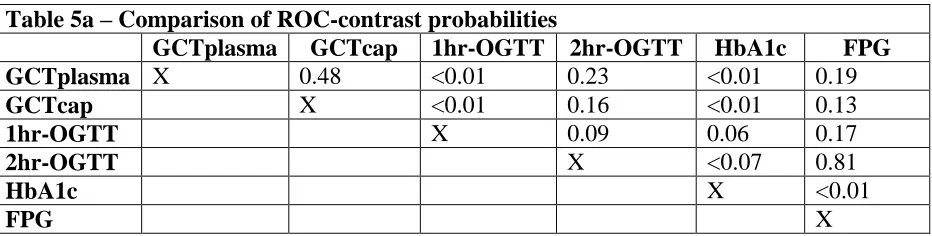
The GCTplasma, GCTcap, 1hr-OGTT, 2hr-OGTT, HbA1c and FPG were all predictors
of incident diabetes. GCTplasma produced an AROC of 0.634, the GCTcap, 1hr-OGTT,
2hr-OGTT, HbA1c, and FPG produced AROCs of 0.643, 0.691, 0.662, 0.725, and 0.657,
respectively (Table 4). Out of the 1348 participates, 1324 had GCTcap and 1194 had 1hr-OGTT
measurements. We found no statistical significant differences when comparing GCTplasma
AROC values and subsequent tests, except for HbA1c – GCTplasma and 1hr-OGTT -
GCTplasma, with an AROC difference of 0.091(p<0.01) and 0.057(p<0.01), respectively. (Table
5).
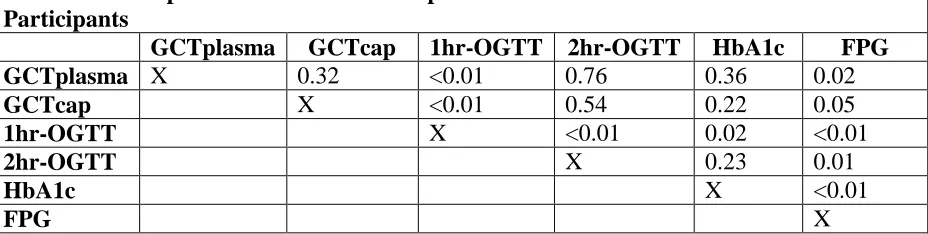
There were 746 participants who were normal glucose tolerant (NGT) at baseline, 92.6%
male, 74.9% Black, with median age, BMI, and waist circumference of 55.0 years, 29.0 kg/m2,
98.0 cm, respectively. 38 (5.1%) of those who were NGT at baseline had incidence of diabetes
over the 5 years of follow up. Compared to those that remained diabetes-free, those with
incidence of diabetes had significantly larger waist circumference (8.0 cm difference, p<0.01),
GCTplasma (13.0 mg/dl difference, p<0.01), GCTcap (30.0 mg/dl, p<0.01), 1hr-OGTT (20.0
24 | P a g e
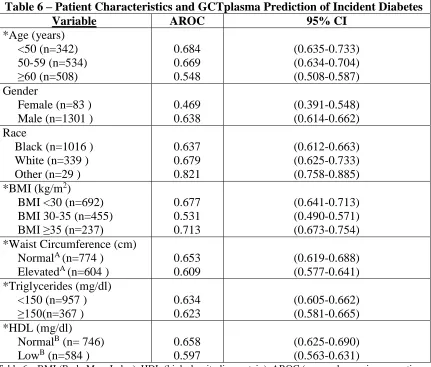
Within the subgroups of age, BMI, waist circumference and triglycerides, the average of
each subgroups AROC values mimicked that of GCTplasma (0.634). Those within subgroups
age <50 and BMI ≥35 were all found to have slightly larger AROC values in predicting diabetes
(0.684 and 0.713 respectively) (Table 6). Overall, GCTplasma predicted incident diabetes among
subgroups of risk factors.
GCTplasma’s predictive ability over time was calculated by producing AROC values for
each year of follow up. The test produced AROCs of 0.683, 0.702, 0.706, 0.699, and 0.693 for
years 1 through 5 respectively. Though a slight increase through year 3 and a marginal drop off
thereafter, the GCTplasma was consistent throughout 5 years of follow up.
Discussion
We found that the 50-gram GCT, currently used as a standard screening test for
gestational diabetes in pregnancy, may also be a good predictor of 5-year incident diabetes in the
non-pregnant population, with the 1hr post challenge glucose (GCTplasma) giving an AROC of
0.634. The only other recommended screening tests to produce a higher AROC value were
HbA1c (AROC 0.725) and 1hr-OGTT (AROC 0.691). GCTplasma performed equally well as
the 2hr-OGTT and FPG with no statistical difference between the tests. Furthermore, the
GCTplasma test has two distinct advantages over the 2hr-OGTT. First, the test can be performed
regardless of fasting conditions or time of day, and second, the GCTplasma test is administered
over 1 hour versus the 2hr-OGTT. Clinicians can administer the GCTplasma test at any time of
day and during any visit in patients with high risk of diabetes (regardless of fasting status).
Overall, the GCTcap performed equally as well as the GCTplasma, is convenient and can be
administered via a simple finger stick versus an intravenous blood draw, and is more affordable
25 | P a g e
Our results concluded that HbA1c had an AROC difference of 0.091 when compared to
GCTplasma. This can be partly attributed to the circularity that exists in the use of HbA1c in the
prediction of incident diabetes as it is also mostly commonly used in the diagnosis of diabetes.
The majority of clinicians use the HbA1c test for the diagnosis of diabetes, primarily because of
its convenience [31]. Although the OGTT is the “gold standard test”, clinicians use it less
frequently because of the time and preparation needed to administer the test. The association
between HbA1c and our outcome of interest, incident diabetes, is likely one reason we observed
a larger AROC.
Our findings are consistent with those in the literature that examined the predictive utility
of currently used diabetes diagnostic tests. In comparison a study by Adul-Ghani M. et al [9],
which also used ROC to assess the predictive ability of the OGTT, HbA1c, and FPG, our AROC
values were on average slightly smaller. Adul-Ghani M et al did have similar AROC results for
the 2hr OGTT (0.688) and FPG (0.672), while we observed a higher AROC value for HbA1c
and lower value for the 1hr OGTT. In a study by Priya et al [22] the three measures of the OGTT
(fasting, 1-hour, and 2-hour) were evaluated on their ability to predict progression to diabetes.
The AROCs for 1-hour, 2-hour, and FPG measures (0.689, 0.608, and 0.622, respectively) were
smaller than those observed in our study, while both still concluded that the 1hr-OGTT was a
better predictor. Edelman et al [10] assessed the use of HbA1c in comparison to FPG as a
predictor of future cases of diabetes. While ROC analysis was not used, they also concluded that
HbA1c is a predictor of future incidence of diabetes. Body mass index was also a statistically
significant predictor, which was supported by our findings as well.
Our study has important limitations. First our study may lack of generalizability to other
26 | P a g e
healthcare system, which may limit the extent to which of our findings are reliable for women
and other race groups. The VA Medical Center population is also subject to different risks
compared to the general public. Second, lack of complete follow-up information over the 5 years
after the initial screening was a limitation. Follow up information, including time at incident
diabetes diagnosis, was collected only for patients who presented with a new diagnosis of
diabetes during the years of follow up. Patients who either were not diagnosed with diabetes
during follow up or were lost to follow up were grouped together as having no diagnosis of
diabetes at follow up. Consequently, we could not distinguish between participants with follow
up and no diagnosis and those without follow up visit (lost to follow up) and unknown diagnosis.
Making the assumptions mentioned previously could lead to misclassification of participants and
over-estimations in our results. Ideally, the study should include follow up data for each
participant and counts of those loss to follow up to calculate a more accurate predictive value.
In conclusion, the GCTplasma and GCTcap are both useful predictors of type 2 diabetes.
Both worked as well as the gold standard OGTT and the widely used FPG. The convenience of
the GCT for patients and clinicians alike could prove beneficial in identifying those at increased
risk of developing type 2 diabetes. Additional research will need to be conducted to assess the
27 | P a g e
Tables 1-7
Table 1 – Blood Test Levels for Diagnosing Diabetes and Prediabetes
A1c FPG OGTT
Diabetes ≥ 6.5% ≥ 126 mg/dl ≥ 200 mg/dl Prediabetes 6.5% - 5.7% 125-100 mg/dl 200 – 140 mg/dl
Normal < 5.7% < 100 mg/dl < 140 mg/dl Table 1 - OGTT (oral glucose tolerance test), HbA1c (hemoglobin A1c), FPG (fasting plasma glucose).
28 | P a g e
Table 2a – Comparison of Baseline Characteristics for Study Participant with Incidence of Diabetes and without Incidence of Diabetes over 5 years.
Variable Total (n=1384 )
Diabetes (+)
n=133
Diabetes (-)
n=1251 P-Value
Age (years) (n=1384) 56.0 56.0 56.0 0.73
Gender (n=1384) Male (%) Female (%) 1301 (94%) 83 (6%) 128 (96.3%) 5 (3.7%) 1173 (93.7%)
78 (6.2%) 0.25 Race (n=1384) Black White Other 73.4% 24.5% 2.1% 85.7% 13.5% 0.75% 72.1% 25.7% 2.2% <0.01
BMI (kg/m2) (n=1384) 29.5 31.0 29.0 <0.01
Waist Circumference (cm)
(n=1378) 100.0 105.0 99.0 <0.01
Triglycerides (mg/dl)
(n=1324) 105.0 121.0 104.0 0.01
LDL (mg/dl)
(n=1308) 110.9 108.0 111.0 0.22
HDL (mg/dl)
(n=1330) 42.0 39.5 42.0 0.02
GCTplasma (mg/dl)
(n=1384) 129.0 142.0 127.0 <0.01
GCTcap (mg/dl)
(n=1324) 155.0 179.0 153.0 <0.01
FPG ( mg/dl)
(n=1384) 97.0 101.0 96.0 <0.01
1-hr OGTT (mg/dl)
(n=1194) 140.0 170.0 136.0 <0.01
2-hr OGTT (mg/dl)
(n=1384) 107.0 121.0 105.0 <0.01
HbA1c (%)
[image:29.612.78.555.80.539.2](n=1384) 5.80 6.10 5.70 <0.01
29 | P a g e
Table 2b – Comparison of Baseline Characteristics for Normal Glucose Tolerant Participants with Incidence of Diabetes and without Incidence of Diabetes over 5 years
Variable Total
(n=746 )
Diabetes (+)
(n=38)
Diabetes (-)
(n=708) P-Value
Age (years)
(n=746) 55.0 55.5 55.0 0.59
Gender (n=746) Male (%) Female (%) 691 (92.6%) 55 (7.4%) 36 (94.7%) 2 (5.3%) 655 (92.5%) 53 (7.5%) 0.61 Race (n=746) Black White Other 74.9% 22.8% 2.3% 33 (86.8%) 5 (13.2%) 0 74.3% 23.3% 2.4% 0.19
BMI (kg/m2) (n=746) 29.0 30.5 29.0 0.23
Waist Circumference (cm)
(n=741) 98.0 105.0 97.0 0.02
Triglycerides (mg/dl)
(n=707) 99.0 119.0 98.0 0.09
LDL (mg/dl)
(n=698) 113.1 103.0 113.6 0.15
HDL (mg/dl)
(n=707) 43.0 40.0 43.0 0.13
GCTplasma (mg/dl)
(n=746) 120.0 132.0 119.0 <0.01
GCTcap (mg/dl)
(n=720) 147.5 177.0 147.0 <0.01
FPG ( mg/dl)
(n=746) 91.0 92.0 91.0 0.17
1hr OGTT (mg/dl)
(n=653) 126.0 146.0 126.0 <0.01
2hr OGTT(mg/dl)
(n=746) 97.0 107.0 96.0 0.17
HbA1c (%)
[image:30.612.71.549.77.552.2](n=746) 5.70 5.90 5.70 <0.01
30 | P a g e
Table 3 – Baseline Demographics and Characteristics of Study Participants stratified by diagnoses in each year of follow up
Variable Year 1 (n=66) Year 2 (n=26) Year 3 (n=25) Year 4 (n=8) Year 5 (n=8)
Age (years) 56.7 56.5 55.4 57.6 49.4
Gender Male (%) Female (%) 63 (95.5%) 3 (4.5%) 25 (96.2%) 1 (3.8%) 24 (96.0%) 1(4.0%) 8 (100%) 0 8 (100%) 0 Race Black (%) White (%) Other (%) 83.3% 15.2% 1.5% 92.3% 7.7% 0 88% 12% 0 62.5% 37.5% 0 100% 0 0
BMI (kg/m2) 31.5 32.4 30.4 31.0 31.5
Waist Circumference (cm)
(n=1378) 105.1 106.6 100.9 103.4 104.5
Triglycerides (mg/dl)
(n=1324) 153.2 132.2 135.9 151.1 142.1
LDL (mg/dl)
(n=1308) 104.5 109.1 118.8 105.4 118.6
HDL (mg/dl)
(n=1330) 40.7 41.8 40.3 37.1 41.7
GCTplasma (mg/dl) 149.2 150.2 152.2 136.0 124.9
FPG ( mg/dl) 102.9 103.0 99.2 99.0 105.0
2-hr OGTT(mg/dl) 131.7 116.6 121.5 106.0 93.8
[image:31.612.74.543.80.427.2]HbA1c (%) 6.1 6.2 6.1 5.9 6.0
31 | P a g e
Table 4-Comparison of Sensitivity, Specificity and AROC by Test: All Participants
AROC 95% CI
GCTplasma 0.634 (0.609-0.657)
GCTcap 0.643 (0.617-0.668)
1-hr OGTT 0.691 (0.665-0.717)
2-hr OGTT 0.662 (0.637-0.688)
HbA1c 0.725 (0.699-0.750)
FPG 0.657 (0.632-0.682)
Comparison of Sensitivity, Specificity and AROC by Test: Normal Glucose Tolerant Participants
GCTplasma 0.661 (0.609-0.713)
GCTcap 0.685 (0.629-0.741)
1-hr OGTT 0.655 (0.604-0.706)
2-hr OGTT 0.612 (0.561-0.663)
HbA1c 0.731 (0.685-0.776)
FPG 0.563 (0.517-0.609)
Table 4 – GCTplasma (glucose challenge test plasma), GCTcap (glucose challenge test capillary), OGTT (oral glucose tolerance test), HbA1c (hemoglobin A1c), FPG (fasting plasma glucose), AROC (area under receiver operating characteristic curve).
32 | P a g e
Table 5a – Comparison of ROC-contrast probabilities
GCTplasma GCTcap 1hr-OGTT 2hr-OGTT HbA1c FPG GCTplasma X 0.48 <0.01 0.23 <0.01 0.19
GCTcap X <0.01 0.16 <0.01 0.13
1hr-OGTT X 0.09 0.06 0.17
2hr-OGTT X <0.07 0.81
HbA1c X <0.01
FPG X
33 | P a g e
Table 5b – Comparison of ROC-contrast probabilities: Normal Glucose Tolerant Participants
GCTplasma GCTcap 1hr-OGTT 2hr-OGTT HbA1c FPG GCTplasma X 0.32 <0.01 0.76 0.36 0.02
GCTcap X <0.01 0.54 0.22 0.05
1hr-OGTT X <0.01 0.02 <0.01
2hr-OGTT X 0.23 0.01
HbA1c X <0.01
FPG X
34 | P a g e
Table 6 – Patient Characteristics and GCTplasma Prediction of Incident Diabetes Variable AROC 95% CI
*Age (years) <50 (n=342) 50-59 (n=534) ≥60 (n=508) 0.684 0.669 0.548 (0.635-0.733) (0.634-0.704) (0.508-0.587) Gender
Female (n=83 ) Male (n=1301 )
0.469 0.638
(0.391-0.548) (0.614-0.662) Race
Black (n=1016 ) White (n=339 ) Other (n=29 )
0.637 0.679 0.821 (0.612-0.663) (0.625-0.733) (0.758-0.885) *BMI (kg/m2)
BMI <30 (n=692) BMI 30-35 (n=455) BMI ≥35 (n=237)
0.677 0.531 0.713 (0.641-0.713) (0.490-0.571) (0.673-0.754) *Waist Circumference (cm)
NormalA (n=774 ) ElevatedA (n=604 )
0.653 0.609
(0.619-0.688) (0.577-0.641) *Triglycerides (mg/dl)
<150 (n=957 ) ≥150(n=367 ) 0.634 0.623 (0.605-0.662) (0.581-0.665) *HDL (mg/dl)
NormalB (n= 746) LowB (n=584 )
0.658 0.597
(0.625-0.690) (0.563-0.631)
Table 6 – BMI (Body Mass Index), HDL (high-density lipoprotein), AROC (area under receiver operating characteristics curve).
*Stratified according to NCEP metabolic syndrome criteria [32]
35 | P a g e
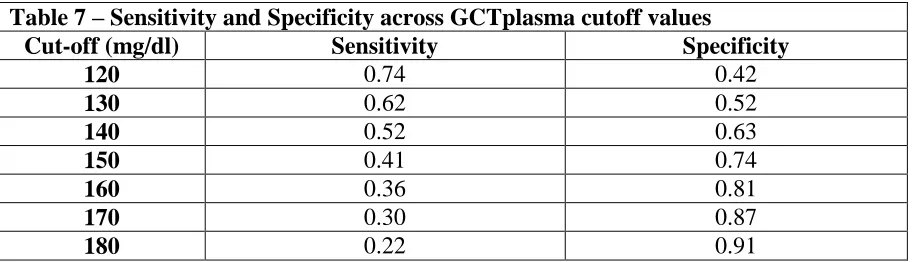
Table 7 – Sensitivity and Specificity across GCTplasma cutoff values
Cut-off (mg/dl) Sensitivity Specificity
120 0.74 0.42
130 0.62 0.52
140 0.52 0.63
150 0.41 0.74
160 0.36 0.81
170 0.30 0.87
180 0.22 0.91
36 | P a g e
References
1. Centers for Disease Control and Prevention, National Diabetes Statistics Report: Estimates of Dabetes and Its Burden in the United States, 2014. Atlanta, GA: US Department of Health and Human Services 2014. 2. Selph, S., et al., Screening for Abnormal Glucose and Type 2 Diabetes Mellitus: A Systematic Review to Update the
2008 U.S. Preventive Services Task Force Recommendation. Rockville,MD: Agency for Healthcare Research and Quality, 2015.
3. The Diabetes Control and Complications Trial Research Group, The effect of intensive treatment of diabetes on the development and progression of long-term complications in insulin-dependent diabetes mellitus. The Diabetes Control and Complications Trial Research Group. N Engl J Med, 1993. 329(14): p. 977-86.
4. UKPDS, Intensive blood-glucose control with sulphonylureas or insulin compared with conventional treatment and risk of complications in patients with type 2 diabetes (UKPDS 33). UK Prospective Diabetes Study (UKPDS) Group. Lancet, 1998. 352(9131): p. 837-53.
5. Holman, R.R., et al., 10-year follow-up of intensive glucose control in type 2 diabetes. N Engl J Med, 2008. 359(15): p. 1577-89.
6. Nathan, D.M., et al., Diabetes control and complications trial/epidemiology of diabetes interventions and complications study at 30 years: advances and contributions. Diabetes, 2013. 62(12): p. 3976-86.
7. Phillips, L.S., et al., Glucose challenge test screening for prediabetes and undiagnosed diabetes. Diabetologia, 2009. 52(9): p. 1798-807.
8. American Diabetes Association, Diagnosing Diabetes and Learning about Prediabetes. 2015.
9. Abdul-Ghani, M.A., et al., Fasting versus postload plasma glucose concentration and the risk for future type 2 diabetes: results from the Botnia Study. Diabetes Care, 2009. 32(2): p. 281-6.
10. Edelman, D., et al., Utility of hemoglobin A1c in predicting diabetes risk. J Gen Intern Med, 2004. 19(12): p. 1175-80.
11. Fiorentino, T.V., et al., One-hour post-load hyperglycemia is a stronger predictor of type 2 diabetes than impaired fasting glucose. J Clin Endocrinol Metab, 2015: p. jc20152573.
12. American Diabetes Association, Classification and diagnosis of diabetes mellitus. Diabetes Care 2015, 2015. 38 (Suppl. 1): p. S8-S16.
13. Bonora, E. and J. Tuomilehto, The pros and cons of diagnosing diabetes with A1C. Diabetes Care, 2011. 34 Suppl 2: p. S184-90.
14. Lorenzo, C., et al., A1C between 5.7 and 6.4% as a marker for identifying pre-diabetes, insulin sensitivity and secretion, and cardiovascular risk factors: the Insulin Resistance Atherosclerosis Study (IRAS). Diabetes Care, 2010. 33(9): p. 2104-9.
15. Zhou, X., et al., Performance of an A1C and fasting capillary blood glucose test for screening newly diagnosed diabetes and pre-diabetes defined by an oral glucose tolerance test in Qingdao, China. Diabetes Care, 2010. 33(3): p. 545-50.
16. Lorenzo, C., et al., The metabolic syndrome as predictor of type 2 diabetes: the San Antonio heart study. Diabetes Care, 2003. 26(11): p. 3153-9.
17. Pani, L.N., et al., Effect of aging on A1C levels in individuals without diabetes: evidence from the Framingham Offspring Study and the National Health and Nutrition Examination Survey 2001-2004. Diabetes Care, 2008. 31(10): p. 1991-6.
18. National Institute of Diabetes and Digestive and Kidney Diseases, Am I at Risk for Type 2 Diabetes? Taking steps to lowere your risk of getting diabetes. 2012.
19. Harris, M.I.E., R.C, Early detection of undiagnosed diabetes mellitus: a US perspective. Diabetes Metabolism Research and Reviews, 2000. 16(4): p. 230-236.
20. Hillier TA, V.K., Whitlock EP, et al., Screening for Gestational Diabetes Mellitus [Internet]. 2008, Rockville (MD): Agency for Healthcare Research and Quality (US).
37 | P a g e
22. Priya, M., et al., 1-hour venous plasma glucose and incident prediabetes and diabetes in Asian indians. Diabetes Technol Ther, 2013. 15(6): p. 497-502.
23. Alyass, A., et al., Modelling of OGTT curve identifies 1 h plasma glucose level as a strong predictor of incident type 2 diabetes: results from two prospective cohorts. Diabetologia, 2015. 58(1): p. 87-97.
24. Jackson, S., Glucose challenge test screening for prediabetes and early diabetes. Unpublished 2015. 25. Centers for Medicare and Medicaid Services, ICD-9 Codes included in Range 250.00 - 250.93.
26. National Institute of Health, Insulin Resistance and Prediabetes. 2014.
27. Balkau, B., et al., Prescreening tools for diabetes and obesity-associated dyslipidaemia: comparing BMI, waist and waist hip ratio. The D.E.S.I.R. Study. Eur J Clin Nutr, 2006. 60(3): p. 295-304.
28. Hanley, J.A., et al., Statistical analysis of correlated data using generalized estimating equations: an orientation. Am J Epidemiol, 2003. 157(4): p. 364-75.
29. Kumar, R. and A. Indrayan, Receiver operating characteristic (ROC) curve for medical researchers. Indian Pediatr, 2011. 48(4): p. 277-87.
30. Meriggi, E., et al., Capillary glucose determination in the screening of gestational diabetes. Diabetes Res Clin Pract, 1988. 5(1): p. 55-61.
31. Saudek, C.D., et al., A new look at screening and diagnosing diabetes mellitus. J Clin Endocrinol Metab, 2008. 93(7): p. 2447-53.