ISSN 2250-3153
Effect of Different Tillage Practices on the Performance
of Potato (Solanum tuberosum) on the Jos Plateau
Yaroson, A. Y., Henry, U. I., Adeniyi, T. O., *Ibrahim, Iro, I., and Adam, D.
Crop Production Technology Department Federal College of Forestry, Jos, Plateau State, Nigeria.
DOI: 10.29322/IJSRP.9.02.2019.p8679 http://dx.doi.org/10.29322/IJSRP.9.02.2019.p8679
ABSTRACT
This research work was carried out at the experimental plot of Federal College of Forestry, Jos, Plateau, State, Nigeria. The experiment was laid out in a randomized complete block design (RCBD) comprising of four treatments; T0 as the Control (Ridges tillage), T1 (Zero-Tillage), T2 (Mound tillage) and T3 (Flat tillage) replicated three times. Data was recorded on leaf area, plant height, leaf cover area, number of stems, number of leaves and yield. The result showed that the treatments had significant effect on plant height T3 (Flat tillage) having the highest (34cm) mean plant height, while T1 (Zero tillage) has the least (26cm) mean plant height. Number of stem T3 (Flat tillage) also having the highest (14.8) number of stem while T1 (Zero tillage) has the least (9.7) number of stem. Number of leaves T3 (Flat tillage) also having the highest (289) number of leaves while T1 (Zero tillage) has the least (215) number of leaves. Leaf area T3 (Flat tillage) also having the highest (645.1cm2) of leaf area while T1 (Zero tillage) has the least (467.1cm2) leaf area. Plant cover area T3 (Flat tillage) having the highest (4503.3cm2) plant cover area while T1 (Zero tillage) has the least (2147.0cm2) plant cover area. For yield, T0 (ridges tillage) having the highest (8.6Kg) yield, followed by T2 (mound tillage), T3 (Flat tillage) and T1 (Zero tillage) which has the lowest (4.7Kg) yield. It can be concluded that ridges as the form of tillage could be the best practice for the growth and yield of Solanum tuberosum on the Jos Plateau.
Keywords: Tillage, Potato, Solanum tuberosum, Performance
INTRODUCTION
Potato (Solanum tuberosum) is one of the major crops contributing to food requirement of the world. In 160 nations around the world, it is considered the most popular salad crops. Topping the list of tuber crops, in terms of quantity of production, it occupies wide importance in the food program of the states. Currently, the potato is the fourth most important food around the world after maize, wheat and rice, with a production of 364.8 million tonnes (Djilani et al; 2015). Potato prefers cooler weather, but they will grow in almost any conditions. There are literally thousands of different varieties of potatoes grown around the world. Potatoes are seasonal and are usually harvested depending on the variety. They are the swollen portion of the underground stem which is called a tuber and is designed to provide food for the green leafy portion of the plant (Kumar et al; 2012).
ISSN 2250-3153
Farmers employ different tillage practices in the production of the crop. While some farmers plant potato after disc ploughing without disc harrowing, other farmers disc plough and disc harrowing before planting. There are some farmers who disc harrow without disc ploughing before planting. Some farmers “slash and burn” while others use on tillage before planting potato. Many farmers perform tillage operations without being aware of the effect of these operations on soil physical properties and crop responses. (Ozpinar and Isik, 2004). Tillage is one of the important processes in agriculture. It is carried out mainly to loosen the upper layer of soil, to mix the soil with fertilizer and organic residues, to control weeds and to create a suitable seedbed for germination and plant growth (Rasmussen, 1999).
According to (Srivastava et al., 2006), the objectives of tillage are to develop a desirable soils structure or suitable tilt for a seedbed. Tillage is crucial for crop establishment, growth and ultimately yield. (Atkinson et al., 2007). A good soil management programme protects the soil from water and wind erosion, provides a good, weed-free seedbed for planting, destroys hardpans or compacted layers that may limit root development, and allows maintenance or even an increase of organic matter (Wright et al., 2008). One of the most common agricultural practices is soil cultivation which is commonly centred on conventional deep tillage (that is ploughing up to 30cm). Over time, this may result in a decline of soil organic matter and inherent soil fertility in the top soil along with increased risk of soil erosion. (Daccache et al., 2012). However, conventional tillage is considered necessary in order to manage crop residues, prepare a suitable seedbed and create favourable soil physical properties for germination and crop production, while also providing effective weed control. (Grant and Epstein, 1973). On the other hand, conservation tillage is a broad term which refers to a wide range of non-inversion tillage practices which have the potential to reduce soil degradation and preserve soil quality (Magagula et al., 2010).
The detrimental effects of tillage are as important as it advantages. It loosens and aerates the top layer of soil which can facilitate the planting of the crops, it is a mechanical way of destroying weeds and also help in the mixing of residue from the harvest, organic matter (humus) and nutrients evenly throughout the soil. Some of the disadvantages are: it dries the soil before seeding, erosion of soil, higher rate of fertilizer and chemical run off, decreases the water infiltration rate of soil, destroys soil aggregates, compaction of the soil also known as a tillage pan, crop diseases can be harboured in surface residues can attracts slugs, cut worms, army warms and other harmful insects to the left over residues, the soil also looses a lots of its nutrients like Carbon, Nitrogen, and its ability to store water. It does not help in the top soil through erosion, it enhanced due to tillage as it remains in loose. (FAO, 2012). The broad objective of this study was to determine the effect of different tillage practices on the performance of potato on the Jos, Plateau.
MATERIALS AND METHOD Study Area
The research was carried out at the experimental plot of Federal College of Forestry, Jos, Plateau State, Nigeria, located in southern Guinea Savannah situated at 90 55’ North latitude and 80 54’ East longitude. It has an average elevation of about 1.250m above sea level and stands at a height of about 600m above the surrounding plain. The average temperature ranges between 210C to 250C. The climate of the state was cool due to its high latitude. Rainy season was usually between April to September while dry season from October to March. The mean annual rainfall was 1260m (Olowolafe et al., 2004).
Experimental Design
The experiment was laid out in a randomized complete block design (RCBD) comprising of four treatments (T0 = Control (Ridges tillage), T1 = Zero-Tillage, T2 = Mound tillage, T3 = Flat tillage) replicated three times.
ISSN 2250-3153
iii. Number of Leaves: The leaves were counted per plant then per plot. iv. Number of Stems: The stems were counted per plant then per plot
v. Plants Cover Area (Girth Area):The plant cover area was gotten by multiplying the leaf area by the plant spacing. vi. Tuber Weight: This was done by weighing the potato tuber using a weighing balance
Results and Discussions Plant Height
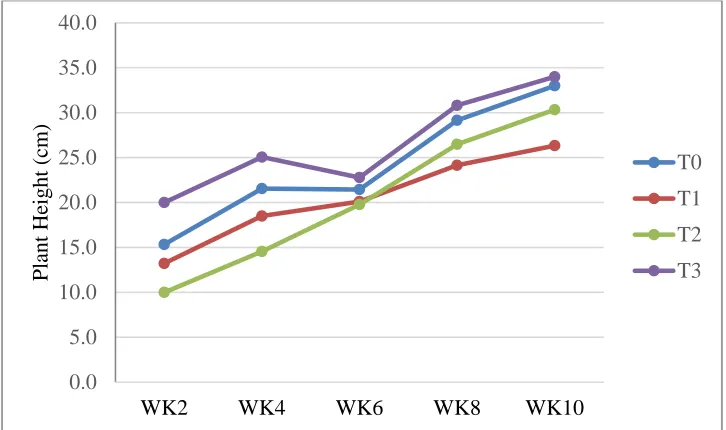
[image:3.612.125.488.266.481.2]The result from figure 1 indicates that at WK2 the mean plant height for T3 is 20.0cm, 15.3cm for T0, 13.2cm for T1 and T2 with 10.0cm. This showed that T3 has the highest mean plant height. At WK4, the mean plant height for T3 was 25.1cm, 21.6cm for T0, 18.5cm for T1 and 14.6cm for T2. The highest mean plant height was obtained at T3.Also, at WK6 the result showed that T3 has a mean plant height of 22.8cm, T0 has 21.4cm, 20.1cmfor T1, and 18.8cm for T2. This indicated that the highest mean plant height was obtained at T3. Furthermore, the mean plant height at WK8 for T3 was 30.8cm, 29.1cm for T0, 26.5cm for T2, and 24.1cm for T1. This revealed that T3 has the highest meant plant height.T3 also recorded a mean plant height of `34.0cm at WK10, 33.0cm for T0, 30.3 for T2 and 26.3cm for T1. This showed that T3 recorded the highest mean of plant height.
Figure 1: Effect of Different Tillage Practices On the Plant Height of Potato
Number of Stem
The result from figure 2 showed that the mean number of stem at WK2 for T0 is 2.0cm, 1.9cm for T3, 1.7cm for T2, and 1.2cm for T1. This showed that T0 had the highest mean number of stem. At WK4 the mean number of stem for T3 is 4.3cm, 4.2cm for T0, T2 and T1 has 4.1cm and 2.9cm respectively, showing the highest mean number of stem at T3.The mean number of stem at WK6 for T3 is 5.9cm, its 5.8cm for T0, 5.3cm for T1 and 4.8cm for T2. This reveals that T3 has the highest number of stem at 6WAP. T3 has a mean number of stem of 14.8cm at WK8, 13.7cm for T0, T1 has 11.2cm and T2 has 11.1cm showing T3 having the highest mean number of stem. The result also showed that T3 has a mean number of stem of 14.9cm at WK10, T0 has 11.4cm, 9.7cm for T1 and T2 respectively. The highest mean number of stem is at T3.
0.0 5.0 10.0 15.0 20.0 25.0 30.0 35.0 40.0
WK2 WK4 WK6 WK8 WK10
Pla
n
t
H
eig
h
t (
cm
)
T0
T1
T2
ISSN 2250-3153
Figure 2: Effect of Different Tillage Practices On the Number of Stems of Potato
Number of Leaves
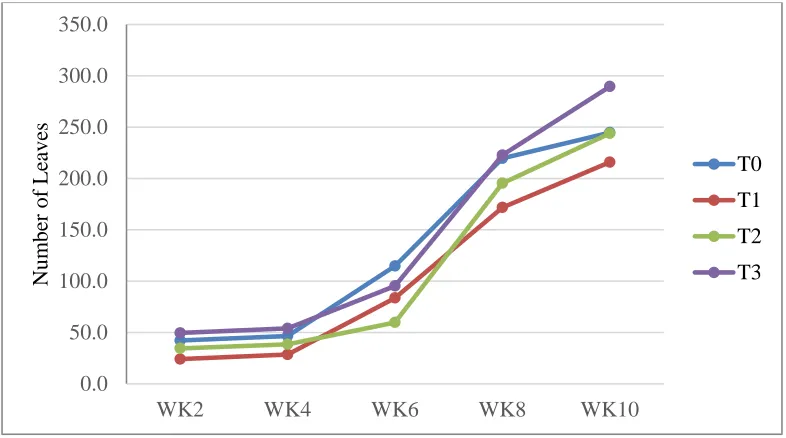
The result from figure 3 reveals that the mean number of leaves at WK2 is 49.6 for T3, T0 has 42.2 leaves, T2 and T1 have 34.6 and 24.1 leaves respectively. The result showed T3 is having the highest mean number of leaves. At WK4 the mean number of leaves for T3 is 54.0, 46.6 for T0, 38.6 for T2 and 28.6 for T1. It showed that T3 is having the highest mean number of leaves at 4WAP. The result at WK6 showed a mean number of leaves of 114.8 for T0, 95.3 for T3, 83.7 for T2, and 59.8 for T2 indicating T1 having the highest mean leaf count. Also, at WK8 the mean number of leaves for T3 is 222.8, T1 is having 219.6, 195.4 and 171.8 for T2 and T1 respectively. This indicated that T3 had the highest mean leaf count. The result from WK10 revealed that T3 had a mean number of leaves of 289.6, T1 is having 244.7 T2 and T1 with 243.9 and 215.9 respectively indicating highest recorded at T3.
0.0 2.0 4.0 6.0 8.0 10.0 12.0 14.0 16.0
WK2 WK4 WK6 WK8 WK10
Nu
m
b
er
o
f S
tem T0
T1
T2
T3
0.0 50.0 100.0 150.0 200.0 250.0 300.0 350.0
WK2 WK4 WK6 WK8 WK10
Nu
m
b
er
o
f L
eav
es
T0
T1
T2
[image:4.612.110.503.430.649.2]ISSN 2250-3153
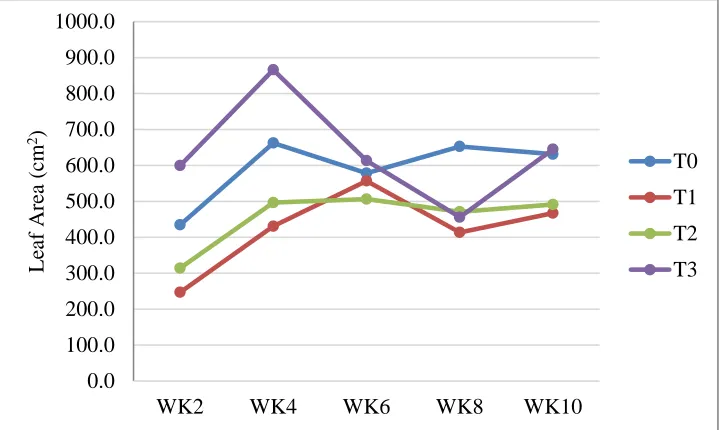
[image:5.612.127.488.144.359.2]area for T3 was 866.0cm2, 662.3cm2 for T0, 496.6cm2 for T2 and 430.9cm2 for T1. It showed that T3 is having the highest mean number of leaves at 4WAP. The result at WK6 showed a mean leaf area of 613.3cm2 for T3, 578.6cm2 for T0, 556.9cm2 for T1, and 506.2cm2 for T2 indicating T3 having the highest mean leaf area. Also, at WK8 the mean leaf area for T1 is 652.7cm2, T2 is having 471.0cm2, 455.9cm2 and 413.6cm2 for T2 and T1 respectively. This indicated that T3 has the highest mean leaf count. The result from WK10 reveals that T3 had a mean leaf area of 645.1cm2, T1 was having 631.2cm2 T2 and T1 with 491.3cm2 and 467.1cm2 respectively indicated highest recorded at T3.
Figure 4: Effect of Different Tillage Practices On the Leaf Area of Potato
Plant Cover Area
The result from figure 5 showed that the mean plant cover area at WK2 for T3 was 480.6cm2, 404.6cm2 for T0, 288.4cm2 for T2 and 275.2cm2 for T1. This showed that T3 had the highest mean number of stem. At WK4 the mean plant cover area for T3 is 808.0cm2, 622.3cm2 for T0, T2 and T1 had 468.6cm2 and 454.1cm2 respectively, showing the highest mean number of stem at T3.The mean plant cover area at WK6 for T0 is 623.0cm2, it’s 513.9cm2 for T3, 458.3cm2 for T1 and 391.4cm2 for T2. This revealed that T0 had the highest plant cover area at 6WAP. T3 has a mean plant cover area of 3984.1cm2 at WK8, 2705.9cm2 for T0, T2 has 2212.1cm2 and T1 has 1358.1cm2 showing T3 having the highest mean plant cover area. The result also showed that T3 has a mean plant cover area of 4503.3cm2 at WK10, T0 had 2818.7cm2, 2147.0cm2 and 1592.0cm2 for T2 and T1 respectively. The highest mean plant cover area at T3.
0.0 100.0 200.0 300.0 400.0 500.0 600.0 700.0 800.0 900.0 1000.0
WK2 WK4 WK6 WK8 WK10
L
eaf
Ar
ea (
cm
2)
T0
T1
T2
ISSN 2250-3153
Figure 5: Effect of Different Tillage Practices On Plant Cover Area of Potato
Yield
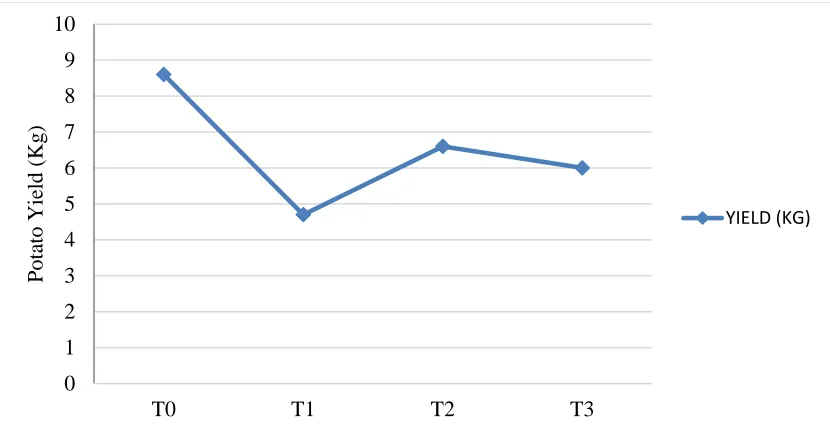
The result form figure 6 indicated that the mean yield for T0 was 8.6Kg, T2 has 6.6Kg, T3 has 6.0Kg, and T1 has 4.7Kg. This showed that T0 has the highest yield.
Figure 6: Effect of Different Tillage Practices On Plant Cover Area of Potato
DISCUSSION
0.0 500.0 1000.0 1500.0 2000.0 2500.0 3000.0 3500.0 4000.0 4500.0 5000.0
WK2 WK4 WK6 WK8 WK10
P
lan
t C
o
v
er
Ar
ea
(cm
2)
T0
T1
T2
T3
0 1 2 3 4 5 6 7 8 9 10
T0 T1 T2 T3
Po
ta
to
Y
ie
ld
(
K
g
)
[image:6.612.99.514.364.580.2]ISSN 2250-3153
Afuakwa (2010) also reported taller cowpea plants in the tilled plots compared that of the no tillage plots. In contrasts, Ojeniyi and Adekayode (1999) reported taller maize plants in the no tillage plots in comparison with that of the tilled plots except for that in the ploughing followed by harrowing plus ridging plots on sandy clay loam soil (Ferric luvisol) at Akure, located in the rain forest zone of Nigeria.
The number of stem shows no significant difference between the treatments with flat tillage practices having the highest number of stem while zero tillage practices has the least number of stem. This result is similar to (square, 1990). Number of stem is an expression of vegetative growth, the result of the effect tillage practices on Akposoe potato stem. At 10 weeks after planting there was no significant difference in number of stem between the different tillage practices.
Number of leaves, the number of leaves show there is no significant difference between the treatments of flat tillage practices having the highest number of leaves while zero tillage has the least number of leaves. Leaves are the site of photosynthetic activities of crops through which biomass are produced, portioned among various parts of crops and stored for crop productivity (Asare et al., 2011).
Leaf area, the result reveal significant difference between the treatments with flat tillage practices having the highest leaf area while zero tillage practices has the least leaf area. Potato leaf area is importance to photosynthesis and yield. The photosynthetic capacity of crops is a function of leaf area. Leaf area is important for crop light interception and therefore has a large influence on crop yield (Dwyer and Stewart, 1986).
Plant cover area, the result show significant difference between the treatment with flat tillage practices having the highest plant cover area while zero tillage practices has the least plant cover area. Thisa result is contrast with (Dwyer and Stewart, 1986). The effect of tillage practices on Akposoe potato plant cover area over the course of study. There was no significant difference of tillage practices, who observed the highest plant cover area on ridges tillage practices while zero tillage has the least plant cover area.
Yield, the result of yield above indicates that the mean yield for T0 is 8.6kg, T2 has 6.6kg, T3 has 6.0kg, T1 has 4.7kg. This shows that T0 has the highest yield. Maximum and minimum of crop yield was related to T3 and T4 respectively. Similar results reported by other researchers (Dickey et al., 1994; Eshaqbeigi, 2009). Due to frost, yield was lower than the real means; yields were corrected in all treatments.
Conclusion
Based on the research study conducted the result showed that the treatment had significant effect on plant height T3 (Flat tillage) having the highest plant height, while T1 (Zero tillage) has the least plant height. Number of stem T3 (Flat tillage) also having the highest number of stem while T1 (Zero tillage) has the least number of stem. Number of leaves T3 (Flat tillage) also having the highest number of leaves while T1 (Zero tillage) has the least number of leaves. Leaf area T3 (Flat tillage) also having the highest of leaf area while T1 (Zero tillage) has the least leaf area. Plant cover area T3 (Flat tillage) having the highest plant cover area while T1 (Zero tillage) has the least plant cover area. For yield, T0 (ridges tillage) having the highest yield, followed by T2 (mound tillage), T3 (Flat tillage) and T1 (Zero tillage) which has the lowest yield. It can be concluded that ridges tillage could be the best tillage for the growth and yield of Solanum tuberosum on the Jos Plateau.
REFERENCE
Atkinson, H.S., Sparkes, D.L and Mooney, S.J (2007). Using selected physical properties of seedbeds to predict crop establishment, soil and tillage research. 97(2): 218-228.
Daccache, A.C.,Keay; R.J.A., Jones; E.K. Weatherhead M.A., Stalham J.W. Knox.,(2012). “Climate change and land suitability for potato production in England and Wales: impacts and adaptation”. Journal of Agricultural science, 150:pp 161 – 177. Doi : 10.1017/s 0021859611000839.
ISSN 2250-3153
Ensminger, Audrey; Esminger, M.E; Konlande James E. (1994).Foods and Nutrition Encyclopedia.CTC press. ISBN 0 – 8493 – 8981 – X
FAO (2012). ‘Quality declared planting material: Protocols and Standards for vegetatively propagated crops FAO. Plant protection paper number 195. Food and agricultural organization of the United State Nationas, Rome, Italy. ISSN 0259 – 2517.
FAO.(2010). Quality declared planting material: Protocols and Standard for vegetatively propagated crops. FAO plant protection and protection paper number 195. Food and Agricultural organization of the United Nations, Rome, Italy. ISSN 0259 – 2517.
FAOSTAT.“Potato production in (2014).Region/World/Production Quality/Crops from pick lists” UN Food and Agriculture Organization, Statistics Division (FAOSTAT).(2016). Retrieved 6 May 2017.
Fengyi, W.,(2008).The importance of quality potato seed in increasing potato production in Asia and the Pacific region. In proceedings of workshop to commemorate the international year of potato – 2008. Bangkok, Thailand, 6 May 2008. pp. 46 – 47
Grant M. Campbell; Colin Webb; Stephen L. McKee (1997). Cereals: Novel uses and
Kumar, M., Baishya, L.K., Anup, Das and Patel, D.P.,(2012).productivity and soil health of potato (Solanum tuberosum L.). Field as influenced by organic manures, inorganic fertilizers and Biofertilizers under high Altitudes of Eastern Himalayas, Journal of Agricultural science. 4(5): 2012.
Magagula. N.E.M., Ossom, E.M., Rhykerd and Rhykerd(2010).Effect of Chicken manure on soil properties under sweet potato [Ipomoea batatas (L.) Lam] Culture in Swaziland. American – Eurasian Journal of Agronomy; 1995 – 896X.
Olowolafe, E.A., Adepetu, A.A., Dung, J. E. and Osagbemi, M.O. (2004). Effect of application of different levels of nitrogen and phosphorus fertilizer on upland rice yield on the jos plateau. Nigeria. Journal of environment Sciences 6:39-45.
Ozipinar, S. And Isik, A. (2004). Effects of different tillage, ridging and row spacing on seedling emergence and yield of cotton, Soiland Tillage Research. 75 (1): 19 – 26.
Rasmussen, K.J. (1999). Impact of ploughless oil tillage on yield and soil quality: A Scandinavian review, Soil and Tillage Research. 53(1): 3 – 14.
Saha, S., Mina, B.L., Gopinath, K.A., Kundu, S., Gupta, H.S.,(2008). Organic amendments affect biochemical properties of a sub – temperature soil of the Indian Himalayas. Nutr.Cycl.Agroecosyst., 80,pp 233 – 242.
Tony Winch,(2006). Growing Food: A Guide to Food Production. Springer Science + Business Media.ISBN 1 – 4020 – 6624 – 4.