FLOW CONTROL IN S-SHAPED AGGRESSIVE DIFFUSER USING
GROOVES ON THE INNER AND OUTER SURFACES
Raed A. Jessam, Hussain H. Al-Kayiem and Mohammad S. Nasif
Mechanical Engineering Department, Universiti Teknologi Petronas, Bandar Seri Iskandar, Perak, Malaysia
E-Mail: [email protected]
ABSTRACT
This paper presents CFD simulation results for S-shaped aggressive diffuser to establish grooves effectiveness in improving the flow patterns. Grooves have been proposed perpendicular to the flow direction in different planes along the aggressive diffuser. The simulated flow field was generated within a normal S-shaped diffuser with curvature of 45°/45°, and then simulated for aggressive diffuser with 30o/30o by reducing the total length by 22%. CFD simulation was performed, under 3D assumption, on both normal and aggressive diffusers, as well as with and without grooves, through ANSYS-FLUENT 16.2 software. The renormalized group k–ε model was used to simulate the turbulence. The simulation results were validated and were consistent with the findings of previous experimental and numerical studies. Results obtained in the current study indicated that the combination of grooves could effectively control the flow distortion in S-shaped aggressive diffusers. Predicted performance parameters, such as the coefficients of static pressure recovery and total pressure loss, suggested that the performance of the grooves was able to enhance the pressure recovery by 18.2% and total loss coefficient was reduced by 5.75% in comparison with the case of aggressive diffuser without grooves.
Keywords: CFD, grooves, flow control, separation control, S-shaped aggressive diffuser, turbulence models.
INTRODUCTION
Intake is an important component of air breathing engines, and the pressure recovery and efficiency of this component strongly affect engine performance. Among the most commonly applied types of intakes is the S-shaped diffuser, which guides air from around a plane body to the engine inlet [1]. S-shaped diffusers have centerline curvatures and cross-sectional areas that increase along the flow direction. Owing to this centerline curvature, cross-stream pressure gradients build up and increase secondary flows. This phenomenon creates cross-flow velocities within the boundary layer that generate a non-uniform pressure profile at the engine face; this profile is called the aerodynamic inlet plane (AIP). In addition, the adverse streamwise pressure gradient caused by the increasing cross-sectional area can also lead to flow separation. To achieve acceptable performance, an S-shaped diffuser must incur minimal total pressure losses and facilitate almost-uniform flow with small cross-flow velocity components at the AIP [2]. Due to size and weight restrictions, the use of short S-shaped diffusers (aggressive diffusers) is encouraged.
The researchers in [3] focused on the analysis of flow or pressure gradient induced by surfaces grooves, including the effect of shape of the groove as well as their orientation with respect to the flow the results show strong dependence of pressure loss on the groove orientation, it is possible to reduce such losses as compared with smooth channel, by judicious selection of groove geometry and orientation.
Experiments has been conducted to study the effect of fences and vortex generators in terms of reducing exit flow distortion and improving total pressure recovery in two-dimensional, rectangular S-duct diffusers with different radius ratios [4]. The fence height and orientation of tapered fin vortex generators varied optimal performance depending on centerline curvature.
A low-profile wishbone type vortex generator [5] used to improve the total pressure distortions and recovery performance of a diffusing S-duct. The configuration that employed the largest vortex generator reduced distortion most effectively, but this configuration did not lead to major total pressure recovery.
The using of low profile vortex generators was applied within the first bend of this S-shaped intermediate turbine diffuser [6] to study the influence of passive flow control devices on to separation. This configuration was investigated downstream a transonic turbine stage. Also they investigated the vortex generators in a two-dimensional rectangular S-shaped duct using the same Mach number level. Results showed that the vortex generators reduce the separation in the 2D-duct but have no distinct influence on the separation within the turbine duct due to wakes as well as strong secondary flow effects Experimentally investigated the flow development within an aggressive interturbine duct with and without the installation of a low-profile vortex generator on the casing [7]. Both counter-rotating and corotating configurations were considered, and the latter reduced pressure loss more effectively than the former.
The one possibility to decrease or avoid separation can be the application of passive flow control devices, like grooves, named vortex generators. These components produce streamwise vortices, which reenergize the boundary layer by transporting high energy fluid from the far wall region flow into the flow close to the wall.
grooves located just before the separation point. This process allows the separation point to shift further downstream. This downstream shift lengthens the duration of expanded airflow proportionately, and the flow velocity at the separation point slows as well.
The objective of the present work is to investigate the contribution of grooves on the flow control in an S-shaped aggressive diffuser using 3D simulation by ANSYS-FLUENT 16.2. First, normal and aggressive diffusers have been simulated and compared. Then, the aggressive diffuser has been modified by adding grooves on the inner and outer surfaces. Total pressure loss and the static pressure recovery have been adopted as indicators to highlight the contribution of the grooves on the flow enhancement.
GEOMETRICAL DESCRIPTION AND CFD ANALYSIS OF AN S-SHAPED DIFFUSER
1. S-shaped diffuser
The complete geometry of the simulated diffuser along with the coordinate system used is shown in Figure-1.It was designed based on area ratio AR of 1.923.The radius of curvature RC = 280 mm, the turning angle β = 45°, and centerline length CL = 440 mm. The S-shaped aggressive diffuser is similar to the normal S-shaped diffuser in terms of design and AR. The inlets and outlets of the two diffuser types are also similar; however, the total length of the S-shaped aggressive diffuser is 410 mm instead of 526 mm, which is the length of a normal S-shaped diffuser. The turning angleβ = 30° as indicated in Figure-2.
Figure-1. Geometry of S-shaped diffuser.
Figure-2. S-shaped aggressive diffuser (all dimensions in mm).
The modeled diffuser has a constant area was attached at the inlet of test diffuser with 65x65mm for smooth air inflow and 65x125 mm a constant area tailpipe at the exit of diffuse. The cross-sectional area of the inlet and outlet is 1/8 of the circular cross-sectional areas in the inlets and outlets of both diffuser types, as illustrated in Figure-3.
Figure-3. Cross-sectional area of S-shaped diffuser (a) inlet, (b) outlet.
2. Grid generation
The commercial grid generation software GAMBIT is used for preprocessing in this study. The geometry is accurately modeled and is divided into simple parts for easy and quality domain discretization. Hexahedron meshing is conducted to generate the major part of the grid as a structured mesh.
3. Configurations of grooves combinations
Grooves were employed to improve the flow pattern at the exit plane of the S-shaped aggressive diffuser and to enhance uniformity. These grooves help delay separation, thereby reducing pressure losses and increasing pressure recovery. Various grooves combinations were investigated. One groove in the inner and outer surface, at plane 4-4, and two grooves on the inner and outer surfaces, at planes 3-3 and 4-4.
Figure-4. Angular position of grooves on the inner and outer surfaces of aggressive diffuser (A) In plane 3-3
and 4-4 together, (B) In plane 4-4.
4. Validation of the numerical procedure
The CFD simulation is carried out using ANSYS FLUENT 16.2. Preliminary investigations are done using a range of turbulence for the (45o/45o) S-shaped diffuser, (30o/30o) S-shaped aggressive diffuser and S-shaped aggressive diffuser with grooves. The flow field is predicted using renormalized group (RNG) k–ε and compared with previous experimental and simulation results.
THE GOVERNING EQUATIONS AND BOUNDARY CONDITIONS
The governing equations for continuity and momentum, as well as for steady, turbulent, 3D, and incompressible flows of air are as expressed as follows:
The continuity equation in coordinates (x,y,z)
Continuity equation:
(1)
x- Momentum equation:
(2)
y- Momentum equation:
(3)
z- Momentum equation:
(4)
The simulation was conducted under the following inlet boundary conditions:
Re = Reynolds number of 0.68×10⁵ .
Uavi = Average inlet flow velocity of 15.8 m/s Dh = Hydraulic diameter of the S-shaped diffuser 65
mm
The inlet conditions above are similar to those of the validated experimental and simulated cases [2]. A constant inlet velocity profile and zero-gauge pressure are specified as exit conditions for all simulation cases to facilitate comparative performance evaluation in the CFD simulation of a normal S-shaped diffuser, an S-shaped aggressive diffuser, and an S-shaped aggressive diffuser with grooves.
The flow field was predicted by the renormalized group (RNG) k–ε on the basis of the previousexperimental and simulation results obtained in [2]. To indicate turbulence quantities, such as turbulence kinetic energy k
and turbulence dissipation rate ε, the following relations are applied:
)
(
2
3
2 aviu
K
(5))
(
2 3 4 3L
K
C
(6)where:
L = turbulence length scale = 0.07Lc Lc = characteristic length
I = turbulence intensity =
Cµ = turbulence model constant.
A no-slip boundary condition is specified for the duct walls. Near-wall modeling is performed with enhanced wall treatment method to address the boundary layer formed during grid generation.
PERFORMANCEPARAMETERS
1. Static pressure recovery coefficient
The static pressure recovery coefficient is represented by the following equation
avi si s PR
u
P
P
C
22
1
(7)Ps = static pressure (N/m2) Psi = inlet static pressure (N/m2) Ρ = density of air (kg/m3)
Total pressure loss coefficient
The total pressure loss coefficient is represented by the following equation
0 z w y v x u Mx S z w u y v u x u z u y u x u x P z u w y u v x u
u
( 2) ( ) ( )
2 2 2 2 2 2 My S z w v y v x v u z v y v x v y P z v w y v v x v
u
( ) (2) ( )
2 2 2 2 2 2 Mz S z w y w v x w u z w y w x w z P z w w y w v x w
u
( ) ( ) ( 2)
2 2 2 2 2 2
) 1/8
avi t ti TL
u
P
P
C
2
2
1
(8)Pti = inlet total pressure (N/m2) Pt = total pressure (N/m2)
Wall static pressure coefficient
The wall static pressure coefficient is represented by the following equation:
avi wsi ws WPR
u
P
P
C
2
2
1
(9)Pws= wall static pressure (N/m2) Pwsi = wall inlet static pressure (N/m2)
RESULTSANDDISCUSSIONS
Preliminary investigations were performed for a 45°/45° S-shaped diffuser. The results of this preliminary investigation were utilized to validate the numerical procedure. The results of the present simulation of 45o/45o diffuser have been compared with the experimental and numerical results of [2]. The difference between the geometry of present study and that used in validation case study [2] in the cross sectional area it is a part of circle i.e. the inner and outer surface as a curve which represent the actual cross sectional area of diffuser, while it was rectangular cross sectional in [2].There is a reduction in
CPR value from0.672 to 0.57 and increasing in CTL value from 0.604 to 0.64 between the simulation case of [2] and case 1 of present study, because of the increasing inlet velocity due to the curved inner and outer surfaces, as in table [1].
The results of the present simulation of 30°/30° S-shaped aggressive diffuser and an aggressive diffuser with various grooves combinations presented in Table [2].
Table-1. Comparison of present normal S-shaped diffuser with the simulation and experimental cases of normal
S-shaped diffuser of Ref. [2]
Parameter Sim. results Ref.2 Exp. results Ref.2 present Case 1
CPR 0.672 0.457 0.57
CTL 0.6045 0.712 0.64
Static pressure recovery coefficient
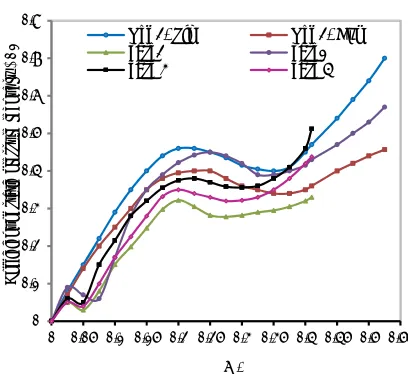
The variation in static pressure recovery coefficient CPR along the length of the normal and S-shaped aggressive diffusers is illustrated in Figure-5, where:
Case (1) - normal S-shaped diffuser.
Case (2) - S-shaped aggressive diffuser without groove.
Case (3) - S-shaped aggressive diffuser with grooves in the inner and outer surfaces at plane 3-3 and 4-4.
Case (4) - S-shaped aggressive diffuser with groove at plane 4-4.
Sim - Ref.2 Simulation results of validation case study [2].
[image:4.612.321.525.192.379.2]Exp. - Ref.2 Experimental results of validation case study [2]
Figure-5. Static pressure recovery coefficient for normal, aggressive diffuser with various grooves combinations.
The initial phase increases up to plane 2-2. However, this growth declines due to flow separation until reattachment occurs at some point after the plane 3-3
X/L = 0.275. Then, the initial phase increases steadily up to the exit. CPR value is maximized at 0.512 for the grooves made at the inner and outer surfaces at plane (3-3 and 4-4) case 3, while it was at 0.57 for normal diffuser case 1 and reduced to 0.33 with aggressive diffuser case 2 as presented in table [2]. As per Figure-6, flow separation starts at X/L = 0.3 for normal diffusers case1, at X/L = 0.2 for aggressive diffuser case 2, and at X/L = 0.26 for case 3. The contribution of grooves adding on the inner and outer surfaces of S-shaped aggressive diffuser was clear for enhance the diffuser efficiency by limiting and delays the flow separation and then increase the CPR and decrease
CTL. The present simulation results agree with previous experimental and simulated results.
Total pressure loss coefficient
The total pressure loss coefficient CTL along the centerline length of S-shaped diffuser and S-shaped aggressive diffuser presents in Figure-6. The total pressure loss coefficient increases almost linearly along the centerline length for both normal S-shaped diffuser and aggressive S-shaped diffuser. The value of CTL is 0.64 for the normal S-shaped diffuser and maximum CTL for the S-shaped aggressive diffuser is 0.68. This increasing in CTL
value is attributed to the early flow separation. 0
0.1 0.2 0.3 0.4 0.5 0.6 0.7 0.8
0 0.05 0.1 0.15 0.2 0.25 0.3 0.35 0.4 0.45 0.5 0.55
Co
ff
ic
ient
of s
tati
c
pres
su
re
r
ec
overy
CPR
X/L
Ref 2- Sim Ref 2- Exp
case2 case1
Nonetheless, the use of grooves considerably reduces CTL value to 0.625 in case 3.
Figure-6. Total pressure loss for normal S-shaped diffuser and Aggressive diffuser with various grooves
combinations.
Table-2. Comparison of different cases of S-shaped diffuser with and without EP
Parameter Case 1 Case 2 Case 3 Case 4
CPR 0.57 0.33 0.512 0.438
CTL 0.64 0.68 0.625 0.66
Wall static pressure coefficient
Figure-7 and Figure-8 compare the wall static pressure recovery results along the outer and inner surfaces of the normal and aggressive diffusers with the RNG (k–ε) model, respectively. These results are validated with case study in Ref. [2]. Flow separation in the normal diffuser starts at X/L = 0.27, whereas this process begins early at X/L = 0.2 case 1 for S-shaped aggressive diffusers when we reduce the total length of the normal diffuser from 526 mm to 410 mm, while it was start at X/L = 0.25 with grooves on the inner and outer surfaces of S-shaped aggressive diffuser case 3.
Figure-7. CFD comparison of wall static pressure along outer surface between normal and aggressive diffuser.
The results show the improvement in CPR value by using the grooves in the inner and outer surfaces of aggressive diffuser case (3) as compare with case (2), Figure-7 and Figure-8.
Figure-8. CFD comparison of wall static pressure along inner surface between normal and aggressive diffuser.
CONCLUSIONS
A normal S-shaped diffuser and an S-shaped aggressive diffuser are investigated with and without various combinations of grooves through ANSYFLUENT 16.2 software. The shortening of a normal S-shaped diffuser from 526 mm to 410 mm (22% length reduction) reduces the diffuser efficiency from 0.57 to 0.512, in terms of CPR reduction, and increases CTLvalue from 0.64 to 68. Grooves installation on the inner and outer surface of the S-shaped aggressive diffuser limited the reverse flow and enhanced the diffuser efficiency by increasing CPR and reducing CTL. Using grooves on the inner and outer surfaces of S-shaped aggressive diffuser at plane (3-3 and 4-4) together performed the best case, with
CPR = 0.512 and CTL = 0.625. The numerical procedure
0 0.1 0.2 0.3 0.4 0.5 0.6 0.7 0.8
0 0.05 0.1 0.15 0.2 0.25 0.3 0.35 0.4 0.45 0.5 0.55
Coefficie
nt
of total
pre
ssure
loss
CT
L
X/L
Ref 2 - Sim Ref 2 - Exp case1 case 2 case 3 case 4
-0.2 0 0.2 0.4 0.6 0.8 1 1.2
0 0.05 0.1 0.15 0.2 0.25 0.3 0.35 0.4 0.45 0.5 0.55
Wa
ll sta
ti pr
essur
e
co
ff
ic
ient
CWPR
X/L
Ref 2 -Exp Ref 2 -Sim
-0.2 -0.1 0 0.1 0.2 0.3 0.4 0.5 0.6 0.7 0.8 0.9
0 0.05 0.1 0.15 0.2 0.25 0.3 0.35 0.4 0.45 0.5 0.55
Wa
ll
sta
tic
pre
ssur
e coe
ff
ic
ie
nt CWP
R
X/L
Ref 2 - Exp Ref 2 - Sim
case 1 case 2
adopted in the present work has been validated by comparison with previous experimental and numerical results, where good agreements have been realized.
REFERENCES
[1] Madadi, A., Kermani, M.J. and Nili-Ahmadabadi, M., 2014. Aerodynamic Design of S-Shaped Diffusers Using Ball-Spine Inverse Design Method. Journal of Engineering for Gas Turbines and Power, 136(12), p. 122606.
[2] Paul, A.R., Ranjan, P., Patel, V.K. and Jain, A., 2013. Comparative studies on flow control in rectangular S-duct diffuser using submerged-vortex
generators. Aerospace Science and
Technology, 28(1), pp. 332-343.
[3] Mohammadi, A. and Floryan, J. M. 2011 Flow in grooved micro-channels. Seventh International Symposium on Turbulence and Shear Flow Phenomena (TSFP-7), July 28–31, Ottawa, Ontario, Canada.
[4] Sullerey, R.K., Mishra, S. and Pradeep, A.M., 2002. Application of boundary layer fences and vortex generators in improving performance of S-duct diffusers. Journal of fluids engineering, 124(1), pp.136-142.
[5] Reichert, B.A. and Wendt, B.J., 1993. An Experimental Investigation of S-Duct Flow Control Using Arrays of Low Profile Vortex Generators. National Aeronautics and Space Administration.
[6] Santner, C., GÃķttlich, E., Marn, A., Hubinka, J. and Paradiso, B., 2012. The application of low-profile vortex generators in an intermediate turbine diffuser. Journal of Turbomachinery, 134(1), p. 011023.