Georgia State University
ScholarWorks @ Georgia State University
Public Health Dissertations School of Public Health
Summer 8-9-2016
Quality Improvement in Stroke Care and Its
Impact: the Georgia Coverdell Acute Stroke
Registry Experience
Moges Ido
Follow this and additional works at:https://scholarworks.gsu.edu/sph_diss
This Dissertation is brought to you for free and open access by the School of Public Health at ScholarWorks @ Georgia State University. It has been accepted for inclusion in Public Health Dissertations by an authorized administrator of ScholarWorks @ Georgia State University. For more information, please [email protected].
Recommended Citation
Ido, Moges, "Quality Improvement in Stroke Care and Its Impact: the Georgia Coverdell Acute Stroke Registry Experience." Dissertation, Georgia State University, 2016.
GEORGIA STATE UNIVERSITY, SCHOOL OF PUBLIC HEALTH
QUALITY IMPROVEMENT IN STROKE CARE AND ITS
IMPACT: THE GEORGIA COVERDELL ACUTE STROKE
REGISTRY EXPERIENCE
by
MOGES SEYOUM IDO
MD, MS, MPH
A Dissertation Submitted to the Graduate Faculty
of
Georgia State University
in Partial Fulfillment of the Requirements for the Degree
DOCTOR OF PHILOSOPHY IN PUBLIC HEALTH
ATLANTA, GEORGIA
30303
i
QUALITY IMPROVEMENT IN STROKE CARE AND ITS IMPACT: THE GEORGIA COVERDELL ACUTE STROKE REGISTRY EXPERIENCE
by
MOGES SEYOUM IDO, MD, MS, MPH
Approved by:
Committee Chair
Prof. Richard Rothenberg
Committee Member
Prof. Ike Okosun
Committee Member
Prof. Michael Frankel
ii
Author’s Statement Page
In presenting this dissertation as a partial fulfillment of the requirements for an advanced degree from Georgia State University, I agree that the Library of the University shall make it available for inspection and circulation in accordance with its regulations governing materials of this type. I agree that permission to quote from, to copy from, or to publish this dissertation may be granted by the author or, in his/her absence, by the professor under whose direction it was written, or in his/her absence, by the Associate Dean, School of Public Health. Such quoting, copying, or publishing must be solely for scholarly purposes and will not involve potential financial gain. It is understood that any copying from or publication of this dissertation which involves potential financial gain will not be allowed without written permission of the author.
___Moges Seyoum Ido_____________
iii
TO MY PARENTS:
GHENET BALCHA WURGHI
iv
Contents
Acknowledgment vi
Illustrations vii
ABSTRACT 1
Chapter I
Introduction 3
Quality Improvement 3
The Georgia Coverdell Acute Stroke Registry 6
Study Objectives 8
Chapter II
Participation in registry based quality improvement and its impact on patient outcome
Abstract 10
Introduction 12
Methods 13
Results 17
Discussion 18
Chapter III
Quality improvement performance measures vis-à-vis patient outcome
Abstract 27
Introduction 29
Methods 30
Results 33
v Chapter IV
Long-term effectiveness of intravenous alteplase in acute ischemic stroke
Abstract 42
Introduction 44
Methods 44
Results 48
Discussion 49
Chapter V
Summary 55
References 59
Annex 67
vi
ACKNOWLEDGMENT
I would like to thank my committee members Prof. Richard Rothenberg, Prof. Ike S Okosun and
Prof. Michael Frankel for their feedback and support that helped me understand the different
facets of my dissertation.
I do also acknowledge the Georgia Coverdell Acute Stroke Registry team and the participating
hospitals for their continuous effort to improve the quality of stroke care across the state of
vii
ILLUSTRATIONS Figures
1. Flow diagram for patients included in the analysis of impact of quality improvement
2. Defect-free care and average composite measure by the number of performance measure acute ischemic patients were eligible for, Georgia Coverdell Acute Stroke Registry, 2008-2013
3. Median National Institute of Health stroke scale score by the number of performance measure acute ischemic patients were eligible for, Georgia Coverdell Acute Stroke Registry, 2008-2013
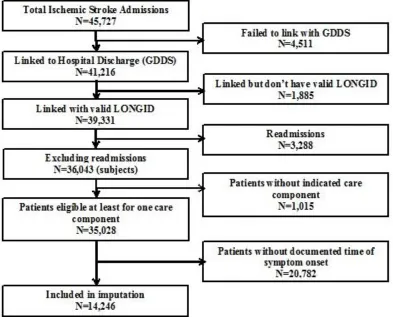
4. Flow diagram for patients included in the analysis effectiveness of intravenous alteplase
Tables
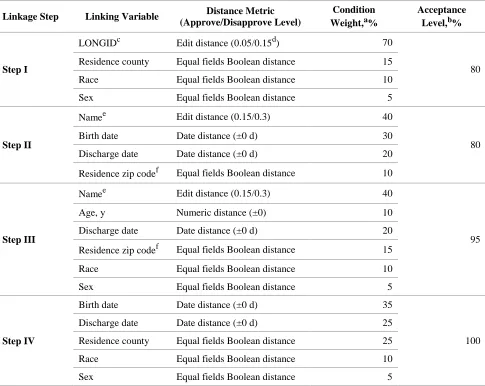
1. Algorithm for merging the Georgia Discharge Data System with the Georgia mortality data of the same calendar Year
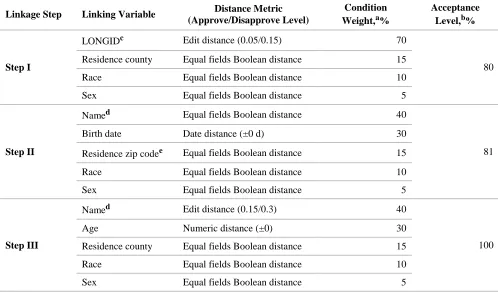
2. Algorithm for merging the Georgia Discharge Data System with the Georgia mortality data from different calendar years
3. Agreement in the matching variables of the linked Georgia hospital discharge data and Georgia mortality data
4. Characteristics of acute ischemic stroke patients (n = 50,579) cared for by Georgia Coverdell Acute Stroke Registry participating and nonparticipating hospitals, Georgia Hospital Discharge Data, 2006–2009, and Georgia Mortality Data, 2006–2010
5. Relative risk for death for Georgians with acute ischemic stroke, Georgia Hospital Discharge Data, 2006–2009, and Georgia Mortality Data, 2006–2010
6. Performance measures endorsed by the CDC, the American Heart Association/American Stroke Association and the Joint Commission
7. Characteristics of acute ischemic patients by defect-free care status, Georgia Coverdell Acute Stroke Registry, 2008–2013
8. Relative risk of 1-year mortality and non-ambulating at discharge among acute ischemic stroke patients by quality of care, Georgia Coverdell Acute Stroke Registry 2008-2013.
9. Characteristics of acute ischemic stroke patients eligible for IV alteplase and with complete information (n=2925), Georgia Coverdell Acute Stroke Registry, 2008-2013
.
10. Relative risk of 1-year mortality and readmission by intravenous alteplase treatment status, Georgia Coverdell Acute Stroke Registry 2008-2013
1
ABSTRACT
QUALITY IMPROVEMENT IN STROKE CARE AND ITS IMPACT: THE GEORGIA
COVERDELL ACUTE STROKE REGISTRY EXPERIENCE
by
MOGES SEYOUM IDO, MD, MS, MPH
June 22, 2016
The Georgia Department of Public Health has been engaged in a registry-based quality
improvement initiative to monitor and improve the quality of stroke care. It is important to
evaluate effectiveness of the quality improvement initiative in order to expand the effort to other
sites or disease conditions. The studies, included in this dissertation, addressed whether acute
ischemic stroke patients cared for by hospitals participating in the Georgia Coverdell Acute
Stroke Registry (GCASR) had a better survival than those treated at other facilities, assessed
whether quality of care as measured by nationally accepted ten performance measures is
associated with improved patient outcome and evaluated the impact of intravenous alteplase
treatment on 1-year mortality.
Three data sources – GCASR, Georgia Discharge Data System and the death data – were
used for analyses. These data sources were linked applying both a hierarchical deterministic and
a probabilistic linkage methods. Survival after stroke incident was analyzed using the extended
Cox proportional hazard model. Generalized estimating equation (glimmix procedure) and
conditional logistic regression were applied, respectively, to assess the association of quality of
2
Acute ischemic stroke patients treated at nonparticipating facilities had a hazard ratio for
death of 1.14 (95% confidence interval, 1.03–1.26; P-value = .01) after the first week of admission compared with patients cared for by hospitals participating in the registry. Among
patients treated in GCASR-participating hospitals, patients who received the lowest and
intermediate quality care respectively had a 3.94 (95%CI: 3.27, 4.75; p-value <0.0001) and a
1.38 (95%CI: 1.12, 1.62; p-value=0.002) times higher odds of dying in one year compared to
those who got the best quality stroke care. Patients who were eligible but did not receive IV
alteplase had a 1.49 (95%CI: 1.09-2.04; p-value=0.01) times higher odds of dying within one
year than those who were treated with the thrombolytic agent.
The results strongly suggest that registry-based quality improvement effort has brought
significant improvements in ischemic stroke patients’ outcomes. Therefore, it is critical that
hospitals adopt a quality improvement strategy to change the process of care delivery for a better
3
CHAPTER I
INTRODUCTION
Quality Improvement
Healthcare providers strive to improve the quality of patient care and enhance their
performance. The assessments and continuous systematic efforts to improve quality of care
constitute quality improvement.1 Quality improvement is data driven, focuses on patients’ need and expectations, and works on processes and systems of healthcare delivery.1 In most healthcare
setups, particularly where multiple units play a role in the process of healthcare delivery, it
requires a team effort involving every unit of the organization to improve the quality of patient
care.
The Institute of Medicine (IOM) defines quality of care as “the degree to which health
services for individuals and populations increase the likelihood of desired health outcomes and
are consistent with current professional knowledge.”2 Quality of care encompasses every aspect
of healthcare – diagnostic, therapeutic and preventive – both in a clinical and community setup.
Delivery of a clinical care has three dimensions: the environment in which the care is provided
(the structure); the actual care including patient reception, diagnosis, treatment, preventive care
and discharge instruction; and the outcome in terms of patient health status, satisfaction, and
behavior and resource consumption.3 Measurement of the factors in each dimension of care
delivery may not be sufficient to evaluate quality of care unless they can be shown to relate to
4
The IOM’s definition implies that quality is inherent to any health service and the care
has to be congruent with the best available evidence-based practices and guidelines. Adherence
to these guidelines need to be monitored continuously to ensure that patients receive the best care
at all times. Measuring healthcare providers’ performance requires continuous systematic data
collection and analysis, and performance measures to assess whether the provider is attaining the
goal set for healthcare delivery process.
Despite rapid advances in medical science and technology, not all patients consistently
receive high quality clinical care. A study among American adults in 12 metropolitan cities
indicated that patients received only 55% of the recommended care.4 Almost two decades after
FDA approved the use of thrombolytics for ischemic stroke patients, only 12% of the patients
receive the treatment in Georgia.5 Thus, medical advances and the availability of resources do
not necessarily translate into provision of high quality care to all patients over time. It is,
therefore, necessary to design strategies for dissemination and broad scale application of
evidence based clinical practices. How states organize their healthcare system or how healthcare
providers set up delivery of care taking a system’s perspective becomes important in meeting
patients’ expectation and expectations of the community at large.
Replication and implementation of an intervention require demonstration of effectiveness
in a broader use. Despite evidence of effectiveness, hindrance to implementation could come
from lack of information about the new strategy on quality of care or from reluctance to accept
the new clinical care guidelines.6-8 Strong evidence demonstrating the effectiveness of an
5
is essential to measure, evaluate and document the changes brought by interventions targeting
quality of care and its purported impact on patient outcomes.
Strategies to implement evidence based medicine has evolved from the optimistic passive
diffusion where we assume clinicians would adopt a new clinical practice if they are provided
with the information to a more active approach of quality improvement.9 The concept of quality
improvement is not unique for clinical care or healthcare in general; rather, the industrial sector
is the vanguard in implementing methods of quality improvement for better productivity
(efficiency) and ensuring product quality.10 Methods of quality improvement tried and tested in
other sectors have also been shown to be applicable in clinical care11,12 as well because the
ultimate target remains the same – better outcome in the most efficient way.
Studies have shown that implementation of quality improvement activities lead to
improvement in the process of care delivery and patient’s outcomes.13-23 These studies involved
healthcare facilities of different levels and various clinical conditions from infectious disease to
chronic conditions such as depression and diabetes mellitus. They documented improvements in
adoption of care processes and uptake of evidence-based guideline recommendations including
prescription of appropriate medications, reduction in unnecessary referrals, narrowing the gap in
gender and racial disparity in health outcomes, reducing complications, secondary disease
prevention and better patient outcomes in terms of disease control, readmission rate and
mortality.
Some studies, however, failed to demonstrate significant improvement both in patient
care process and outcome resulting from QI activities.24-26 A review of literature on the impact of
6
cannot be predicted with certainty.24 The reviewers examined 72 papers from 1,101 published on
quality improvement from 1995 to 2006, and were only able to show that quality improvement
collaborative would improve care process, organizational performance, access to care and
consumer satisfaction but not the outcome. Therefore, it is important to evaluate such initiatives
using outcome measures both for the purpose of long-term, large scale implementation and for
identifying components of the quality improvement initiative with the greatest relationship to
those outcomes, even if they were launched initially based on available scientific evidences.
In the context of clinical care, ensuring clinicians adhere to evidence-based clinical
guidelines is part of a quality improvement task. Guidelines usually are institution-based, but in
some cases there are guidelines developed by experts or professional associations that are also
endorsed and recommended by national institutions. It is expected that such guidelines would be
readily disseminated to healthcare providers and easily adopted, although the environment in
which the care is provided and the processes involved in implementing national guidelines must
be considered. However, the basic question –whether or not adherence to clinical guidelines in
stroke care results in better patient outcome – remain unanswered.
The Georgia Coverdell Stroke Registry
Stroke is the fifth leading cause of mortality in the United States.27 Every year, around
800,000 people develop acute stroke28 and about 70% of the survivors develop some residual
disability including neurological deficit, speech disorder, cognitive deficit or psychological
disorder such as depression.29 Stroke not only affects the individual patient but adds economic and
emotional burden to their caregivers and the community at large.30,31 In the United States, the direct
7
In 2001, the United States Congress directed the Centers for Disease Control and
Prevention (CDC) to establish a state-based acute stroke registry to measure and monitor the
quality of acute stroke patient care.32 After three years of piloting, the state of Georgia received a
grant to set-up a registry which is currently housed in the Department of Public Health (DPH).
Since then, DPH, in collaboration with its partners, has been assisting more than 60 hospitals to
improve the quality of stroke patient care. Different size hospitals ranging from critical access to
large teaching hospitals participate in the registry; currently, about 80 percent of stroke patients
are treated at GCASR participating hospitals.
A wealth of scientific evidences shows that improvement in specific elements of clinical
care could result in better patient outcome.33 The Georgia Coverdell Acute Stroke Registry
(GCASR) encourages hospitals to adopt a quality improvement program and provides technical
assistance through regular trainings, workshops, site visits and direct one-on-one consultations,
data feed-back, mentorship and sharing the best practices to ensure that every patient in Georgia
receives the best evidence-based clinical care.
The Institute of Medicine’s definition of quality of care puts emphasis on health outcome
as indicators of quality, although information on the type, level and amount of healthcare
provided to the community is also essential. Outcome measures may not be as sensitive as
process measures in showing immediate changes made in quality improvement initiatives;
however, they are necessary to show that the change in process measures results in benefits to
8
STUDY OBJECTIVES
GCASR has registered significant improvements in the quality of care provided in
participating hospitals.35,36 Based on the 2005-2009 hospital discharge data, ischemic stroke
patients cared for by GCASR hospitals had a 64% higher odds (OR=1.64) of receiving
intravenous thrombolysis. However, it needed to be seen whether patients cared for by hospitals
participating in GCASR had better outcome and if this improvement in patient outcome could be
attributed to the quality improvement measures undertaken by the participating hospitals. The
main objective of this study, therefore, is to assess the direct impact of the quality improvement
program on short and/or long term outcomes – ambulatory status at discharge, readmission and
death.
Objective 1. Do acute ischemic stroke patients treated at GCASR hospitals have a better
survival than patients cared for by non-participating hospitals?
Objective 2. Does quality improvement as measured by the ten performance measures reduces
the 1-year mortality of acute ischemic stroke patients?
Objective 3. Does intravenous alteplase affect mortality among acute ischemic stroke patients?
The results will help to expand the program to non-participating hospitals in Georgia and
for other states to learn from and replicate Georgia’s experience. The studies required linking
three data sources – the GCASR data, the Georgia Discharge Data system (GDDS - hospital
discharge data) and the Death Records – related to the care and outcome of stroke patients in
Georgia. GCASR and GDDS data from 2008 to 2013 and death data from 2008 to 2014 were
9
treatment, facility and event-related information. This experience of linking registry and
administrative data will serve as a blue print for evaluation of other public health programs based
10
CHAPTER II
Administrative Data Linkage to Evaluate a Quality Improvement Program in Acute Stroke Care, Georgia, 2006 – 2009
ABSTRACT
Introduction
Tracking the vital status of stroke patients through death data is one approach to assessing
the impact of quality improvement in stroke care. We assessed the feasibility of linking Georgia
hospital discharge data with mortality data to evaluate the effect of participation in the Georgia
Coverdell Acute Stroke Registry on survival rates among acute ischemic stroke patients.
Methods
Multistage probabilistic matching, using a fine-grained record integration and linkage
software program and combinations of key variables, was used to link Georgia hospital discharge
data for 2005 through 2009 with mortality data for 2006 through 2010. Data from patients
admitted with principal diagnoses of acute ischemic stroke were analyzed by using the extended
Cox proportional hazard model. The survival times of patients cared for by hospitals
participating in the stroke registry and of those treated at nonparticipating hospitals were
compared.
Results
Average age of the 50,579 patients analyzed was 69 years, and 56% of patients were
11
after first admission for stroke were 8.1% and 18.5%, respectively. Patients treated at
nonparticipating facilities had a hazard ratio for death of 1.14 (95% confidence interval, 1.03–
1.26; P-value = .01) after the first week of admission compared with patients cared for by hospitals participating in the registry.
Conclusion
Hospital discharge data can be linked with death data to assess the impact of
clinical-level or community-clinical-level chronic disease control initiatives. Hospitals need to undertake quality
improvement activities for a better patient outcome
12
INTRODUCTION
Assessing the impact of chronic disease programs and the quality of clinical care for
patients with chronic diseases is essential to identify areas for improvement in care and to
demonstrate the level and nature of improvements already made.37 The American Heart
Association/American College of Cardiology Working Group on Quality of Care and Outcomes
Research in Cardiovascular Disease and Stroke advocates measuring the short-term and
long-term outcomes of quality of care for stroke patients as a way of delong-termining the impact of related
chronic disease programs.38 Tracking the vital status of patients with chronic disease, who may
be seen at different health facilities, by using death data is a promising method for assessing the
overall quality of care for chronic diseases.37
Administrative data such as hospital discharge data and death data are great resources for
public health studies.39–41 These are population-based databases that can be used to assess the
quality of stroke care because they include all population groups. Administrative data are easy to
access, and they provide longitudinal information for passive follow-up and trend analyses.
The Georgia Coverdell Acute Stroke Registry (GCASR) is a part of a national stroke
registry program, the Paul Coverdell National Acute Stroke Registry. The national registry has
the long-term goal of reducing premature deaths attributable to stroke and preventing stroke
disability and recurrent stroke through ensuring the highest quality of acute stroke care to all
Americans. GCASR was launched by the Georgia Department of Public Health in 2005 in
partnership with other stakeholders. We sought to assess the feasibility of linking mortality data
from the Georgia Department of Public Health Office of Vital Records with hospital discharge
13
evaluate the impact of participation in a state-based registry program on survival of patients with
acute ischemic stroke.
METHODS
Georgia death records and Georgia hospital discharge data
The Georgia Department of Public Health Office of Vital Records is responsible for
collecting information about deaths among Georgians by using the death certificates. The death
certificate contains information on individuals’ demographic characteristics, residence,
underlying possible causes of death, location of death, and death date. Each year, more than
67,000 Georgians die, and 98% of the deaths occur within the state of Georgia.
The GDDS is housed at the Georgia Hospital Association and has information on all
inpatients discharged from nonfederal short-stay hospitals in Georgia. GDDS gathers more than
a million records per year. GDDS and mortality data share common variables including age, sex,
race, residence information, and a quasi-unique subject identifier (LONGID) that facilitates the
data linkage.
The feasibility of data linkage is based on the assumption that the variable LONGID was
sufficiently specific to distinguish each subject in the data sources. The LONGID is a 15-digit
alphanumeric unique code created from letters of patients’ first and last names, birth date, and
sex. We tested accuracy of data linkage by using data from GDDS for 1,494 Georgia patients
14
intrathoracic organs: ICD-9 codes 160–165) but who were alive in 2006. Patients with similar
age characteristics were chosen because personal name patterns in a given community may
change through time.
The test data set was then linked with the Georgia mortality data for 2006 by using a
multistage deterministic and probabilistic matching algorithm and various combinations of key
variables (Table 1 and Table 2). We used fine-grained record integration and linkage software
for matching, and we excluded duplicate entries using the LONGID, admission and discharge
dates, and facility codes.42 Degrees of linkage between hospital discharge data and mortality data
were determined (Table 3).
Assessment of impact of stroke registry – survival analysis
We used the 2005 through 2009 GDDS and the 2006 through 2010 Georgia Office of
Vital Records mortality data to examine the survival rates of acute ischemic stroke patients.
Patients admitted to nonfederal acute care and critical access facilities with the principal
diagnosis ICD-9 codes 433 and 434 were identified and linked to the death data. Death and
survival time from the index admission date, regardless of the underlying cause of death, were
the outcome variables. We believe that care in the first few hours after stroke symptom onset
determines the stroke patient’s subsequent health condition, so we attributed the outcome to the
facility of first stroke admission. Patients were labeled to have had a first stroke admission in
2006 if they were not admitted for any type of stroke, ICD-9 codes 430–438, in 2005.
We defined enrollment in GCASR if the hospital actively participated in data entry and
15
facility if the hospital in which patients were admitted was enrolled in the registry. Patients who
were treated at any time before a facility was enrolled or after it withdrew its participation were
counted as patients treated by a non-GCASR hospital. We included patient’s sociodemographic
characteristics such as age, sex, race, insurance status, and length of hospital stay, and hospital
features including number of beds and location as covariates in the analysis. On the basis of the
number of beds, we classified hospitals as small (<100 beds), medium-small (100–249 beds),
medium-large (250–399 beds) and large hospitals (≥400 beds). We used the Rural-Urban
Commuting Area classification of location to classify hospitals geographically into metropolitan
(codes 1–3) and nonmetropolitan (codes >3).43
Comorbidities were included in the analyses to adjust for disease severity. We used the
Healthcare Cost and Utilization Project software from the Agency for Healthcare Research and
Quality (US Department of Health and Human Services) to define comorbidities for each patient
based on the ICD-9 codes in the hospital discharge data.44,45 Patients’ readmission status before
either the end of the follow-up period or the patient’s death was captured from the hospital
discharge data, and we classified patients as either not having been readmitted, readmitted to the
same hospital, or readmitted to a different hospital. If patients were admitted to a different
hospital within a day after their index or first admission date we considered their status as a
transfer rather than a readmission, and they were excluded from the analysis. All the variables
used in the analyses refer to what was documented at the first stroke admission except for the
date of death. To have stable estimates, we excluded stroke patients from hospitals with fewer
16
Statistical analysis
We analyzed the data by using SAS for Windows (version 9.3, SAS Institute, Inc). We
assessed the sensitivity of the linkage procedure based on the proportion of stroke-related
in-hospital deaths that were captured by the 2006 Georgia vital records mortality data. We
determined specificity by the proportion of subjects who were admitted in 2007 having a
malignant neoplasm of the respiratory organs that were linked to any of the records in the 2006
death file. We assessed patient and hospital characteristics descriptively and tested differences
between patients treated at GCASR participating and nonparticipating hospitals using χ2 tests for
nominal variables and Wilcoxon tests for quantitative variables.
We assessed the proportional hazard assumption graphically and through the
goodness-of-fit test for correlation between the Schoenfield residuals and failure time.46 We repeated the
graphic assessment using the log–negative log of survival curves after adjusting for covariates.
The GCASR participation variable did not satisfy the proportional hazard assumption. Thus, we
analyzed survival time in correlated data using the extended Cox proportional hazard model with
the robust sandwich estimate option to estimate the marginal covariate effects. We performed the
analysis with and without censoring at 1 year. Results are presented indicating the hazard ratio
for death in the first year after the seventh day of the first stroke admission date by different
17
RESULTS
Data linkage test for accuracy
Of the 1,494 acute stroke patients with an in-hospital death recorded in the 2006 hospital
discharge data, 1,381 (92.4%) were identified in the 2006 death data, whereas none of the 3,598
patients with malignant neoplasm of respiratory and intra-thoracic organs diagnosed in 2007
were linked to the 2006 death data. Agreements between hospital discharge records and death
data were high (>91%) for demographic variables, facility (93.6%), and discharge or death dates
(92.6%) (Table 3).
Impact of participation in state-based stroke registry: survival analysis
From the initial 50,937 patients listed, 358 were excluded because 269 were considered
transfers and 89 were from hospitals with fewer than 15 cases. Analysis was performed for
50,579 acute ischemic stroke patients (Table 4) admitted to 131 acute care and critical access
hospitals in Georgia to assess the impact of participation in GCASR during 2006 to 2009. Most
(52%) were women, and whites accounted for two-thirds (66%) of the patients. The mean age for
first stroke admission was 69 years. Most (64%) had Medicare as their principal health insurance
coverage. The median hospital length of stay was 3 days.
GCASR-participating hospitals treated 56% of the ischemic stroke patients (n = 28,077),
and there were no statistical differences in age, hospital length of stay, proportion of various
racial groups, or proportion of subjects with insurance coverage between patients treated at
GCASR and non-GCASR hospitals (Table 4). However, non-GCASR hospitals were more likely
18
more stroke-related deaths at 30 and 365 days following stroke admissions. The overall mortality
at 30 days and 365 days after the first admission were 8.1% and 18.5%, respectively.
The extended Cox model indicated that patients treated at non-GCASR hospitals had a
hazard ratio of 1.14 (95% confidence interval [CI], 1.03–1.26) from the eighth day after
admission to 1 year after admission (Table 5). A similar hazard ratio (1.13; 95% CI, 1.04–1.22)
was observed when no cutoff date was applied. Similarly, older patients and those treated in
nonmetropolitan hospitals had a higher hazard ratio than their counterparts. Patients with a
private insurance or self-pay had a lower hazard ratio than did Medicare patients. In addition,
hospitals with fewer than 100 beds and longer hospital stays for patients were independently
associated with subsequent death (Table 5).
DISCUSSION
Acute ischemic stroke patients cared for by hospitals participating in GCASR had a better
outcome than their counterparts in nonparticipating hospitals. This study found a modest (14%)
increase in the hazard ratio for death in the first year for patients treated at non-GCASR
participating facilities. Several studies have shown that quality improvement efforts result in
improved stroke patient care.47–50 This study, however, demonstrated that a state-based initiative
based on the collaborative effort of professionals who are willing to share their expertise and
exchange best practices results in tangible benefit to the community served.
Patients treated at non-GCASR facilities continued to have the same hazard ratio
throughout their follow-up time, indicating perhaps that the clinical care provided to patients at
19
whether hospitals participated in the GCASR, patient outcomes throughout Georgia improved
with time. Compared with patients who had an acute ischemic stroke in 2009, patients during
2006 through 2007 had a 9% higher risk of dying during the first year after the index admission.
Development of new treatment guidelines and their implementation by health care providers may
have contributed to the reduction in mortality; however, it is impossible to rule out a possible
spillover effect of the GCASR initiatives to nonparticipating facilities.
There was no meaningful difference in outcomes among hospitals of different size except
for small hospitals (<100 beds) where patients had a 17% higher risk of mortality. Hospitals
participating in GCASR tended to be metropolitan and larger, and although our analyses adjusted
for these 2 variables, differences attributable to other variables between the 2 hospital groups
cannot be ruled out. It is not possible, thus, to associate the reduction in hazard ratio among the
GCASR hospitals entirely to the quality improvement initiatives undertaken by the registry. In
future studies, linking the registry data (where interventions received by patients are
documented) to the hospital discharge and death data will be helpful to associate the clinical care
information with patient outcome.
The yield from the linkage procedure was sufficient to assess the impact of the quality
improvement program. There would be patients who died but were not picked by the matching
procedure; however, failure to link was not related to the type of hospital where patients were
treated in the test data set. Failure to link gives a lower estimate of the actual mortality but does
not introduce bias in the study’s effect measure. Studies elsewhere reported different rates of
mortality for ischemic stroke.51–55 The mortality at 1 month poststroke admission ranges from
20
mortality has been reported to vary from less than 10% in Japanese and Taiwanese studies to
29% in the Minnesota study. The observed differences may be due to variations in study
methodology, population characteristics, and quality of patient care. The 1-year mortality
estimate observed in this analysis (18.5%) lies between extreme values that have been reported
by other investigators, thus indicating that the linkage procedure was sufficiently sensitive and
may even be a reasonable approach to estimate mortality and survival rates across the course of
stroke patient care. We believe our estimates may be lower than expected rates because the data
linkage may not have captured all patients who died in the given period, particularly those who
died outside the state of Georgia.
This study has limitations, some of which are inherent to any method that assesses the
effect of a quality improvement intervention. It is difficult to define the time when the effect of
such an intervention wanes, and several factors contribute to the overall well-being of a patient
through time. Survival of acute ischemic stroke patients depends on factors such as patient and
hospital characteristics, the time from symptom onset to arrival at the hospital, disease severity,
the quality of service received from the health care facility on first encounter, the quality of
rehabilitation services, and the quality of life once the patient is discharged from a hospital. This
analysis took into account most of the prehospital discharge factors except for time elapsed
between symptom onset and arrival at the hospital. In addition, we did not have information on
postdischarge rehabilitation and quality of life.
Although administrative data may lack consistent case definitions from one data set to
another and the use of ICD-9 codes may not capture all possible acute stroke patients, the effect
21
quality improvement registry, because misclassifications are more likely to be non-differential
and would only reduce the effect measure toward the null value. Moreover, this study may not
have completely captured disease severity, which is the main predictor of mortality. Different
indices, including the National Institute of Health Stroke Scale, have been suggested by
researchers to predict mortality, but there is no consensus index.56–60 Each one has its own merit
in terms of feasibility of data collection, availability for data collection, and discriminatory
power of fatal outcome. Several studies used the comorbidity measure, initially developed by
Elixhauser et al44 in various disease conditions,61–66 and Zhu and Hill have demonstrated its
usefulness in stroke as well.67. It is, thus, reasonable and practical to use comorbidity measures to
account for disease severity.
State-based hospital discharge data and death data can be linked and are excellent for
estimating survival or risk for mortality, outcome measures that are helpful to assess the impact
of clinical-level or community-level chronic disease control initiatives. The results of this study
show that participation in a state-based stroke registry for improving the quality of care is
associated with reduced mortality from acute ischemic stroke. Thus, hospitals should be
encouraged either to participate in a structured program of quality improvement such as
state-based registries or undertake their own quality improvement to provide the best possible
22
Table 1. Algorithm for merging the Georgia Discharge Data System with the Georgia mortality data of the same calendar Year
Linkage Step Linking Variable Distance Metric (Approve/Disapprove Level)
Condition Weight,a%
Acceptance Level,b%
Step I
LONGIDc Edit distance (0.05/0.15d) 70
80
Residence county Equal fields Boolean distance 15
Race Equal fields Boolean distance 10
Sex Equal fields Boolean distance 5
Step II
Namee Edit distance (0.15/0.3) 40
80
Birth date Date distance (±0 d) 30
Discharge date Date distance (±0 d) 20
Residence zip codef Equal fields Boolean distance 10
Step III
Namee Edit distance (0.15/0.3) 40
95
Age, y Numeric distance (±0) 10
Discharge date Date distance (±0 d) 20
Residence zip codef Equal fields Boolean distance 15
Race Equal fields Boolean distance 10
Sex Equal fields Boolean distance 5
Step IV
Birth date Date distance (±0 d) 35
100
Discharge date Date distance (±0 d) 25
Residence county Equal fields Boolean distance 25
Race Equal fields Boolean distance 10
Sex Equal fields Boolean distance 5
a: Proportional weight for each element in the linkage step. b: Total match score at which records are considered to be linked.
c: 15-digit alphanumeric code created from letters of patients’ first and last names, birth date, and sex.
d: The proportion of mismatched characters used to determine whether the records are considered to be linked. e: Refers to a 6-digit code derived from names.
23
Table 2. Algorithm for merging the Georgia Discharge Data System with the Georgia mortality data from different calendar years
Linkage Step Linking Variable Distance Metric (Approve/Disapprove Level)
Condition Weight,a%
Acceptance Level,b%
Step I
LONGIDc Edit distance (0.05/0.15) 70
80
Residence county Equal fields Boolean distance 15
Race Equal fields Boolean distance 10
Sex Equal fields Boolean distance 5
Step II
Named Equal fields Boolean distance 40
81
Birth date Date distance (±0 d) 30
Residence zip codee Equal fields Boolean distance 15
Race Equal fields Boolean distance 10
Sex Equal fields Boolean distance 5
Step III
Named Edit distance (0.15/0.3) 40
100
Age Numeric distance (±0) 30
Residence county Equal fields Boolean distance 15
Race Equal fields Boolean distance 10
Sex Equal fields Boolean distance 5
a: Proportional weight for each element in the linkage step.
b: Total of condition weights at which records are considered to be linked.
c: 15-digit alphanumeric code created from letters of patients’ first and last names, birth date, and sex. d: Refers to a 6-digit code derived from names.
24
Table 3. Agreement in the matching variables of the linked Georgia hospital discharge data and Georgia mortality data
Variable
Agreement, %
Test Data and 2006 Death Data
2006–2009 Hospital Discharge and 2006– 2010 Death Data
LONGIDa 85.8 91.3
Birth date 94.5 96.2
Nameb 91.9 98.3
Sex 99.2 99.8
Age 98.1 —d
Race 95.2 96.8
Residence county 91.0 88.3
Residence zip codec 62.0 62.6
Facility 93.6 —d
Discharge date or date of death 92.6 —d
a: 15-digit alphanumeric code created from letters of patients’ first and last names, birth date, and sex. b: Refers to a 6-digit code derived from names.
c: 5-digit zip code.
25
Table 4. Characteristics of acute ischemic stroke patients (n = 50,579) cared for by Georgia Coverdell Acute Stroke Registry participating and nonparticipating hospitals, Georgia Hospital Discharge
Data, 2006–2009, and Georgia Mortality Data, 2006–2010
Characteristics
Treatment Location
P-Valueb All Hospitals GCASR
Hospitals
Non-GCASR Hospitalsa
Age, y, mean (SD) 68.7 (13.9) 68.2 (13.9) 69.3 (13.9) .12
Sex, n (%) Male Female 24,494 (48.4) 26,085 (51.6) 13,948 (49.7) 14,129 (50.3) 10,546 (46.9) 11,956 (53.1) <.001
Race, n (%) White Black Other 33,619 (66.5) 15,695 (31.0) 1,265 (2.5) 18,813 (67.0) 8,445 (30.1) 819 (2.9) 14,806 (65.8) 7,250 (32.2) 446 (2.0) .63
Primary insurance coverage, n (%) Medicare Medicaid Private Self-pay All others 32,438 (64.1) 2,877 (5.7) 10,329 (20.4) 3,607 (7.1) 1,328 (2.6) 17,531 (62.4) 1,687 (6.0) 6,088 (21.7) 2,097 (7.5) 674 (2.4) 14,907 (66.3) 1,190 (5.3) 4,241 (18.8) 1,510 (6.7) 654 (2.9) .31
Length of stay, d, median (interquartile range) 3.0 (2–6) 2.8 (1.3–5.4) 3.2 (1.7–5.6) .80 Hospital size, n (%)
<100 beds 100–249 beds 250–399 beds ≥400 beds 70 (53.4) 29 (22.1) 15 (11.5) 17 (13.0) 22 (36.7) 11 (18.3) 12 (20.0) 15 (25.0) 48 (67.6) 18 (25.4) 3 (4.2) 2 (2.8) <.001
Hospital location, n (%)c Metropolitan Nonmetropolitan 62 (47.3) 69 (52.7) 40 (66.7) 20 (33.3) 22 (31.0)
49 (69.0) <.001
Calendar year, n (%) 2006 2007 2008 2009 12,331 (24.4) 12,959 (25.6) 12,849 (25.4) 12,440 (24.6) 4,743 (16.9) 7,175 (25.5) 7,972 (28.4) 8,187 (29.2) 7,588 (33.7) 5,784 (25.7) 4,877 (21.7) 4,253 (18.9) <.001
No. (%) of deaths Discharge 30 days 365 days End of follow-up
1,940 (3.8) 4,114 (8.1) 9,350 (18.5) 14,699 (29.1) 1,000 (3.6) 2,105 (7.5) 4,740 (16.9) 7,281 (25.9) 940 (4.2) 2,009 (8.9) 4,610 (20.5) 7,418 (33.0) .08 <.001 <.001 <.001 Abbreviation: GCASR, Georgia Coverdell Acute Stroke Registry; SD, standard deviation.
a: Non-GCASR hospitals are those that never participated in GCASR from 2006 through 2009. b: χ2 and Wilcoxon tests were applied for nominal and quantitative variables, respectively.
26
Table 5. Relative risk for death for Georgians with acute ischemic stroke, Georgia Hospital Discharge Data, 2006–2009, and Georgia Mortality Data, 2006–2010
Characteristic
Hazard Ratioa in the First Year Post Stroke Admission
Estimate (95% CI) P-Valueb
Location of treatment
Hospital not participating in GCASR Hospital participating in GCASR
1.14 (1.03–1.26) 1 [Reference] .01 Sex Male Female 0.93 (0.89–0.98)
1 [Reference] .004
Age group, y ≥80 65–79 45–64 <45 5.45 (4.53–6.56) 2.18 (1.83–2.62) 1.34 (1.14–1.57) 1 [Reference] <.001 <.001 <.001 Race Other White 1.03 (0.96–1.11) 1 [Reference] .36
Primary insurance coverage Medicaid Private Self-pay All others Medicare 1.06 (0.94–1.19) 0.75 (0.67–0.84) 0.62 (0.51–0.75) 0.91 (0.80–1.19) 1 [Reference] .35 <.001 <.001 .84
Length of stay, d 1.017 (1.013–1.022) <.001
Hospital size, n (%) <100 beds 100–249 beds 250–399 beds ≥400 beds 1.17 (1.02–1.33) 1.04 (0.92–1.18) 1.05 (0.91–1.21) 1 [Reference] .02 .54 .48
Hospital locationc
Nonmetropolitan Metropolitan 1.11 (1.03–1.21) 1 [Reference] .009 Calendar year 2006 2007 2008 2009 1.09 (1.02–1.18) 1.09 (1.02–1.17) 1.02 (0.95–1.09) 1 [Reference] .02 .007 .64
Abbreviation: CI, confidence interval; GCASR, Georgia Coverdell Acute Stroke Registry. a: Adjusted for comorbidities.
b: χ2 and Wilcoxon tests were applied for nominal and quantitative variables, respectively.
27
CHAPTER III
Quality of Care and Its Impact on One Year Mortality: the Georgia Coverdell Acute Stroke Registry
Abstract
Introduction
Although performance measures to monitor the quality of acute stroke care exist, their
utility in measuring long-term outcomes is uncertain. This study assessed the 1-year mortality of
acute ischemic stroke patients cared for by hospitals participating in the Georgia Coverdell Acute
Stroke Registry.
Methods
The 2008-2013 Georgia Coverdell Acute Stroke Registry data were linked with hospital
discharge and death data using both hierarchical deterministic and probabilistic linkage
procedures. Delivery of care components related to ten nationally-approved performance
measures were used to define whether patients received quality care. Defect-free care and
composite measure methods were used to measure the quality of care. A generalized estimating
equation was applied, accounting for correlation at hospital level and taking hospital as a random
variable to assess the effect of quality of care on 1-year mortality.
Results
“Defect-free care” was positively associated with increased mortality; however, it was
28
received the lowest and intermediate quality care, respectively, had a 3.94 (95%CI: 3.27, 4.75;
p-value <0.0001) and a 1.38 (95%CI: 1.12, 1.62; p-p-value=0.002) times higher odds of dying in one
year compared to those who got the best quality stroke care.
Conclusion
Data from the Georgia Coverdell Acute Stroke registry suggest that the defect-free care
measure is not helpful in assessing the impact of quality improvement activities. However, the
composite measure indicated that hospitals should be encouraged to implement quality
29
INTRODUCTION
A wealth of scientific evidence shows that improvement in specific elements of clinical
stroke care could result in better patient outcomes.33 The Centers for Disease Control and
Prevention (CDC), the American Heart Association, and the Joint Commission have identified
ten specific elements of clinical care and developed associated indicators (Table 6) to measure
the quality of stroke care.32,33 Not every component of stroke care is indicated for all stroke
patients; rather, patients receive care based on their specific needs. A patient who received all
indicated care components is said to have had a “defect-free care,” an indicator that helps to
monitor progress in the quality of stroke care delivery.
The Georgia Coverdell Acute Stroke Registry (GCASR) was established by the Georgia
Department of Public Health, in collaboration with its partners and funded by CDC, to measure,
monitor, and improve the quality of acute stroke care across the state. Hospitals participating in
GCASR have shown significant improvement in the process of stroke patient care and delivery
of defect-free care.34,36Nevertheless, improvement in the process of care delivery may not
necessarily translate into improvement in patient outcomes.24-26 Hence, the objective of this study
was to assess whether quality improvement as measured by defect-free care or a composite
measure is associated with improved short- and long-term outcomes among acute ischemic
30
METHODS
Data Sources and Linkage
This is a retrospective cohort study of acute ischemic stroke patients cared for by
GCASR-participating hospitals during 2008-2013. We used three data sources – the GCASR
data, the Georgia Discharge Data System (GDDS) and the Georgia death data. We linked the
GCASR and GDDS data using a hierarchical deterministic linkage procedure (sensitivity 87%
and positive predictive value 96%); the output was then linked with the death data applying a
probabilistic linkage approach (sensitivity 92% and specificity 100%). The probabilistic linkage
procedure and its yield is described previously68, and details on the deterministic linkage
procedure are provided as Annex. The Fine-Grained Record Integration and Linkage software
program version 2.1.5 was used to link the three data sources were linked stepwise using.42
Patients from the stroke registry with clinical diagnosis of acute ischemic stroke in 2008–
2013 were included in this study. We had 45,727 records with a clinical diagnosis of acute
ischemic stroke in the initial GCASR data list. Of these, 41,216 were linked with GDDS data but
only 39,331 had the data element critical for linking with the death data. Excluding the
readmissions, we had 36,043 subjects eligible for follow-up, and 35,028 were eligible for, at
least, one evidence-based stroke care component. We excluded from the analysis patients with
undocumented time of symptom onset because 59% of the observations have missing value
31
Defect-free Care Measure
Patients were classified as having had a defect-free care if they received all elements for
which they were eligible as specified by the ten performance measures (Table 6). Defect-free
care does not take into account the number of care components patients are eligible to receive.
Thus, a patient who is eligible for three care components and received all is declared as having
had a defect-free care while a patient who received seven out of eight indicated care components
is identified as not having had a defect-free care.
Composite Measure
A composite measure, taking the proportion of indicated care components a patient
received, is an alternative measure of quality of care.47,69 However, it doesn’t fully account for
the number of indicated care components because delivery of eight out of eight would have the
same composite measure of 100% as providing three out of three. Thus, we weighted the
composite measure by the natural logarithm of the total number of indicated care components.
The care requiring eight elements will have a higher weight [ln(8)=2.0794] than the one with
three indicated care components [ln(3)=1.0986]. Patients were grouped in tertiles based on their
weighted composite measures. Those in the 1st terile with the lowest weighted composite
measure were considered to have had, relatively, the lowest quality of care; those in the 2nd tertile
represented an intermediate and patients in the 3rd tertile represented the best quality of stroke
32
Statistical Analyses
All analyses were done using SAS version 9.3 (SAS Institute, Inc., Cary, NC). Quality
of stroke care as measured by defect-free care or the composite indicator was the main predictor
of outcome. Death from any cause within 365 days from index admission and ambulatory status
at discharge were the outcomes of interest. We classified ambulatory status at discharge into two
groups: unable to walk, and walking with or without assistance from another person. Those who
were not ambulating independently before the stroke event were excluded from the analysis.
Patient’s characteristics such as age, gender, race and insurance status, National Institute
of Health (NIH) stroke scale score, presence of persistent atrial fibrillation or flutter, previous
medical and medication history and nothing per mouth status; event-related characteristics such
as symptom onset to hospital arrival time, day, time and year of admission; and hospital features
including number of beds and location were considered as covariates in the analysis. Based on
their distribution on the basis of number of beds, hospitals were classified as small (<100 beds),
medium-small (100–249 beds), medium-large (250–399 beds) and large hospitals (≥400 beds).
We used the Rural-Urban Commuting Area classification (version 2.0) of location to classify
hospitals geographically into metropolitan (codes 1–3) and nonmetropolitan (codes >3).43 We
assessed patient, hospital and event related characteristics descriptively and tested for differences
between patients who did and did not receive defect-free care using χ2 tests for nominal variables
and Wilcoxon tests for quantitative variables.
Data elements included in the multivariable analyses had missing values in less than 5%
of the observations except for NIH stroke scale which has missing values for 29% of the
33
assuming a general missing pattern and missing at random on data elements included in the
analysis.70 We applied generalized estimating equations (GLIMMIX procedure) to assess the
outcomes controlling for in-hospital correlation and considering hospital as a random variable.
RESULTS
Among the 14,246 acute ischemic stroke patients included in the study, 51.3% were
female, 61.8% were White, and the median age was 69 years (IQR: 58, 80). The three most
common comorbidities were hypertension (82.4%), dyslipidemia (41.1%) and diabetes mellitus
(34.5%). Based on the ten performance measures, 69.1% received defect-free care and on
aggregate patients received 92.8% of the indicated care components. Patients who received
defect-free care had more severe stroke than their counterparts; a relatively higher proportion of
them were also non-ambulating at discharge and died within one year of the incident (Table 7).
Patients with more number of indicated care components were less likely to receive
defect-free care (Figure 2) than those with relatively fewer indicated elements of stroke care.
Moreover, stroke was more severe among patients with fewer indicated care components (Figure
3). Patients with three or fewer indicated care components had a 72.9% 1-year mortality while
those with more than three had a 12.4% 1-year mortality.
The 1-year mortality among patients with a missing value in a predictor variable was
19.1% compared to the 19.7% among those with complete data. On multivariate analyses of the
imputed data, patients who did not receive defect-free care had a 0.87 (95%CI: 0.75, 1.00;
p-value=0.05) lower odds of dying in one year compared to those who received defect-free care.
34
ambulating at discharge. Nonetheless, when quality of stroke care was measured by the
composite indicator, those who received the lowest and intermediate quality of care had higher
odds (OR=3.94; 95%CI: 3.27, 4.75; value <0.0001 and OR=1.35; 95%CI: 1.12, 1.62;
p-value=0.002, respectively) of dying within one year compared to those who received the best
quality stroke care. Furthermore, patients with the lowest and intermediate quality care had
statistically significant 5.7 times (95%CI: 4.59, 7.06; p-value<0.0001) and 3.08 (95%CI: 2.53,
3.75; p-value<0.0001) greater odds, respectively, of not ambulating at discharge compared to
their counterparts. (Table 8). Similar results were also documented on complete data analysis.
DISCUSSION
The result of this study shows that acute ischemic stroke patients who received a quality
care had a better long-term outcome. The odds for dying within one year increased progressively
as the quality of care patients received diminished. Similarly, a statistically significant positive
association was documented between the quality of stroke care and patients’ ambulatory status at
discharge.
Contrary to what is expected, patients who did not receive better care, as measured by
defect-free care, appeared to have better outcomes. They had a 13% and a 42% lower odds of
dying in the first year and non-ambulating at discharge, respectively, compared to those who
received defect-free care. Our analysis further revealed that patients with more severe stroke
were eligible to receive fewer number of care components and were more likely to have
defect-free care. Although we adjusted for measures of disease acuity, including the NIH stroke scale
35
Compared to the all-or-none scoring of defect-free care, the composite measure captured
intermediate level care quality and gave credit for delivery of some, not necessarily all, of the
indicated care processes. It gave equal weight to each care component and presented quality of
care on a continuous scale rather than as a binary outcome. The impact of each care element on
patient outcome, however, may be different and this may require assigning different weights.
This study has some methodological limitations. Fourteen percent of the initial study
subject were excluded because they did not match records from the hospital discharge data.
Obviously this could introduce bias, namely a non-differential bias because record matching was
not related to the quality of care patients received. Patient without documented symptom onset
time were also excluded, and we imputed for missing values, mainly for NIH stroke scale score,
for a third of the study subjects. This may introduce bias as well; however, the 1-year mortality
weren’t different between patients with and without complete data. Despite these limitations, our
findings were also similar in both the complete and imputed data analyses, indicating that the
bias would only be minimal.
Measuring quality of care is an arduous exercise and requires rigorous examination of
what each measure entails. It involves identifying care components that would have effect on
patient outcome, defining the subset of patient groups who would be eligible, establishing
procedures for delivery and documentation of the care component and determining whether an
eligible patient received the care indicated. It is possible that errors could be introduced at any
step of assessing the quality of care delivery. The error gets compounded when measures of
several quality of care components are aggregated in an all-or-none fashion as in defect-free
36
components indicated for a patient. Error in measurement of one care component could affect
partly the aggregate measure of quality of care. Thus, defect-free care, though a stringent
aggregate indicator for monitoring and improving the process of care delivery, is not the ideal
quality measure when the impact of quality improvement initiatives in stroke care is evaluated.
Although each component of stroke care is backed by scientific evidences,33 it is
important to evaluate their effectiveness in the aggregate, in the context of a quality
improvement initiative. To the best of our knowledge, no study has examined the long-term
effects of hospital-based quality improvement initiative in stroke care. This study assessed both
short and long-term outcomes and showed that patients who received better care had a lower risk
of death, a finding which could expand quality improvement activities across hospitals caring for
stroke patients.
Conclusion
Quality improvement initiatives improve not only the process of care delivery but also
patient outcome. Hospitals should be encouraged to undertake quality improvement activities to
measure and monitor the nationally recommended performance indicators in order to improve
37
Table 6. Performance measures endorsed by the CDC, the American Heart Association/American Stroke Association and the Joint Commission
Performance measures
Venous thromboembolism prophylaxis
Administration of antithrombotic medication within48 hours
Anticoagulant medication for patients with atrial fibrillation
Administration of tissue plasminogen activator (tPA)
Dysphagia screening
Antithrombotic medication atdischarge
Prescription of lipid lowering medication
Stroke education
Smoking cessation counseling or treatment
Rehabilitation assessment
[image:46.612.70.541.106.329.2]38
Table 7. Characteristics of acute ischemic patients by defect-free care status, Georgia Coverdell Acute Stroke Registry, 2008–2013
Characteristics Total
Patient Did Not Receive DFCa Patient Received DFCa P-valueb
Age, median (IQR) 69 (58, 80) 68 (57, 79) 69 (58. 80) <.0001
Female, n(%) 7,309 (51.3) 2,291 (52.1) 5,018 (51.0) 0.20
Whites, n(%) 8,808 (61.8) 2,828 (64.30) 5,980 (60.7) <.0001
Medicare health insurance coverage, n(%) 8,497 (59.7) 2,552 (58.1) 5,945 (60.4) 0.01
NIH stroke scale score (unit), median (IQR) 6 (2, 13) 4 (1, 9) 6 (2, 14) <.0001
Atrial fibrillation/flutter, n(%) 2,936 (20.6) 796 (18.1) 2,140 (21.7) <.0001
Nothing per mouth, n(%) 1,323 (9.3) 232 (5.3) 1,091 (11.1) <.0001
Last known well to hospital arrival time
(minutes), median(IQR) 183 (69, 460) 158 (66, 399) 195 (71, 480) <.0001
Hospital bed size, n(%) <100 beds 100–249 beds 250–399 beds >=400 beds 483 (3.4) 2,378 (16.7) 3,424 (24.0) 7,961 (55.9) 307 (7.0) 884(20.1) 1,005 (22.9) 2,200 (50.0) 176 (1.8) 1,494 (15.2) 2,419 (24.6) 5,761 (58.5) <.0001
Day of the week,c n(%) Week day Weekend 10,018 (71.7) 3,958 (28.3) 3,191 (72.6) 1,205 (27.4) 7,097 (72.1) 2,753 (27.9) 0.51
Hour of the day,c n(%) Night Day 5,217 (36.6) 9,029 (63.4) 1,600 (36.4) 2,796 (63.6) 3,617 (36.7) 6,233 (63.3) 0.71
Calendar year, n(%) 2008 2009 2010 2011 2012 2013 1,419 (10.0) 1,656 (11.6) 2,231 (15.7) 2,617 (18.4) 3,088 (21.7) 3,235 (22.7) 911 (20.7) 873 (19.9) 600 (13.6) 651 (14.8) 702 (16.0) 659 (15.0) 508 (5.2) 783 (7.9) 1,631 (16.6) 1,966 (20.0) 2,386 (24.2) 2,576 (26.2) <.0001 Outcome, n(%) Death in 1-Year
Not ambulating at discharged
2,775 (19.5) 1,594 (14.0) 672 (15.3) 303 (8.5) 2,103 (21.4) 1,291 (16.5) <.0001 <.0001
Note:- IQR = Interquartile range; DFC = Defect-free care
a: Defect-free care: delivery of care meeting all quality indicators for which a patient is eligible b: chi-square and Wilcoxon tests were applied for nominal and quantitative variables, respectively. c: refers to the admission day and time
39
Table 8. Relative risk of 1-year mortality and non-ambulating at discharge among acute ischemic stroke patients by quality of care, Georgia Coverdell Acute Stroke Registry 2008-2013.
Performance measure
Complete Data Imputed Data
Death in one year post incident
Not Ambulating at
Dischargea
Death in one year post incident
Not Ambulating at
Dischargea
Odds Ratio
(95%CI) P-value
Odds Ratio
(95%CI) P-value
Odds Ratio
(95%CI) P-value
Odds Ratio
(95%CI) P-value
Received defect-free careb No Yes 0.84 (0.69, 1.02) Referent
0.073 0.67
(0.54, 0.82) Referent
0.0003 0.87
(0.75, 1.00) Referent
0.05 0.58
(0.48, 0.67) Referent
<0.0001
Weighted Composite
Indexc 1st Tertile
2nd Tertile
3rd Tertile
4.10 (3.27, 5.13) 1.28 (1.02, 1.60) Referent <0.0001 6.64 (5.09, 8.66) 3.06 (2.41, 3.89) Referent <0.0001 3.94 (3.27, 4.75) 1.35 (1.12, 1.62) Referent <0.0001 0.002 5.70 (4.59, 7.06) 3.08 (2.53, 3.75) Referent <0.0001 <0.0001
Note:- the estimates are adjusted for age, gender, race and insurance status, National Institute of Health stroke scale score, presence of persistent atrial fibrillation or flutter, previous medical and medication history and nothing per mouth status, symptom onset to hospital arrival time, time, day year of admission, hospital number of beds and location. a: among patients who were ambulating on prior to the stroke incident
b: a patient who received all the indicated care components related to the ten performance measures is labelled to have had a defect-free care
[image:48.612.38.575.107.370.2]40
41
Figure 2. Defect-free care and average composite measure by the number of performance measure acute ischemic patients were eligible for, Georgia Coverdell Acute Stroke Registry, 2008-2013
(DFC (defect-free care): when a patient received all the care components related to the ten performance
measures that are indicated
Composite: the percentage of indicated performance measures a patient received)
Figure 3. Median National Institute of Health stroke scale score by the number of performance measure acute ischemic patients were eligible for, Georgia Coverdell Acute Stroke Registry, 2008-2013
0 20 40 60 80 100
1 2 3 4 5 6 7 8 9 10
Perc
en
t
Number of care components patients are eligible for
Composite DFC
0 5 10 15 20 25
0 1 2 3 4 5 6 7 8 9 10
N
IH
Str
o
ke
S
ca
le
S
co
re
[image:50.612.87.527.413.645.2]