Isotope - Based Material Science
Vladimir. G. Plekhanov
Computer Science College, Erika Street 7a, Tallinn, 10416,Estonia ∗Corresponding Author: [email protected]
Copyright c⃝2013 Horizon Research Publishing All rights reserved.
Abstract
As is well - known isotopes of a given element have identical numbers of protons but differ in the number of neutrons making up their nuclei. Particularly, in crystalline solids, this difference in nuclear mass most directly affects vibrational phenomena, i.e. phonon frequencies and all phonon - related properties. These include exciton binding energy, electronic band gaps, lattice constant, local and crystalline vibrational modes, self - diffu-sion in bulk material as well as isotope superlattices (see, e.g. reviews [1, 2]). The experience of the past shows that throughout constant technology improvement electronics(optoelectroelectronics)has become more reliable, faster, more powerful, and less expensive by reducing the dimensions of integrated circuits. These advantages are the driver for the development of modern microelectronics. The long - term goal of this development will lead to na-noelectronics. Advancing to the nanoscale is not just a step toward miniaturization, but requires the introduction and consideration of many additional phenomena. at the nanoscale, most phenomena and processes are dominated by quantum physics and they exhibit unique behavior. Nanotechnology includes the integration of man - made nanostructures into large material components of system (see, e.g. [3, 4]). Nanoscience and nanotechnology are concerned with materials, structures and systems whose components exhibit novel and significantly modified phys-ical, chemical properties due to the nanoscale sizes. New direction of nanosciene is isotopetronics, who is studied the more low - dimensional size, as a rule the sizes of the sample of isotopetronis compare to the atomic size. Over the last five decades the large number of experimental and theoretical studies of isotopetronics have created the new branch of material science, which is called the isotope - based material science. Isotopetronics may find applications in quantum computing, nanoscience and spintronics. This review contains a brief introduction to the isotope - based material science.Keywords
Isotope, Semiconductor, Insulator, Excitons, Phonons1
Introduction
and chemical exchange [18, 17]. As was indicated above, the main consumers of stable isotopes are pharmaceutical and biomedical industries. Chemicals containing stable isotopes can be kept on the shelf and activated by neutron irradiation shortly before using them in cancer therapy (for instance, 88Sn + n =89Sn, which is radioactive and
has found application in born cancer therapy). Isotopes have also found application in laser industry (He - Cd lasers with isotopically pure Cd produce a strong ultraviolet (UV) line, which is hard to obtain with natural Cd). Many more applications can be found by searching the Web for application of stable isotopes (see, also [16, 17]).
The availability of isotopically pure crystals with low carrier and impurity concentrations has allowed in the last three decades the investigation of isotope effects on lattice dynamical and electronic properties of solids [1, 2]. The results of experimental and theoretical studies of the fundamental properties of the objects of research that earlier were simply in accessible (naturally with exception of LiHxD1−x crystals) briefly are presented in the reviews [1, 2, 19]. The use of such objects allows the investigation of not only the isotope effects in lattice dynamics (elastic, thermal and vibrational properties) but also the influence of such effects on the electronic states via electron-phonon coupling (the renormalization of the band-to-band transition energy Eg, the exciton binding energy EBand the size of the longitudinal-transverse splitting ∆LT). The thermal conductivity enhancement in the isotopically enriched materials amounts (C; Ge; Si) to almost 10% at room temperature and is close to a factor six at the thermal conductivity maximum around 20K (Si - case) (see also [2, 20]). The change in the lattice constant is ∆a/a∼ 10−3 ÷ 10−4, while the changeδcik in the elastic constants amounts to several percent. In addition, crystals of different isotopic compositions possess different Debye temperatures. This difference between a LiH crystal and its deuteride exceeds hundred degrees. Of the same order of magnitude is the difference between Debye temperatures for diamond crystals. Very pronounced and general effects of isotopic substitution are observed in phonon spectra. The Raman lines in isotopically mixed crystals are not only shifted (the shift of LO phonon lines exceeds 100 cm−1) but are also broadened. This broadening is related to the isotopic disorder of a crystal lattice.
It is shown that the degree of change in the scattering potential is different for different isotopic mixed crystals [21]. In the case of semiconducting crystals (C; Ge; Si;α-Sn etc), phonon scattering is weak, which allows one to successfully apply the coherent potential approximation (CPA) for describing shift and broadening of scattering lines in Raman spectra [1, 2]. In the case of LiH, the change in the scattering potential is so strong that it results in phonon localization, which is directly observed in experiments [21, 1].
Substituting a light isotope with a heavy one increases the interband transition energy Eg(excluding Cu -salts) and the binding energy of the Wannier-Mott exciton EB as well as the magnitude of the longitudinal-transverse splitting ∆LT [20, 22]. The nonlinear variation of these quantities with the isotope concentration is due to the isotopic disordering of the crystal lattice and is consistent with the concentration dependence of line halfwidth in exciton reflection and luminescence spectra. A comparative study of the temperature and isotopic shift of the edge of fundamental absorption for a large number of different semiconducting and insulating crystals indicates that the main (but not the only) contribution to this shift comes from zero oscillations whose magnitude may be quite considerable and comparable with the energy of LO phonons. The theoretical description of the experimentally observed dependence of the binding energy of the Wannier-Mott exciton EB on the nuclear mass requires the simultaneous consideration of the exchange of LO phonons between the electron and hole in the exciton, and the separate interactions of carriers with LO phonons (see also [1]). The experimental dependence EB ∼ f(x) for LiHxD1−x crystals fits in well enough with the calculation according to the model of large - radius exciton in a disordered medium; hence it follows that the fluctuation smearing of the band edges is caused by isotopic disordering of the crystal lattice. Due to zero-point motion, the atoms in a solid feel the anharmonicity [23] of the interatomic potential even at low temperatures. Therefore, the lattice parameters of two chemically identical crystals formed by different isotopes do not coincide heavier isotopes having smaller zero-point delocalization (as expected in a harmonic approximation) and smaller lattice parameters (an anharmonic effect). Moreover, phonon -related properties such as thermal conductivity, thermal expansion or melting temperature, are expected to depend on the isotope mass (for details see [1]).
Our brief discussion, we start with a fact that phonon frequency are directly affected by changes of the average mass of the whole crystal or its sublattice (VCA - model), even if we look upon them as noninteracting particles, i.e., as harmonic oscillators. The direct influence of the isotope mass on the frequencies of coupled phonon modes may been used to determine their eigenvectors. Secondly, the mean square amplitude⟨u2⟩of phonons depend on
processes are independent of each other one can measure the disorder-induced renormalization by comparison of phonon energies and linewidth of isotopically pure samples with those gained from disordered ones.
The isotopic composition affects the band-gaps through the electron-phonon coupling and through the change of volume with isotopic mass. Although the electronic properties of different isotopes of a given atom are, to a very good approximation, the same, isotope substitution in a crystal modifies the phonon spectrum which, in turn, modifies the electron energy bands through electron-phonon interaction. Measuring the energy gaps in samples with different isotopic composition then yields the difference in the changes of the valence- and conduction band renormalization. The reason for the changes lies in the fundamental quantum-mechanical concept of zero - point motion - the vibrational energy that the atoms in the crystal have, even at low temperatures. If we excite an electron from one electronic state to another, we actually excite the whole crystal. In other words, we move the crystal from a ground state made up of low-energy electrons plus zero-point vibrations to an excited state in which there is one excited electron plus the zero-point vibrations of the crystal. The values of the zero-point energy in the two electronic states are slightly different because the vibrational frequencies depend on the chemical bonding, which is changed by exciting an electron. If the average mass of the vibrating atoms is increased, then the vibrational frequencies will be reduced. As a result, the difference in zero-point motions will be smaller, and the transition energy will therefore increase with increasing mass [1].
Solid materials are often doped, either intentionally or not, and the doping impurities are in many instances dominant factors in the optical spectroscopy of the material. Impurities can introduce electronic levels in the gap (and transitions between these levels) and can localize excitons forming bound excitons. They can also change the phonon spectrum in the material by introducing local vibrational modes, which result in new absorption and Raman transitions [24]. Vibrations of the isotopic mass of the impurity species will have a strong and direct effect in the frequency of the impurity local vibrations modes and may also have a small effecton the electronic binding energies of impurity levels (see, however below). The present review deals primarily with isotopic effect related to the host material and not the impurities. Thus, different characteristics depending on the isotope effect is formed the essence of the isotope - based material science.
2. Electronic band structure
The importance of the electronic theory of solids as embodied in band theory is that it provides us with clear means of understanding how solids may be insulators, semiconductors or metals. This dependence upon whether or not is a Fermi surface. The existence of a Fermi surface produces metallic behavior, whereas at 0K, if the filled electron levels are separated from vacant ones, we have insulating properties. If the separation is large, say≥ 5 eV, the substance remains an insulator at temperature above 0K, whereas semiconducting properties arise if the filled and empty levels lie within 0 - 2 eV of one another [25].
2.1. Insulators
LiH crystal is of NaCl structure type. The simple electronic structure of Li+ and H− ions, having 1s2
configu-ration, gives LiH a special place among the binary crystals and in many aspects allows it to serve as an ideal model for ionic compounds. The spectrum of one-electron states of crystal is determined by the solution of Schrodinger equation for the ’extra’ particle (hole or electron) moving in the averaged field created by all the remaining electrons and nuclei (see, also [22]):[
−~2
2m∆ + V (⃗r)
]
Ψ⃗k(⃗r) = En
( ⃗k)Ψ
⃗
k(⃗r), (1)
where the notation is conventional, and V(⃗r) is the periodic potential. The existing calculation techniques differ in the method of constructing the electron potential V(⃗r), the approximation of the wave function Ψ⃗k (⃗r), the ways of ensuring self-consistency, the reliance on empirical parameters, etc. In particular, two factors are especially important in case of ionic crystals: (1) the inclusion of exchange interaction, and (2) the inclusion of polarization of the electron and ion subsystems of crystal by the extra particle [25].
The one-electron potential of any many-electron system is nonlocal because of the exchange interaction between the electrons. It is very difficult to take this interaction into account. Because of this, the exact potential in the band theory is often replaced by the local potential of the form Vexchange(⃗r)∝α[ρ(⃗r)]1/3, whereρ(⃗r) is the charge density function, and the constant α is selected in the range from 1 (Slater potential [26]) to 2/3 (Cohn-Sham potential) [22].
this theory as the slowest particle in the system - in other words, all the remaining electrons adiabatically follow it. Hence it follows that the inertialess polarization definitely must be included in the calculation of energy spectrum. An important feature of ionic crystals is that the polarization energy Ep is of the same order of magnitude as the bandwidth. Such a correction obviously cannot be regarded as small. In the extreme case of particle at rest, the polarization energy can be calculated by methods of classical electrostatics (the Mott - Littleton method [25]), or by the newer and more accurate technique proposed by Fowler [27]. The value of Epfor AHC found by this method is 2-3 eV for each of the quasi-particles (Ep>0 for electrons, and Ep <0 for holes). This implies that the inclusion of electron polarization will reduce the magnitude of Eg by 4-5 eV [22]. By assumption, the electron bands are displaced rigidly, without changing the dispersion law E(⃗k).
The simple electron structure of lithium hydride (combined with the negligibly small spin-orbital interaction) is very helpful for calculating the band structure: all electron shells can easily be taken into account in the construction of the electron potential. The first calculations of band structure of lithium hydride were carried out as early as 1936 by Ewing and Seitz [28] using the Wigner-Seitz cell method. This method consists essentially in the following. The straight lattice is divided into polyhedra in such a way that the latter fill the entire space; inside each polyhedron is an atom forming the basis of the lattice (Wigner-Seitz cells). The potential inside each cell is assumed to be spherically symmetrical and coinciding with the potential of free ion. This approximation works well for ions with closed shells. The radial Schrodinger equation in the coordinate function Rl(⃗r) is solved within each selected cell, the energy being regarded as a parameter. Then the Bloch function is constructed in the form of expansion
Ψ⃗k(⃗r) =
∑∞
l=0 ∑l
m=−lClm
( ⃗k)Y
lm(θ,φ)Rl(⃗r, E), (2)
where⃗r,θ,φare the spherical coordinates (with respect to the center of the cell); Ylm are spherical functions. The coefficients Clm(⃗k) and the energy E(⃗k) are found from conditions of periodicity and continuity on the bound-aries of the cell. If⃗r1 and⃗r2 are the coordinates of two points on the surface of Wigner-Seitz cell, linked by the
translation vectorR⃗l, then the boundary conditions are [14] Ψ⃗k(⃗r2) = exp
( i⃗k ⃗Rl
)
Ψ⃗k(⃗r1), (3) and
∇nΨ⃗k(⃗r2) = exp (
−i⃗k ⃗Rl
)
∇nΨ⃗k(⃗r1), (4)
where∇n is the gradient normal to the surface of the cell. We see that the method of cells only differs from the problem of free atom in the boundary conditions. Owing to the complex shape of the cell, however, the construction of boundary conditions is a very complicated task, and this method is rarely used nowadays.
The method of plane associated waves (PAW) was used for calculating the band structure and the equation of state for LiH was used in Perrot [29]. According to this method, the crystal potential is assumed to be spherically symmetrical within a sphere of radius ⃗rs described around each atom, and constant between the spheres (the so-called cellular muffin-tin (MT) potential). Inside each sphere, like in the Wigner-Seitz method, the solutions of Schrodinger equation have the form of spherical harmonics; outside the spheres they become plane waves. Accordingly, the basis functions have the form
Ψ⃗k(⃗r) = exp
( i⃗k⃗r
)
θ(⃗r -⃗rs) +∑almYlm(θ,φ)Rl(E, ⃗r)θ(⃗rs -⃗r), (5)
where θ(x) =1 at x≥ 0, andθ(x) = 0 at x < 0. The coefficients alm can be easily found from condition of sewing on the boundary of the sphere. This is an important advantage of the PAW method over the method of cells. The calculations of Perrot [29] are self-consistent, and the local potential is used in the Cohn-Sham form. The correlation corrections were neglected. The method of Corringi-Cohn-Rostocker (CCR method), or the method of Green’s functions, was used for calculating the band structure of LiH in Zavt et al. [30] (only concerned with the valence band) and in Kulikov [31]. Calculation of band structure of LiH in Grosso and Paravicini [32] was based on the wave function used in the method of orthogonalized plane waves (OPW) of the form
Ψ⃗k(⃗r) = exp
( i⃗k⃗r
)
-∑c
⟨
exp
( i⃗k⃗r
) | Xc
⟩
Xc(⃗r), (6) where Xc are the atomic functions of state of the skeleton;
⟨
exp
( i⃗k⃗r
) | Xc
⟩
to the s-band in the method of strong bond (see also [22]). This is surprising, given the strong overlap of the anion s-functions in lithium hydride. The wave functions in this band are almost entirely composed of the Is states of hydrogen ion. Different authors place the ceiling of the band either at point X or at point W of the Brillouin zone. Although in all cases the energies of the states X1 and W1 differ little ( ≤0.3 eV), the question of the actual
location of the top of the valence band may be important for the dynamics of the hole. Different calculations also disagree on the width of the valence band. For example, the width of the valence band in LiH without correlation is, according to Kunz and Mickish [34], Ev = 14.5 eV, and the value of Ev is reduced to one half of this when
correlation is taken into account. This shows how much the polarization of crystal by the hole affects the width of the valence band Ev. According to Perrot [29], the width of the valence band in LiH is 5.6 eV. The density
of electron states in the valence band of LiH was measured in Betenekova et al. [36] and Ichikava et al. [37]. In Betenekova et al. the measurements were carried out with a magnetic spectrometer having the resolution of 1.5 eV, whereas the resolution of hemispherical analyzer used in Ichikawa et al. [37] was 1.1 eV. From experimental data, the width of the valence band is 6 eV according to Betenekova et al., and 6.3 eV according to Ichikawa et al. Observe the good agreement with the calculated value of Ev in this theory. Let us add also that the measured
distribution of the electron density of states in the valence band of LiH exhibits asymmetry typical of s-bands (for more details see Betenekova et al. [36] and Ichikawa et al. [37]). The lower part of the conduction band is formed wholly by p-states and displays an absolute minimum at point X which corresponds to the singlet symmetry state X4. The inversion of order of s and p-states in the spirit of LCAO method may be understood as the result of the
s-nature of valence band. Mixing of s-states of the two bands leads to their hybridization and spreading, which changes the sequence of levels (see also [10] and references there). If we compare the structure of the conduction band with the p-band of the method of strong bond (see, also [39]), we see that the general structure and the sequence of levels are the same except for some minor details (the location of L3level, and the behavior of E(⃗k) in
the neighborhood of Γ15). In other words, the lower part of the conduction band in lithium hydride is very close
to the valence p-band of AHC. The direct optical gap in LiH according to all calculations is located at X point and corresponds to the allowed transition X1-X4. The indirect transition W1-X4 ought to have a similar energy.
According to the above calculations, the energies of these transitions differ by 0.03-0.3 eV. The different values of Eg for LiH obtained by different authors are apparently due to the various methods used for taking into account the exchange and correlation corrections (see above).
Table 1. Calculated energy values of some direct optical transitions in LiH reduced to the experimental value of Eg = 5.0 eV.
Transition 1 2 3,4 5
K1 - K3 6.9 7.5 6.5 6.4
W1- W3 8.0 7.9 7.3 7.4
L1- L’2 9.2 9.6 9.0 9.1
W1- W’2 12.6 14.9 12.2
X1- X’5 12.9 13.8 13.6
K1 - K4 14.7 16.1 15.0
L1- L’3 19.7 20.9 20.7
Γ1- Γ15 24.5 25.3 33.3
As follows from Table 1, the transitions at critical points in the low-energy region form two groups at 7 - 9 and 13-15 eV. Measurements of reflection spectra in the 4 - 25 eV range at 5 K (Kink et al. [38]) and 4 - 40 eV at 300 K throw new light on the results of calculations (see also review by Plekhanov [39]). The singularities occurring at 7.9 and 12.7 eV in reflection spectra are associated in the above papers with the interband transitions W1 -W4
and X1 -X5 respectively.
Figure 1. Band structure of LiH crystal as calculated: [34] - 1; [29] - 2; [33] - 3.
(me)z≃0.8 m0in the direction X - W. Similarly, the mass of hole in the neighborhood of X1is X - Γ in the direction
(me)x ≃0.55 m0 and about the same in the neighborhood of W1. It is assumed that the transverse components
of mh are greater by several orders of magnitude (Zavt et al. [30]). Note also that, according to Baroni et al. [33], the estimated masses of carriers are: mel = 0,121; met = 0,938; mhl= 0,150; mht= 4,304 me, where the subscripts 1 and t denote, respectively, the longitudinal (in the direction Γ - X) and the transverse (in the direction X - W) components. This high anisotropy of masses of electron and hole ought to have resulted in the high anisotropy of the reduced (1/µ= I/me + 1/mh) and the translation (M = me + mh) masses of exciton. This, however, is not the case. Moreover, the study of Plekhanov and Altukhov [40] reveals that with a good degree of confidence one may assume that in the energy range E≤40 meV the exciton band is isotropic and exhibits parabolic dispersion (me= 0.04m and mh= 0.15m). As was shown below, the studies of exciton - phonon luminescence of free excitons and resonance Raman scattering of light in LiH crystals [22] reveal that the kinetic energy of excitons in these crystals is greater than Ebby an order of magnitude exactly because of the very small masses of electron and hole. The last one may indicate that in the metallic phase of hydrogen at the high pressure [22] we can expect the Dirac character of the electronic excitations [41]. We should add that isotope substitution will be very useful method for renormalization of the band - gap energy in graphene - future semiconducting material [41a].
2.2. Semiconductors
Semiconductors may be pure elements like Si (Ge), but may also be compounds (like LiH), for example ZnS, CdS, SiC, Cu2O and GaAs. Their properties are strongly affected by the presence of impurities, defects or
departures from exact stoichiometry. The properties of a perfect crystal of a pure element or perfectly stoichiometric compound are called intrinsic properties, whereas the influences of added impurities or defects give rise to extrinsic properties.
The electronic configuration of a Si atom is 1s22s22p63s23p2 (see, e.g. [42]). When Si atoms form a crystal it can divide their electrons into core electrons and valence electrons as pointed in different textbooks [43, 44, 45,46, 17]. In crystalline Si 1s, 2s and 2p orbitals are completely occupied and form the core shells. The outer 3s and 3p shells are only partially filled. Electrons in these shells are called valence electrons because they are involved in bonding with neighboring Si atoms. The crystal structure of Si at ambient pressure is similar to that of diamond [28]. The tetrahedral arrangement of bonds between a Si atoms (see, e.g. Fig. 4.18 in [46]) and its four nearest neighbors can be understood if one of the electrons in the 3s shell is promoted to the 3p shell so that the four valence electrons form hybridized sp3 orbitals. It is these valence electrons in the outermost shells of a Si atom
that are nearly free. These electrons are not affected by the full nuclear charge as a result of screening of the nucleus by the filled core shells. In the core region the valence electron wave functions must be orthogonal to those of the core.
Consider further the formation of a Si dimer, i.e. a diatomic molecule. Just as in the formation of the H2
molecule, we expect the electron states to interact and form bonding and antibonding levels (see, Fig. 2). As is well - known, the separation into bonding and antibonding levels is the origin of the energy gap in the band structure of solid Si. According this very simple approximation, the lower four bands are filled and the upper four bands are empty [48]. One should note not worry about the detailed shapes of these bands but accept them as solutions of the Schr¨odinger equation in the assumed potential. Using the pseudopotential concept [48], the one -electron Schr¨odinger equation have the next form
[2mp2 + V(−→ri)]Ψk(−→ri) = EkΨk(−→ri), (7)
Figure 2. A schematic picture of bonding and antibonding levels in a silicon dimer
here Ψk(−→ri) is the pseudo - wave - function and V(−→ri) is pseudopotential. The bringing function is a good approximation to the true wave function outside the core region and therefore can be used to calculate the physical properties of the semiconductors which are dependent on the valence and conduction electrons only. The difference in energy between the highest occupied and lowest unoccupied state is indicated as 1.17 eV at 0K. It is to be noted, however, that these limiting states lie at different points within the zone, and this minimum excitation of an electron from the valence to the conduction band demands that it be given crystal momentum equivalent to the difference in the−→k vectors; this is readily obtained in thermal excitation by the crystal momentum available from the phonons (see, Fig. 3).
Figure 3. Electronic band structure of Si calculated by pseudopotential technique. The solid and the dotted lines represent calculations with a nonlocal and a local pseudopotential, respectively (after [48])
semiconductor. Semiconductors are therefore transparent to infrared radiation and become absorbing only when interband transitions are excited. We might therefore expect the band gap to fix the threshold for interband transitions and in this way be readily determined experiment [45]. This would be the case if the band gap were determined by filled and empty states with the same reduced value of−→k ; the absorption of light would then cause a ”vertical” transition and give rise to a sharp edge at~ω = Eg. This is the case for many semiconductors such as CdS, GaAs etc.
In Si (and many other semiconductors), we have seen (Fig. 3) that excitation across the minimum separation of filled and empty states demands a large change in wave vector, and such a transition cannot be initiated by a photon unless it has access to a source of crystal momentum. We should repeat that it is the phonons that provide the required momentum (see, also Fig. 4). We write the conservation laws in the form
Ef - Ei = hν +~ωf,
−→
kf -−→ki = 0 +−→q , (8)
Figure 4. Schematic of two - step transition in the case of the indirect bandgap of material
here −→q and ωf apply to the phonon involved in the transition. Now Ef - Ei = Eg and it is clear that the inclusion of phonons produces an absorption edge at a somewhat lower energy, namely Eg -~ωf. These indirect or phonon - assisted transitions produce only weak absorption compared with that associated with direct transitions (see, e.g. [49]).
3. Excitons
The properties of the electron and the hole are both described by the band structure within the one - electron approximation. in this section we shall go beyond this approximation and consider the effects of electron - electron interaction on the absorption spectra. To simplify the calculation we shall make the following assumptions. We shall include only the Coulombic part of the electron - electron interaction neglecting both exchange and correlation terms. Furthermore, the interaction between the excited electron in conduction band (see, Fig. 3) and those left behind in the now almost filled valence band will be replaced by an electron - hole interaction. Attraction between the electron and the hole causes their to be correlated and the resultant electron - hole pair is known as an exciton [50].
Figure 5. Various possibilities to present the band-structure of homogenous, undoped semiconductor (insulator). 1 - The dispersion relation i.e. the energy E as a function of the wavector−→k, 2-The energy regions of allowed and forbidden states as a function of a space coordinate x and, 3 - the density of states (all curves are schematic ones)
in the papers of Peierls [51] and Slater and Schokley [52]. Problems concerning light absorption by solid state have been considered somewhat differently Wannier [53] and Mott [54]. According to the Wannier - Mott results the exciton is the state of an electron and hole bonded by the Coulomb force. The electron and hole in exciton state are spatially separated and their charges are screened. In the Frenkel papers the excitations localized on the lattice site were described thus, after the Wannier - Mott papers, the excitons became divided into the excitons on the Frenkel (small radius) excitons (for details see [55]) and the Wannier - Mott (large radius) excitons ( [65]). However, a description of the basic difference between these two models is absent [55 - 57]. The experimental discovery (see e.g. Gross [58]) of the Wannier - Mott exciton (see Fig.6) on the hydrogen-like absorption spectrum in the semiconducting crystals was the basis of a new subject - exciton physics (see also Agekyan [59]; Permogorov [60]). The influence of external perturbation (electrical and magnetic fields, uniaxial and hydrostatic deformation) on the optical spectra of the Wannier - Mott excitons (see e.g., Gross [58]) and their energetic characteristics (see also Cardona [61]) has been demonstrated repeatedly. These investigations permitted high-accuracy measurements not only the exciton binding energy but also of their translational mass, values of effective masses of the electron and hole, their g - factors etc. Moreover, the detailed account of the photon - exciton interaction has led to the concept of polaritons (Pekar [62). From the time of the experimental discovery of the Wannier - Mott exciton the problem concerning the interaction of excitons and the crystal lattice has persisted for more than four decades (Haken [63]; Haug and Koch [64]).
Below we briefly consider quantittively the effect of Coulomb attraction on the motion of electrons and holes (see, also [65]) in the vicinity of an M0 critical point of a direct bandgap semiconductor in three dimensions [61].
Further we shall assume the conduction band to be spherical with energy Ee
(−→
ke
)
= Eg + ~ 2k2
e
2me, (9)
where Eg is the band gap, and the corresponding hole energy to be given by Eh
(−→
kh
)
= Eg + ~ 2k2
h
2mh .
∑
(10) Let the Bloch function and the hole be represented by Ψ−→k
e (
−
→re) and Ψ−→
kh (
−
→rh),respectively. As usually we
assume that the Coulomb interaction between electron and hole is weak due to screening by the valence electrons so that the effective mass approximation is valid. We can write the exciton wavefunction Ψ as linear combination of the electron and hole wavefunctions:
Ψ = ∑
−→
ke,−k→h C
(−→
ke,
−→
kh
)
Ψ−→k
e (
− →r
e) Ψ−k→ h (
− →r
h). (11)
Similar of the donor electron (see, e.g. [43, 49]), the electron and hole in an exciton are localized relative to their center of mass, so it is more convenient to express their wavefunctions in terms of Wannier functions rather than Bloch functions. In terms of the Wannier functions a−R→
e (
− →r
e) and a−→R
h (
− →r
h) for electron and hole, respectively,
the exciton wavefunction can be written as Ψ (−→re,−→rh ) = N−1/2
∑
−→
Re,−→Rh Φ
(−→
Re,
−→
Rh )
a−R→ e (
− →r
e)a−→R
h (
− →r
h) , (12)
whhere Φ
(−→
Re,−→Rh )
is the exciton envelope wavefunction. The wave equation for Φ
(−→
Re,−→Rh ) is [ -( ~2 2me ) ∇2 −→ Re -( ~2 2mh ) ∇2 −→ Rh
- e2
ε0|−R→e -−→Rh|
]
Φ
(−→
Re,
−→
Rh )
= EΦ
(−→
Re,
−→
Rh )
, (13)
where ε0 is the zero - frequency dielectric constant of material (insulators or semiconductors). Equation (13)
Figure 6. Discrete and continuous (hatched area) Wannier - Mott exciton energy spectrum taking into account its kinetic energy. The broken line connects to the dispersion of light in the medium
One expresses −→Re and −→Rh in terms of two new coordinates: a center of mass coordinate −→R and a relative
coordinate−→r defined by
− →
R = −R→eme+−→Rhmh
me+ mh and
− →r =−→R
e
-−→
Rh. (14)
The equation of motion for the center of mass is now decoupled from that for the relative motion because the Coulomb interaction term does not involve( −→R (see, also [49, 65]). The two resultant equations are
−~2
2M )
∇2
− →RΨ
(−→
R
)
= ERΨ
(−→
R
)
, (15)
(−~2µ2∇2−→r -e2
ε0r)ϕ(−→r ) = ERϕ(−→r ), (16) where µ, the reduced mass of the exciton, is defined by
1
µ =
1 me +
1
mh. (17)
The total energy of the exciton E is simply the sum of ER and Er. The solution of (15) and (16) can be
obtained readely. Equation (15) describes a free particle whose eigenfunction and energy are given by ΨK
(−→
R
)
= N-1/2exp
(
i−→K·−→R
)
and ER = ~2M2K2. (18) ERrepresents the kinetic energy of the center of mass motion [65].
Equation (16) is similar to the equation describing the motion of the donor electron [49]. As in the hydrogen atom, its wavefunctions and energies can be described by three quantum numbers: a principal quantum number n, the angular momentum quantum numberl and the magnetic quantum number m. The wavefunctionϕcan be expressed in polar coordinates (r,θ,φ) as
ϕnlm(−→r ) = Rnl(→−r )Ylm(θ,φ), (19)
where Rnl(−→r ) and Ylm(θ,φ) are, respectively, the associated Laguerre polynomials and the spherical harmonic
functions. These functions are tabulated in many quantum mechanics textbooks and therefore will not reproduce here (see, e.g.[ 67]). For isotropic effective masses Er depends on n only and is given by
Er(n) = Er(∞) - R ∗
n2, (20)
where Er(∞) is the minimum energy of the continuum states (see, Fig. 6), i.e. the energy gap Eg and R∗ is
the Rydberg constant for the exciton defined as [66] R∗ = 2µ~2e4ε2
0
= 13.6 ·
(
µ
mε2 0
)
eV. (21)
Φnlm (−→
R ,−→r
)
= (1/√N)exp
(
i−→K·−→R
)
Rnl(−→r )Ylm(θ,φ), (22)
Enlm = Eg+ ~
2K2
2M -R∗
n2. (23)
The energy spectrum of a Wannier - Mott excitons is shown in greater detail in Fig. 6.
The above model of excitons based on electrons and holes with spherically symmetric parabolic dispersion is useful for understanding exciton effects on optical spectra. However, it is not accurate enough for quantitative interpretation of experimental spectra in diamond and zinc - blende - type semiconductors. Of the various attempts to calculate excitonic effects based on realistic band structures, we shall mention the paper [68] (see, also [69]).
4. Exciton - phonon interaction
4.1. Interaction between excitons and nonpolar optical phonons
Foundations of the theory of exciton-phonon interaction were laid in the 1950 s. The interaction between an electron and a nonpolar optical phonon in a crystal can be described simply in terms of a deformation potential (see e.g. [70]). The net effect of the lattice displacement on the electron is assumed to be a small shift in the electronic energy band of the crystal. The constant of proportionally between this energy shift and the lattice displacement is defined as the deformation potential. The exciton-phonon (deformational potential) Hamiltonian can therefore be expressed as [71]
HEP =
√
~
2µNω0
(We−Wh) a ⃗a
+
k++qak
[
bq +b+−q
]
, (24)
where We, Wh denote the deformation potentials of the electron and hole, respectively; a+⃗k, a⃗k - creation and annihilation operators of an exciton with wave vector⃗k;b+−⃗q, b⃗q - creation and annihilation operators of an optical phonon with momentum~⃗q;µ- reduced mass of the atoms in the unit cell; N - number of unit cells in the crystal; a - lattice constant of the crystal; and~ω0is the energy of the optical phonon (see also [61]).
4.2. Polarization Interaction of Free Excitons with Phonon
Apart from pioneering study in [34], interaction of excitons with longitudinal optical phonons was considered by many authors [65, 63, 60, 72, 73]. In ionic crystals there two main mechanisms of interaction of excitons with lattice vibrations. One - mechanism the short-range deformation interaction - is caused by modulation of the wave function of exciton by longitudinal acoustic vibrations. The magnitude of this interaction is characterized by the deformation potential (see above) The deformation interaction strongly affects the energy spectrum and dynamics of excitons of relatively small radius (e.g., the ground state of excitons in AHC and crystals of inert gases [65]. As the radius of exciton increases, this interaction becomes less important, since the wave vector of actual phonons is q∝r−ex1 [74] where rexis the exciton radius, and the number of such phonons is proportional to q3.
The second mechanism - the polarization or Frohlich interaction [75] - is caused by the Coulombian interaction of the charge carriers forming the exciton with macroscopic field created by longitudinal optical oscillations (see e.g. [76, 73]; ). If the exciton radius is much greater than the lattice constant, then the exciton - phonon interaction may be regarded as the sum of independent interactions of electrons and holes with phonons (see [77]). The interaction operator of charge and mass m (me or mh) neglecting the dispersion of the latter is [75]:
Hel = ∑
q
W⃗q exp (iqr)(b+−⃗q+ b⃗q), (25) where
W⃗q = ~ω|⃗qLO|
[4πq2
e,h
V
]1/2
, (26)
V is the volume of the system and the⃗rare the coordinates of the particles. In this expression we introduce the main parameters which determine the interaction of the electron (hole) with optical vibrations: the polaron ”radius”
r∗e,h, =(~2me,hωLO
)1/2
(27) and the dimensionless Frohlich constant of interaction g2 e,h = 1 α ( 1
ε∞
-1
ε0
)
e2
~ωLOre,h∗ (28)
The first of these quantities characterizes the size of the polarization region of the lattice by the extra charge, and the second describes the strength of the electron - phonon interaction (see also [65, 63]).
As follows from Eq. (26), the interaction operator W⃗q does not depend on the mass of quasiparticle, and is the same for electrons and holes. Accordingly, the interaction Hamiltonian of Wannier - Mott excitons with optical phonons has the same form (25), the only difference that exp (iqr) is replaced with exp (iqer) - exp (iqhr), where
⃗re,hare the coordinates of the electron (hole). In the center-of -mass system, the interaction operator becomes [71]: HEXL =∑
q
W⃗q[exp(iqer) - exp(iqhr)]
(
b+−⃗q + b⃗q
)
Replacing me,h by the reduced mass µ by analogy with Eq. (25), we can define the characteristic size of the polarization region rex =
[
(re*)2 + (r∗h)2
]1/2
and the interaction constant g2
ex. Making use of the characteristics of the Wannier - Mott exciton(rex, Eb), one can express the latter as
g2
ex =
(
Eb
~ωLO
)1/2
ε0 ε∞ - 1 =
rex∗ rex
(
ε0 ε∞ - 1
)
, (30)
where rex = a0(εm0/µ),and a0=~2/m0e2= 0.53 ˚A is the Bohr radius of hydrogen atom.
The scattering of excitons by LO phonons is determined by the magnitude and the wavevector dependence of the matrix element
Hλ1λ2EXL =⟨Ψλ1|HEXL|Ψλ2⟩, (31)
where Ψλ1 and Ψλ2 are the wavefunctions of the initial and final states of the exciton with the wavevectors k1
and k2= k1+⃗q. The properties of the matrix element of exciton - phonon scattering, as first noted in [78], depend
crucially on the parities of the initialλ1 and finalλ2 states. If the parity is the same (scattering occurs within the
same band, like 1s - 1s or 2s - 2s, etc., or in the case of interband scattering 1s -2s, 1s - 3s, etc.), this mechanism of exciton - phonon scattering is forbidden, because Hλ1λ2
EXL → 0 when q → 0. When excitons are scattered in a ground state band (1s - 1s) as shown in the paper of Ansel’m and Firsov, the matrix element has the form
Hλ1λ2 EXL ∝
(
gexωLO
rex |q|
) {[
1 + (qerex 2
)2]−2
-[
1 + (qhrex 2
)2]−2}
(32)
When q is small (it is the small values that are of special importance; see below), the matrix element is proportional to
Hλ1λ2 EXL ∝
(
mh- me mh+ me
)
qrex. (33)
As follows from Eq. (33), the Fr¨ohlich mechanism of intraband scattering is absolutely forbidden when the effective masses are equal. This is because the centers of the distribution of masses and charges coincide at me = mh, so the polarization interactions of electrons and holes cancel out completely.
In the general case, the matrix element (32) arrives at maximum near qrex∼1, and then falls off rapidly (Fig. 7). Similar behavior is displayed by the matrix elements of the scattering processes between of the same symmetry (is - js, ip - jp, etc.). In such cases, the matrix element attains its maximum at the value of the inverse radius (rn) of the corresponding exciton state, that is,
[image:11.595.90.512.430.723.2]qmax∼ nr1n, rn = nr1. (34)
Figure 7. Dependence of matrix element of intraband scattering on qrexfor the mass ratio mh/mc= 3.5 (After [1])
According to the results of the paper by Bulyanitza, when scattering occurs between the bands of different symmetry (is - kp) when q →0 the matrix element tends to a constant (nonzero) value, and such processes are therefore allowed. As in our first case, however, the matrix element Hλ1λ2EXL falls off rapidly as q≻r−1
The behavior of matrix elements (32) is definitive for the structure and properties of luminescence spectra of free excitons and Raman scattering in the resonance region. The existing theory of exciton - phonon interaction describes the case of isotropic band with parabolic dispersion of exciton states. Its successful application to LiH (with the high anisotropy of the valence band, see Fig.1 , once again testifies to the fact that the dispersion of the exciton band is indeed parabolic [79] in the range of low kinetic energies of exciton see Fig. 7 in [80]. Let us add that, according to Permogorov [60], the exciton band exhibits parabolic dispersion even for such anisotropic crystal as CdS, which is supported by the successful application of the theory of exciton-phonon interaction to the analysis of luminescence spectra and RRLS of free excitons in CdS crystals
Very recently Zheng and Matsuura [81] have published the paper devoted to electron - phonon interaction in a mixed crystals. They results we are briefly discussed. The total Hamiltonian of an electron - LO - phonon interaction system in a mixed crystal can be written as a sum of a free - electron Hamiltonian, the two - mode LO - phonon Hamiltonian, and the electron - phonon interaction Hamiltonian; it is given by
H = 2~m2∇2+∑j=a,b~ωLjaˆ+⃗ kjˆa⃗kj +
∑
j= a,b ∑
⃗ki
√
e2~ωLj
2V¯εjεok2
(
ˆ
a+
−⃗kj+ ˆa⃗kj
)
ei⃗k⃗r, (35)
where m is the conduction band mass of the electron. This problem is analogous to that of the polaron in polyatomic crystals [82]. Here they considered the first terms in Eq. (35) as the unperturbed Hamiltonian H0,
and the last term as a perturbation HI. The energy of the system is calculated by the perturbation method. Let
|⃗q,0>denote the zero - order wave function. The corresponding zero - order energy is E0(⃗q) =~2q2/2m. The first
- order correction is obviously zero, that is,⟨⃗q,0|HI|⃗q,0⟩= 0. The second - order correction can be written as E”(⃗q) =∑j= a,b∑⃗k |⟨
⃗
q-⃗k, lj⃗k|HI|⃗q,0⟩|
2
E0(⃗q) - E0(q⃗-⃗k)-~ωLj
(36) with
⟨⃗q -⃗k, lj⃗k|HI|⃗q,0⟩
2
= e2~ωLj
2V¯εjεok2. (37)
Following the same procedure as Wang and Liang [83], Zheng and Matsuura replaced the sum over⃗k by an integral in⃗kspace, then they obtain
E(q⃗) = ~22mq2 +∑j= a,b e2~ωLj 8π2¯ε
jεo
∫∞
o
dksinθdθ
(~2/2m)(2kqcosθ- k2) -~ω
Lj. (38)
We restrict ourselves to the energy range~2q2 /2m <~ω
Lj and expand the integrand in Eq. (38) for small q. The polaron energy is given by
E(q⃗)≈ ~22mq2 -∑j= a, bαj
[
~ωLj + ~ 2q2
12m
]
= -∑j= a,bαj~ωLj + ~ 2q2
2m∗, (39) with
αj = e 2
8π2¯ε
jεo
[ 2m
~3ω
Lj
]
, j = a,b (40) m∗ = m[1 - αa+αb
6 ]−1
[image:12.595.40.516.263.685.2], (41)
Figure 8. Concentration dependence of the Fr¨ohlich constantsαa (dotted line),αb(dashed line) andαa+αb(full line) of several mixed crystals (After [81])
whereαa andαb are the Frohlich electron - phonon coupling constant of two LO - phonon modes in the mixed crystal, respectively; m∗ is the polaron mass. The Frohlich coupling constant αa and αb and the total Frohlich coupling constant (αa +αb) as functions of the composition x are shown in Fig. 8. The polaron energy shift
αa~ωLaand αb~ωLb and the total polaron energy shift (αa~ωLa+αb~ωLb) as function of the composition x are plotted in Fig. 9.
Figure 9. Concentration dependence of the polaron energy shiftαa~ωLa(dotted line),αb~ωLb (dashed line), and the total polaron energy shiftαa~ωLa+αb~ωLb (full line) of several mixed crystals (After [81])
αa~ωLaandαb~ωLb also show a nonlinear feature, but the total polaron energy shift shows approximately a linear relation with the concentration x. These theoretical results strongly support the linear interpolation approximation used by many experimenters to estimate the Frohlich constants and the polaron energy shifts of weak - coupling mixed crystals (see, e.g. [84, 85]). The results of Zheng and Matsuura are very different from theoretical results of Wang and Liang [83], where the expressions of the displacements of the two LO - phonon modes and the electron - phonon interaction Hamiltonian are not entirely correct.
In fact the sentence ”the total Frohlich coupling constant (αa +αb) is almost exactly linear function of the concentration x” implies that αa(x) + αb(x) ≃ xα1 + (1 - x)α2, where α1 and α2 are the Frohlich coupling
constants of the two end members of the mixed crystal, respectively (see, however [39]). Theoretical calculations are too complex to see this result transparently. At the end we should noted that the theoretical results of Zheng and Matsuura are correct in the case of a weak - polar mixed crystal (αa +αb)≤1.
5. Isotope affects on the electronic excitation
5.1 Semiconductors - small isotope effect
In this section we will briefly discuss of the variation of the electronic gap (Eg) of semiconducting crystals with its isotopic composition. In the last time the whole raw of semiconducting crystals were grown. These crystals are diamond [86, 87], copper halides [88, 89], germanium [90, 91], silicon [92, 108 - 110], CdS [ 93, 93a] and GaAs [88]. All numerated crystals show the dependence of the electronic gap on the isotope masses.
Before we complete the analysis of these results we should note that before these investigations, studies were carried out on the isotopic effect on exciton states for a whole range of crystals by Kreingol’d and coworkers (see, also [1]). First, the following are the classic crystals Cu2O [94] with the substitution16O→18O and63Cu→65Cu.
Moreover, there have been some detailed investigations of the isotopic effect on ZnO crystals (Fig. 10), where Eg was seen to increase by 55 cm−1 (16O→18O) and 12 cm−1 ( at 64Zn →68Zn) [95, 97, 98]. In [96] it was shown
that the substitution of a heavy 34S isotope for a light32S isotope in CdS crystals resulted in a decrease in the
exciton Rydberg constant (Eb), which was explained tentatively [99] by the contribution from the nearest electron energy bands, which however are absent in LiH crystals (see also [39]).
Figure 10. The reflection spectrum of65.4Zn16O crystal (solid line) and65.4ZnO16 18
0.67 O0.33crystal dashed line)(After [98])
exciton edges consistent with those reported by Kreingol’d et al. [96], but, contrary to their results, Meyer et al. observed essentially identical shifts of the free exciton excited states, as seen in both reflection and luminescence spectroscopy. The reflectivity and photoluminescence spectra i polarized light (−→E ⊥−→C) over the A and B exciton energy regions for the two samples depicted on the Fig. 10. For the−→E ⊥ −→C polarization used in Fig.10 both A and B excitons have allowed transitions, and therefore reflectivity signatures. Fig. 11 also reveals both reflectivity signatures of the n = 2 and 3 states of the A exciton as well that of the n = 2 state of the B exciton (see, Fig. 12). Meyer et al. summarized the energy differences ∆E = E (Cd34S) - E (CdnatS), of a large number of bound exciton and free exciton transitions, measured using photoluminescence, absorption, and reflectivity spectroscopy, in CdS made from natural S (CdnatS, 95% 32S) and from highly isotopically enriched 34S (Cd34S, 99% 34S) (see
Table 2).
Table 2. The energy shifts of all of the transitions studied in [93a] are given in terms of the Cd34S minus the
CdnatS energy, ∆E.
Transition Method ∆E (cm−1)
I2 PL 10.6±0.1
Iz
2 PL 11.1±0.1
Ia
2 PL 10.6±0.1
An=1 (Γ6) A∥ 10.8±0.2
An=1 (ΓL5) PL 11.0±0.2
An=1 (ΓL5) R⊥ 10.9±0.2
An=2 PL∥ 11.3±0.4
An=2 PL⊥ 11.1±0.4
An=2 R⊥ 10.2±0.5
An=3 PL∥ 11.8±1.1
An=3 PL⊥ 10.9±0.6
An=3 R⊥ 10.7±0.6
Bn=1(Γ1) R∥ 10.9±0.3
Bn=1(ΓL5+ΓT5) R⊥ 10.6±0.4
Bn=2 R∥ 9.4±1.2
Bn=2 R⊥ 9.8±1.2
Cn=1(Γ1) R∥ 15±6
Cn=1(Γ5) R⊥ 14±5
The methods used were photoluminescence spectroscopy (*PL) and reflection spectroscopy (R). For measure-ments made using polarized light, the∥ or⊥specifies the orientation of the Evector vs the c axis.
As we can see, all of the observed shifts are consistent with a single value, 10.8±0.2 cm−1. Several of the donor
Figure 11. Photoreflectance of (a)112CdS and (b)natCdS at 6K. The assignment of the spectral features to various components of the series of A and B excitons is indicated. (After Zhang et al [93a])
[image:15.595.100.509.491.753.2]which differ from each other by more than the relevant uncertainties, although all agree with the 10.8±0.2 cm−1
average shift. These small differences in the shift energies for donor bound exciton transitions may reflect a small isotopic dependence of the donor binding energy in CdS. This value of 10.8±0.2 cm−1 shift agrees well with the
value of 11.8 cm−1 reported early by Kreingol’d et al. [96] for the Bn=1 transition, particularly when one takes
into account the fact that enriched32S was used in that earlier study, whereas Meyer et al. have used natural S in place of an isotopically enriched Cd32S.
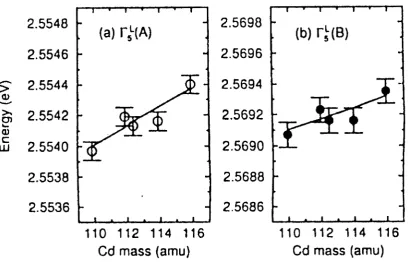
Authors [93a] conclude that all of the observed shifts (see Table 2) arise predominantly from an isotopic dependence of the band gap energies, and that the contribution from any isotopic dependence of the free exciton binding energies is much smaller. On the basis of the observed temperature dependencies of the excitonic transitions energies, together with a simple two-oscillator model, Zhang et al. [93a] earlier calculated such a difference, predicting a shift with the S isotopic mass of 950µeV/amu for the A exciton and 724µeV/amu for the B exciton. Reflectivity and photoluminescence study ofnatCd32S andnatCd34S performed by Kreingol’d et al. [99] shows that
for anion isotope substitution the ground state (n = 1) energies of both A and B excitons have a positive energy shifts with rate of ∂E/∂MS = 740 µeV/amu. Results of Meyer et al. [93a] are consistent with a shift of ∼710
µeV/amu for both A and B excitons. Finally, it is interesting to note that the shift of the exciton energies with Cd mass is 56µeV/amu [96], an order of magnitude less than found for the S mass.
The electronic band structures of semiconductors with a diamond or zinc-blende crystal lattice have a degenerate valence-band maximum for light and heavy holes at the center of the Brillouin zone (⃗k = 0, Γ point) as well as a split-off valence band with its maximum at the same location in k space. Three conduction-band minima are observed at the high-symmetry points Γ, L, and X. The lowest energy conduction-band minimum occurs in Ge at the L point and in Si near the X point, forming indirect band gaps in these two elemental semiconductors. The width and the character (direct or indirect) of this lowest energy gap is of paramount importance for a large number of semiconductors properties and in turn for all semiconductor devices. Because of this great significance there exists a strong interest in all effects which influence the band structure.
Figure 13. Transmission spectra of76Ge (1) and72Ge (2) in the vicinity of the indirect excitons transitions at 1.7 K. (After [90])
however [102]). The rate of band-gap energy change with isotope mass as determined by Davies et al. [101] is dEIG/dA = dEN P/dA = 0.35±0.02 meV/amu. (42)
Etchegoin et al. [100] obtained a very similar value.
Figure 14. Energies of the no-phonon lines of excitons bound to Cu acceptors (squares) and P donors (circles) (After [101])
The contribution to the band-gap shift originating in the volume change can be estimated using the results of Buschert et al. [103] for lattice-constant change with isotope mass and the published dependence of EIG with volume [104]. They found
(dEIG/dA)vol = 0.132 meV/amu. (43)
This is the smaller contribution to the experimentally determined energy-gap change with isotope mass. It is in reasonable agreement with the earlier estimates of Agekyan et al.
The main contribution to dE/dA can be directly related to the change of the energy gap with temperature. This change is described by structure factors which contain electron-phonon interaction terms (Debye-Waller factors) and self-energy terms. For practical calculations these terms are expanded in a power series of the atomic displacements. The leading terms are proportional to the mean-square displacements⟨u2⟩ of each atom. Describing the lattice
atoms in terms of harmonic oscillators, one find⟨
u2⟩=~(12 + n)/M ω. (44)
With increasing temperature both n and ⟨u2⟩ increase, leading to the observed reduction of the energy gap. At low temperature n = 0 and we only deal with the zero-point oscillation. Combining the dependence ofω on M with the above equation one find⟨
u2⟩∝1/√M. (45)
Figure 15. Atomic mass dependence of the indirect gap Eg of Ge at T = 6 K (After [107])
Measurements of the direct band gap at the Γ point (⃗k = 0) in the Brillouin zone have also been performed. Though the direct band gap is technologically less important than the minimum indirect band gap, determining the dependence of this gap on isotope mass is of the same fundamental significance as the indirect band-gap studies. Davies et al. [101] used low-temperature optical-absorption measurements of very thin samples of Ge single crystals with natural composition and three different, highly enriched isotopes. They found
dE/dA = 0.49±0.03 meV/amu (46)
for the temperature extrapolated to zero. Parks et al. [107] have used piezo- and photomodulated reflectivity spectra of four monoisotopic and one natural Ge crystals. These techniques do not require the extreme sample thinning which is necessary for optical-absorption measurements and the derivative nature of the spectra emphasizes the small changes. The excellent signal-to-noise ratio and the superb spectral resolution allowed a very accurate determination of the dependence of EDG on isotopic mass (Fig. 16). At very low temperatures an inverse square-root dependence accurately describes band-gap dependence:
EDG = E∞DG + C √
M (47).
A fit through five data points yields E∞DG= 959 meV and C = -606 meV/amu1/2. Written as a linear dependence for the small range of isotopic masses, Parks et al. find dEDG/dA = 0.49 meV/amu, in perfect agreement with the results of Davies et al. [101]. Parks et al. also determined the isotope mass dependence of the sum of the direct gap and the split-off valence band (∆0) and find d(EDG + ∆0)/dA = 0.74 meV/amu. The experimental results
can be compared to the Zollner et al. [105] calculations which are found to be of the correct order of magnitude. The theoretical estimates for the contributions of the linear isotope shifts of the minimum, indirect gaps which are caused by electron-phonon interaction, are too large by a factor of∼1.7 and for the smallest direct gap they are too large by a factor∼3.2.
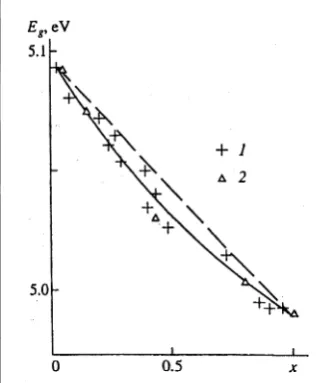
Substitution of 70Ga on the 76Ga increases the band gap in GaAs [88] on 10.5 cm−1 (see, also Table 3). The interested results were communicated in papers of Cardona and coworkers [89], where it was studied the dependence of Eg on the isotope effect in CuCl crystals. When the 64Cu on the65Cu is substituted the value of Eg in CuCl crystals decreased on 1.24 cm−1, e.g. the isotope effect on the electronic excitation has an opposite sign.
The present knowledge of the electronic band structure of Si stems from experimental observation of electronic transitions in transmission, reflectivity, or cyclotron resonance, on the one hand, and theoretical calculations, e.g. those based on pseudopotential or−→k · −→pmethods (for details see [17] and references therein). In this manner it has been established that the fundamental, indirect band gap of Si occurs between the Γ+8 valence band maximum and the ∆0 conduction band minima along (100).
Recently, Lastras-Martinez et al. [92] performed ellipsometric measurements on isotopically enriched28Si and
30Si and deduced the isotopic dependence of E
1from the analysis of the data in reciprocal (Fourier inverse) space.
However, these measurements did not resolve the nearly degenerate E’0and E1 transitions and the isotopic shift
was assigned solely to the stronger E1 transitions (see, however, Fig. 17). We should add that in papers [108]
Figure 16. Isotopic mass (in amu) dependence of the (a) E0 and (b) E0 + ∆0 direct energy gaps obtained from photomodulated reflectivity measurements at T = 6 K. The curves are the best to relation E0 = E∞0 + √CM, where M is the atomic mass and E∞0 is the energy gap at M =∞. The fitting yields E∞0 = 959 meV and C = - 606 meV/amu (After Parks et al [107])
wavelength-modulated transmission spectra displaying phonon assisted indirect excitonic transitions in isotopically enriched 28Si,29Si, 30Si as well as in natural Si have yielded the isotopic gap Egx which equals 1213.8±1.2 meV.
This is purely electronic value in the absence of electron-phonon interaction and volume changes associated with anharmonicity (for details see [92] and below).
Figure 17. a -Signatures of the E0’ and E1excitonic band gaps of28Si observed (dots) in photomodulated reflectivity. The solid line is a theoretical fit using the excitonic line shape. b - Photomodulated reflectivity spectra of isotopically enriched Si exhibiting isotopic shifts of the E0’ and E1gaps (after [108])
Returning to Fig. 17, we can see that the spectrum contains two characteric signatures, attributed to the excitonic transitions across the E’0 and E1 gaps. Isotopic dependence of the E’0 and E1 is displayed in Fig. 17,
where the photomodulated reflectivity spectra of 28Si, 29Si, and 30Si are shown for the spectral range 3.3 ≤ E
≤ 3.58 eV. The E’0 and E1 excitonic band gaps determined in paper [108] from the line-shape analysis. Linear
least-squares fit yielded the corresponding isotopic dependences E’0= (3.4468 - 0.3378 M−1/2) eV and E1= (3.6120
- 0.6821 M−1/2) eV. In concluding, we should note that the spin-orbit interaction depends in Ge in contrast to that
in Si [92].
As is well known ago, the fundamental energy gap in silicon, germanium, and diamond is indirect (see, e.g. Fig. 3). While the conduction band minima in Si and diamond are located at the ∆ point along <100>, with ∆6 symmetry, those of germanium with L+6 symmetry occur at the <111>zone boundaries [92]. The onset of
the absorption edge corresponds to optical transition from the Γ+8 valence band maximum to the L+6 conduction band minima in Ge, and the ∆6 in Si and diamond; for wavector conservation, these indirect transitions require
expect at low temperatures four excitonic derivative signatures at photon energies Egx + ~ω−→q,j in modulated transmission experiments and in photoluminescence at the photon energies Egx-~ω→−q,j. Here Egx is the excitonic band gap and j corresponds to a wave vector preserving phonon (see, also formulae (8)). In Fig. 18a the pho-toluminescence and wavelength - modulated spectra of 30Si M = 2.81 amu) are displayed; the labels n = 1 and 2 designate the ground and the first excited states of the indirect TA and and TO excitons. From the energies of the photoluminescence and wavelength-modulated excitonic signatures in all isotopic specimens (see [92]) cited authors deduce Egx as well as the energies of the participating TO, LO and TA phonons , shown in Fig. 12 - B as function of M−1/2. The excitonic band gap data are fitted well with expression E
gx(M) = Egx(∞) - CM−1/2, yielding Egx(∞) = (1213.8±1.2) meV and C = (313.7±5.3) meV/amu. A linear fit in M can be made over small range of available masses (see, Fig. 18b) with a slope (∂E
gx/∂M)P,T 1.01±0.04 meV/amu, which agrees with the results of bound exciton photoluminescence of Karaiskaj et al. [113]. The experiments in papers [108 - 110] also indicate that separation of the n = 2 and n = 1 excitons is isotope mass independent, implying, according these authors, the excitonic binding energy is independent on isotope mass within experimental error. In concluding this part we should note that recent high - resolution spectroscopic studies of excitonic and impurity transition in high - quality samples of isotopically enriched Si have discovered the broadening of bound exciton emission (absorption) lines connected with isotope - induced disorder as well as the depend of their binding energy on the isotope mass [72, 108 - 110]. The last effect was early observed on the bound excitons in diamond [112, 17], and earlier on the free excitons [114] in LiHxD1−x mixed crystals (see, e.g. [115] and references therein).
Figure 18. A - Photoluminescence (PL) and wavelength - modulated transmission (WMT) spectra of isotopically enriched 30Si recorded at 20K ; B - The excitonic indirect band gap and the associated phonon energies as a function of M (after [109])
Considering the series of Ge, Si, GaAs, ZnSe, CuBr, for example, the 3d states of the first constituent play an increasing role in determining the band structure. In Ge these states can be considered as localized core states (atomic energy level ≈ -30 eV). Already, however, in GaAs they have moved up in energy by 10 eV, and their hybridization with the top of the valence band affects the gap (see e.g. [1] and reference therein). Proceeding further in the series, this effect becomes more important, and in CuBr and Cu 3d states even overlap in energy with halogen p-states, with which they strongly hybridize. Therefore, we cannot exclude that the main reason for the opposite sign of the isotopic effect in these compounds may be connected to the different character of the d-electron-phonon interactions in these semiconductors [22].
The change of the indirect gap of diamond between pure 12C and 13C has been determined by Collins et al.
[86], using for this purpose the luminescence spectra of diamond. The luminescence spectra of the natural (12C )
and synthetic (13C) diamond were investigated by Collins et al. [86], Ruf et al [118]. Fig. 19 compares the edge
luminescence for a natural diamond with that for a synthetic diamond. The peaks labelled A, B and C are due, respectively, to the recombination of a free exciton with the emission of transvers-acoustic, transverse-optic and longitudinal-optic phonons having wavevector±kmin and quanta (in12C diamond) [116, 117]
~ωT A= 87±2,~ωT O = 141±2,~ωLO = 163±1 meV. (48)
Features B2 and B3are further free-exciton processes involving the above TO phonon with one and two
zone-centre optic phonons, respectively.
Boron forms an effective-mass-like acceptor in diamond, and both specimens used in Fig. 19 are slightly semiconducting with uncompensated boron concentrations around 5 · 1016 cm−3 in the natural diamond and 3
![Figure 7. Dependence of matrix element of intraband scattering on qrex for the mass ratio mh/mc = 3.5 (After [1])](https://thumb-us.123doks.com/thumbv2/123dok_us/8788515.908169/11.595.90.512.430.723/figure-dependence-matrix-element-intraband-scattering-qrex-ratio.webp)
![Figure 8. Concentration dependence of the Fr¨ohlich constants αa (dotted line), αb (dashed line) and αa + αb (full line) of severalmixed crystals (After [81])](https://thumb-us.123doks.com/thumbv2/123dok_us/8788515.908169/12.595.40.516.263.685/figure-concentration-dependence-ohlich-constants-dotted-severalmixed-crystals.webp)
![Figure 9. Concentration dependence of the polaron energy shift αaℏωLa (dotted line), αbℏωLb (dashed line), and the total polaronenergy shift αaℏωLa + αbℏωLb (full line) of several mixed crystals (After [81])](https://thumb-us.123doks.com/thumbv2/123dok_us/8788515.908169/13.595.103.508.58.275/concentration-dependence-aawla-abwlb-polaronenergy-aawla-abwlb-crystals.webp)
![Figure 10. The reflection spectrum of 65.4Zn16O crystal (solid line) and 65.4ZnO16180.67O0.33 crystal dashed line)(After [98])](https://thumb-us.123doks.com/thumbv2/123dok_us/8788515.908169/14.595.110.473.61.342/figure-reection-spectrum-crystal-solid-line-crystal-dashed.webp)


![Figure 28. a - First - order Raman scattering spectra Ge with different isotope contents [2] and b - First - order Raman scattering inisotopically mixed diamond crystals 12C13x C1−x](https://thumb-us.123doks.com/thumbv2/123dok_us/8788515.908169/31.595.239.358.64.278/figure-scattering-spectra-dierent-contents-scattering-inisotopically-crystals.webp)
