a Hamilt
on
Lessons learned: How summer camps reduce risk factors of
childhood obesity
by Gretchen L. George, Lucia L. Kaiser and Constance Schneider
The purpose of this article is to present findings related to parent- and youth-reported
outcomes from a nutrition- and fitness-themed summer camp targeting low-income
families and to identify lessons learned in the implementation, evaluation and
sustainability of a summer program. The Healthy Lifestyle Fitness Camp, offered
through UC Cooperative Extension (UCCE), was a summer camp program for
low-income youth at high risk for obesity. From 2009 to 2012, UCCE nutrition staff in Fresno
County collaborated with the camp staff to provide a 6-week nutrition education
program to the campers and their parents. Anthropometry and dietary data were
collected from youth. Data about food preferences and availability were collected
from youth and parents. As reported by parents in pre- to immediately post-camp
surveys, Healthy Lifestyle Fitness campers consumed fruits and vegetables promoted
at camp more often, relative to a comparison group of youth in a nearby non-nutrition
themed camp. Summer programs may be an effective tool in the reduction of
childhood obesity risk factors if implemented appropriately into the community and
through the utilization of supportive partnerships such as UCCE and local parks and
recreation departments.
S
chool-based programs have been successful in improving nutrition knowledge, food preferences, di-etary intake and body weight outcomesin youth (Healthy Study Group et al. 2010; Scherr et al. 2013). However, youth can relapse to inactive, less healthy lifestyles over summer vacations when the days
have less structure and access to school and summer food program meal service is limited (Hopkins and Gunther 2015; Tovar et al. 2010). Especially among over-weight or obese African-American and Latino youth, body mass index (BMI) gains are greater over summer vacations compared to the school year (Downey and Boughton 2007; von Hippel et al. 2007).
Among youth 2 to 19 years of age, prevalence of overweight and obesity is highest among boys and girls who are Hispanic (38.9%) and non-Hispanic African-American (35.2%) and lowest in non-Hispanic white (28.5%) and Asian (19.5%) youth (Ogden et al. 2014). Obese youth are more likely than non-obese youth to be exposed to bullying and to suffer from psychosocial problems (Maggio et al. 2014); they also have in-creased rates of school absenteeism (Pan et al. 2013). Four European longitudinal studies found that childhood obesity persisting into adulthood increases risk of type 2 diabetes, hypertension, elevated blood lipids and atherosclerosis (Juonala
Online: https://doi.org/10.3733/ca.2016a0025 Published online December 15, 2016
Participation in a summer camp that focused on nutrition education and fitness resulted in weight loss and a decreased waist-to-height ratio.
Research Article
et al. 2011). However, obese youth who achieve a healthier weight in late child-hood into adultchild-hood have the same level of risk as individuals who have never been obese.
Furthermore, programs to address prevention and the multiple needs of low-income youth are urgently needed, espe-cially during the summer. Attention has focused on evidence that socioeconomi-cally disadvantaged youth “fall behind” academically over the summer, compared to their more affluent peers (Alexander et al. 2007). In considering options to reduce academic disparities, it is critical to find solutions that promote positive youth development, including health and physi-cal development, as well as social skills. Summer enrichment programs, tailored to meet the needs of high-risk youth, can be a strategy to reduce disparities.
From 2009 to 2012, UC Cooperative Extension nutrition staff in Fresno col-laborated with their community partners to provide a 6-week nutrition education and healthy lifestyle program for youth from low-income families (those eligible for the Supplemental Nutrition Assistance Program) in a summer fitness camp
setting. In this community, a dispropor-tionate share of the low-income popula-tion is African-American or Latino, two groups that also have some of the highest rates of childhood obesity.
The purpose of this article is to present and interpret findings related to parent- and youth-reported outcomes from this nutrition- and fitness-themed summer camp and to identify lessons learned in the implementation, evaluation and sus-tainability of a summer program.
How the fitness camp evolved
In 2008, Fresno’s parks and recreation de-partment piloted a fitness summer camp for the first time. Based on positive feed-back from families, city staff reached out to UCCE in 2009 for assistance in adding a robust nutrition education component to the summer camp for youth at high risk for obesity and their families. Together, they developed the Healthy Lifestyle Fit-ness Camp (HLFC), a 6-week summer day camp focusing on nutrition education and fitness. This was a no-cost program for families who resided in low socioeco-nomic areas of Fresno, were eligible forCalFresh (CDSS 2016) and had overweight or obese youth ages 9 to 14 years old. As determined by a doctor on physical exam-ination, all youth accepted into the study were either overweight or obese based on BMI z-scores or had a family history of obesity or diabetes.
By 2009, the goal of the camp program was to promote a healthy lifestyle ac-cording to the Dietary Guidelines for Americans (USDA and DHHS 2005, 2010) using UCCE nutrition programs, city staff and external exercise programs (e.g., Zumba). Nutrition educators from the UC CalFresh program provided two nutrition classes a week to the campers and one nutrition class weekly to their parents for the duration of the camp. For the campers, UCCE staff selected the EatFit curriculum, which has demonstrated effectiveness in improving dietary and physical activity behaviors among middle school youth in California (Horowitz et al. 2004). The nutrition classes, offered twice a week for 3 hours each time, targeted messages about eating more fruits and vegetables, decreasing sugar-sweetened beverages, eating healthier types of fats (i.e., plant-based fats) and increasing moderate to vigorous physical activity. All classes included a lesson, a hands-on activity and a food demonstration with taste testing of fruits and vegetables. To ensure youth engagement, three educators worked with groups of 18 campers. The camp also pro-vided 3 hours daily of moderate or high intensity physical activities, such as group sports, fitness workouts and a weekly field trip.
Parents received nutrition education and a physical activity component in a weekly class, based on Eating Smart Being Active. This nutrition curriculum has demonstrated effectiveness in low-income families (Baker and McGirr 2012). Key obesity prevention messages were the same for parents and youth. The 6-week parent education culminated in a cook-off event where parents submitted their favorite family recipes for nutritional modification and then prepared it for all the families to taste.
Youth in the Healthy Lifestyle Fitness Camp participated in 3 hours of physical activities, 4 days a week, for 6 weeks.
Sar
a Hamilt
on
Though the camp continued to receive encouraging and constructive feedback from the participants, a more formal eval-uation was lacking. Generating evidence on the effectiveness of the HLFC program was needed to ensure continued commu-nity and external support.
Designing an evaluation
In 2010, a nutrition specialist (LLK) and graduate student (GLG) from UC Davis joined the UCCE team and its community partners to design an evaluation study of the HLFC program with useful and prac-tical indicators and tools. The community partners did not think it was feasible to assign youth randomly to intervention or control groups. Therefore, the UCCE team chose a quasi-experimental approach in which HLFC campers would be compared to similar youth who had been placed on the HLFC waitlist but subsequently enrolled in another day camp not focused on nutrition or fitness.The evaluation tools included surveys for both HFLC and non-HLFC camp-ers and parents. The Parent Nutrition Survey (PNS) was a 41-question survey (in English and Spanish, which was translated into Spanish and then trans-lated back into English to ensure accu-racy of meaning). The parent or caregiver completed the survey before (pre) and immediately after (post) the 6-week camp program. The survey contained questions about household demographic characteristics, youth food intake fre-quency (matched to the 11 fruits and vegetables tasted during HLFC), home food environment and support, and family health history and concerns. This survey was previously validated in multi-ethnic samples of youth, but was not validated in our study sample. Results from the PNS (Cutler et al. 2010) indicated that home food environment and support variables correlated with di-etary patterns of youth. The other evalu-ation tool used was My Food Preference (MFP), a 17-question survey for youth to complete pre- and post-camp. The MFP survey was validated through Kaiser
et al. (2012) and contained questions about the youth’s preference for the same 11 fruits and vegetables and perception of the home food environment. The UC Davis Institutional Review Board (IRB) approved the protocol for the study.
A pilot study among HLFC campers (no comparison group) was conducted in 2010 to test the feasibility of collect-ing these surveys and anthropometric measurements (height, weight and waist circumference) (Kaiser et al. 2012). Upon discussion with UC CalFresh staff, mi-nor edits were made in the wording of questions to improve relevancy to the HLFC population. Based on the pre-post changes in waist-to-height ratio, which is a sensitive indicator of abdominal fat ac-cumulation and metabolic risk (Kuba et al. 2013), the team determined a sample size of 20 per group would be sufficient (using a 0.05 alpha, 0.20 beta, 0.02 delta for waist-to-height ratio).
In 2011 and 2012, the HLFC staff re-cruited campers through local radio bul-letins and school site and after-school program visits. Prior to each camp year, the graduate student conducted a one-day training with the UCCE staff to measure height, weight and waist circumfer-ence for this evaluation study, based on methodology used in National Health and Nutrition Examination Survey (CDC 2011). Staff also learned human subjects procedures to administer surveys to par-ents and youth and reviewed how the nu-trition curriculum activities aligned with
social cognitive theory. The staff was pre-viously trained in using EatFit and Eating Smart Being Active curricula.
The comparison group consisted of youth who had been placed on a wait-list for HLFC but were not enrolled due to the need to maintain the required camper:counselor ratio (10:1). This group attended Fun Camp, another local sum-mer camp consisting of games, crafts and other activities not focused on nutrition and physical activity.
HLFC orientation occurred 2 weeks prior to the start of camp. After the ori-entation, the graduate student explained the evaluation study. Parents and youth read and signed the IRB consent and as-sent forms. If not interested in the evalu-ation study, campers still were allowed to participate in camp. All parents and campers chose to participate (n = 126). Parents signed informed consent forms. All youth received assent letters, and those who were 12 years or older signed consent forms.
Evaluation study challenges
Conducting an evaluation study in a com-munity of youth and their families poses many challenges, including recruitment of participants; collecting and matching data for youth and parents; and especially, follow-up 2 months after the end of the intervention. Combining the summers of 2011 and 2012, the HLFC group consisted of 126 youth and the comparison groupIn addition to nutrition classes and physical activities, the Healthy Lifestyle Fitness Camp offered weekly field trips featuring Yosemite hikes, visits to San Francisco and Santa Cruz, and bike rides.
Sar
a Hamilt
had 29 youth. Immediately at the end of camp (post), there were 111 HLFC and 23 comparison youth among whom anthro-pometric measures were recorded. At the 2-month follow-up, when only dietary, activity and anthropometric data were collected, 45 HLFC and 14 comparison youth remained. Two-month attrition was largely due to communication difficulties
(e.g., undelivered emails and discon-nected phones).
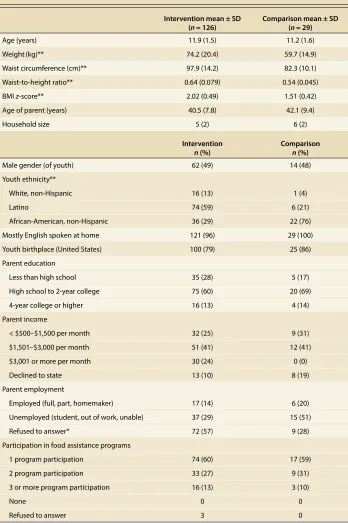
Since it was not possible to assign youth randomly to HLFC or comparison groups, differences between groups were apparent at baseline (table 1). Compared to the HLFC campers, the comparison youth had lower baseline weights, waist circumferences, waist-to-height ratios and
BMI z-scores but still met study inclu-sion criteria, ≥ 85th BMI-for-age percen-tile. Though the youth lived in the same neighborhood, ethnicity also differed: the comparison group was primarily African-American and the HLFC group was primarily Latino. The groups did not dif-fer in gender, language spoken at home, child’s birth country, parent education, in-come, employment status or participation in food assistance programs, though other unmeasured differences may exist.
Camp outcomes
Due to the challenges of recruiting and retaining youth through a 2-month post camp follow-up, the repeated measures analysis of variance procedures controlled for ethnicity and baseline anthropomet-ric values and used an intent-to-treat approach, assuming that youth who dropped out would have returned to baseline measurement values. As re-ported elsewhere (George et al. 2016), participation in the HLFC summer camp, compared to the other camp, resulted in significant pre-post decreases in body weight and waist-to-height ratio after adjusting for baseline anthropometric measurements. Though waist-to-height ratio reductions were maintained at the 2-month follow-up, these findings should be interpreted with caution due to attri-tion and small sample size.
At baseline (pre), youth and their parents (n = 126 dyads) independently assessed their home food environment in the MFP (all completed in English) and PNS surveys (13, or 10%, were com-pleted in Spanish), respectively. Based on Spearman’s correlation, agreement be-tween youth and parent dyads was stron-ger for availability of fruits and vegetables (r = +0.33, p = 0.0001) than for the avail-ability of snack foods, including chips and sodas (r = +0.11, NS). Since the youth were 9 years and older, hours of contact be-tween parent and child may be fewer for this age group than for younger children and may explain the discrepancy in their perceptions on availability of snack foods that might be consumed outside of shared mealtimes.
[image:4.612.54.402.204.727.2]There was a weak but significant relationship between parents’ report of their children’s frequency of consump-tion and youth food preferences for the same 11 fruits and vegetables (figs. 1 TABLE 1. Baseline anthropometric and demographic characteristics of youth in HLFC intervention and
comparison group youth
Intervention mean ± SD
(n= 126) Comparison mean ± SD (n= 29)
Age (years) 11.9 (1.5) 11.2 (1.6) Weight(kg)** 74.2 (20.4) 59.7 (14.9) Waist circumference (cm)** 97.9 (14.2) 82.3 (10.1) Waist-to-height ratio** 0.64 (0.079) 0.54 (0.045) BMI z-score** 2.02 (0.49) 1.51 (0.42) Age of parent (years) 40.5 (7.8) 42.1 (9.4)
Household size 5 (2) 6 (2)
Intervention
n (%) Comparisonn (%)
Male gender (of youth) 62 (49) 14 (48) Youth ethnicity**
White, non-Hispanic 16 (13) 1 (4)
Latino 74 (59) 6 (21)
African-American, non-Hispanic 36 (29) 22 (76) Mostly English spoken at home 121 (96) 29 (100) Youth birthplace (United States) 100 (79) 25 (86) Parent education
Less than high school 35 (28) 5 (17) High school to 2-year college 75 (60) 20 (69) 4-year college or higher 16 (13) 4 (14) Parent income
< $500–$1,500 per month 32 (25) 9 (31) $1,501–$3,000 per month 51 (41) 12 (41) $3,001 or more per month 30 (24) 0 (0) Declined to state 13 (10) 8 (19) Parent employment
Employed (full, part, homemaker) 17 (14) 6 (20) Unemployed (student, out of work, unable) 37 (29) 15 (51) Refused to answer* 72 (57) 9 (28) Participation in food assistance programs
1 program participation 74 (60) 17 (59) 2 program participation 33 (27) 9 (31) 3 or more program participation 16 (13) 3 (10)
None 0 0
Refused to answer 3 0
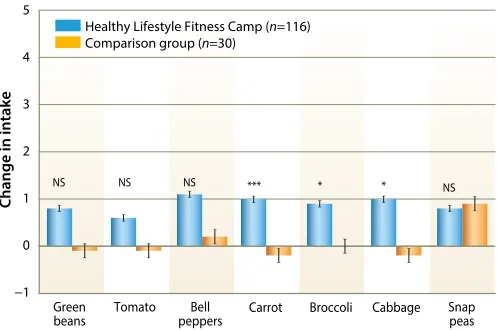
and 2) (r = +0.19, p = 0.01). Especially for fruit, child preference was relatively high but home consumption was infrequent (data not shown), which could potentially be due to limited availability of fruit at home.
At baseline (pre), no differences be-tween the two groups were observed in the frequency of consuming 11 fruit and vegetable items, except for green beans, which were consumed less often in HLFC youth (data not shown). By end of camp (post), parents of HLFC youth reported greater change than comparison parents in their child’s frequency of consuming several fruits and vegetables (figs. 1 and 2). Controlling for ethnicity and baseline waist-to-height ratio, parent-reported change in their child’s total consumption of the 11 fruits and vegetables was greater in HLFC than comparison group youth (p = 0.001, table 2). Change in youth pref-erences for fruits and vegetables did not differ among the groups (data not shown), but most of the youth from both groups liked the items (or were neutral, “it is ok”) at baseline. Lack of statistical power could also be a reason that no significant change in youth preferences were observed, as these variables were not used in our power analysis.
There were no significant post-pre changes in the parent-reported availabil-ity of soda and chips in the home (table 2). However, the availability of fruits and vegetables at home tended to be greater among parents in the comparison group than in the intervention group (after adjusting for ethnicity and baseline
waist-to-height ratio, p = 0.05, table 2). The sample size was too small to explore whether other group differences (besides ethnicity and waist-to-height ratio) might explain this result.
Additionally, both PNS and MFP were not validated in our study but were previously validated in a similar popula-tion. This is a potential limitation to true interpretation of the results. However, taken together, these results may suggest that HLFC youth, compared to controls, began eating more of the fruits and veg-etables that were already available at home and/or that parents might have substituted purchases to buy specific
foods their children requested after camp food tastings.
Lessons for program
managers
This study yields insights for program managers in planning evaluations for programs with youth and parent compo-nents. Program managers should ensure the tools correctly work with the study population. While using validated tools is a good start, additional time is often needed to test existing tools with the study population and make modifications as needed. This testing and modification
TABLE 2. Immediately post camp–pre changes in home environment and total fruit and vegetables
subscales, as reported by the parents of HLFC intervention (n = 126) and the comparison group (n= 29)
Pre-camp
mean ± (SD) mean ± (SD)Post-camp Post-pre campmean Unadjustedp-value*
Adjusted for ethnicity and baseline WHtR
p-value†
Youth frequency of fruit and vegetable consumption‡
Intervention 19.89 (11.1) 28.2 (10.6) 8.28
Comparison 27.07 (14.2) 28.9 (14.5) 1.66 0.01 0.001
Healthy home food environment = fruits and vegetables are available§
Intervention 7.9 (1.8) 8.4 (1.8) 0.4
Comparison 8.2 (1.8) 9.1 (1.2) 0.83 0.04 0.05
Unhealthy home food environment = soda and salty snacks are available§
Intervention 6.9 (1.9) 5.5 (1.9) −1.3
Comparison 6.1 (2.0) 5.8 (2.1) −0.4 0.04 0.07
* ANOVA.
† ANOVA, adjusted for child ethnicity and baseline weight-to-height ratio (WHtR).
‡ Variable is a sum of consumption frequency for 11 fruits and vegetables, including cantaloupe, nectarine, plum, kiwi, green beans, tomato, bell pepper, carrot, broccoli and cabbage. Responses for each item were: 5 = daily or almost daily, 4 = 2–3 times a week, 3 = once a week, 2 = 2–3 times a month, 1 = once a month, 0 = never. Range 0–55 points.
§ Variable is a sum of two items with Likert scale response: 5 = strongly agree, 4 = agree, 3 = neutral, 2 = disagree, 1 = strongly disagree. Range 1–10 points.
Cantaloupe Nectarine Plum Kiwi
Change in intake
0
−1 1 2 3 4 5
Healthy Lifestyle Fitness Camp (n=116) Comparison group (n=30)
** *
NS NS
Change in intake
0
−1 1 2 3 4 5
Healthy Lifestyle Fitness Camp (n=116) Comparison group (n=30)
Green
beans Tomato peppersBell Carrot Broccoli Cabbage Snappeas
*** * *
[image:5.612.303.552.58.223.2]NS NS NS NS
[image:5.612.34.279.60.216.2]Fig. 1. Fruit consumption changes between HLFC and comparison group youth (post‐pre). Post‐pre is difference, based on 0 = never to 5 = daily. Wilcoxon rank sum test: * p = 0.02 (note: mean change for comparison group was 0); ** p = 0.01; NS = not significant. Error bars with SEs.
is likely to be especially important when working in languages other than English.
In delivering family-centered pro-grams, having a very attractive youth component may be helpful in keeping parents engaged. For example, in post-camp focus groups, parents commented that their children were having fun, learning about healthy habits and making friends, which may have been a motivat-ing factor for parent attendance at the par-ent nutrition classes. This made obtaining pre-post surveys from parents easier.
Often the biggest challenge in evalu-ation is designing a comparable control group. Thus, getting sufficient demo-graphic data is essential to control for baseline differences. Additionally, it is important to analyze data as intent-to-treat to avoid any attrition-related con-founding factors. Finally, well-designed evaluation studies cost money and not all expenses are allowable on USDA nutrition program grants. By leveraging program delivery funds with other funds from UC
Davis, community partners and external sources, the evaluation was doable.
Program managers should pay at-tention to fidelity issues and plan for sustainability. First, they need to select agencies and partners who are committed to delivering all the critical components of nutrition and fitness, establishing agree-ments and maintaining good communi-cation throughout the study to parallel health messages. Second, training (and retraining) staff is essential to ensure that delivery consistently promotes behavior change. All who interact with the youth and their parents need staff development to maintain their enthusiasm and commit-ment to the program and behavior change messages. Since a summer camp has the potential to meet multiple needs — physical, academic and social — program managers and partners should focus on developing plans for camp reunions with families and other get-togethers after summer is over. These events may be cru-cial in building the support network for
youth to maintain healthier lifestyles and friendships into the school year.
This research suggests two recommen-dations for summer programming. First, Cooperative Extension, in partnership with local park and recreation depart-ments, can provide summer enrichment programs to low-income students. In California, extension-designed nutrition curricula are aligned with state academic standards, so children can develop their math and science skills, while learning nutrition (Horowitz et al. 2004). Second, summer programs should focus on teach-ing nutrition and physical activity as part of an overall healthy lifestyle according to the Dietary Guidelines. c
G.L. George is Assistant Professor in the Nutrition and Dietetics, Consumer and Family Studies/Dietetics Department at San Francisco State University; L.L. Kaiser is UC Cooperative Extension Nutrition Specialist in the Department of Nutrition at UC Davis (retired); C. Schneider is Director, Youth, Families and Communities, UC Agriculture and Natural Resources (retired).
References
Alexander K, Entwisle D, Olson L. 2007. Lasting conse-quences of the summer learning gap. Am Sociol Rev 72(2):167–80.
Baker S, McGirr K. 2012. Eating Smart Being Active. Edition 2. Fort Collins, Colorado: Colorado State University. [CDSS] California Department of Social Services. 2016. CalFresh eligibility and insurance requirements. www. calfresh.ca.gov/Pg841.htm (accessed February 2016). [CDC] Centers for Disease Control. 2011. National health and nutrition examination survey anthropometry proce-dures. www.cdc.gov/nchs/nhanes/nhanes3/anthropo-metric_videos.htm (accessed October 2015). Cutler G, Flood A, Hannan P, Neumark-Sztainer D. 2011. Multiple sociodemographic and socioenvironmental characteristics are correlated with major patterns of di-etary intake in adolescents. J Am Diet Assoc 111(2):230– 40. doi:10.1016/j.jada.2010.10.052.
Downey D, Boughton H. 2007. Childhood body mass index gain during the summer versus during the school year. New Dir Youth Dev 114:33–43. doi:10.1002/yd.211 George G, Schneider C, Kaiser L. 2016. Healthy Lifestyle Fitness Camp: A summer approach to prevent obesity in low-income youth. J Nutr Educ Behav 48(3) 208–12.e1. HEALTHY Study Group, Foster G, Linder B, et al. 2010. A school-based intervention for diabetes risk reduction. N Engl J Med 363(5):443–53. doi:10.1056/NEJMoa1001933
Horowitz M, Shilts M, Townsend MS. 2004. EatFit: A goal oriented intervention that challenges adolescents to improve their eating and fitness choices. J Nutr Educ Behav 36(1):43–4.
Hopkins LC, Gunther C. 2015. A historical review of changes in nutrition standards of USDA child meal programs relative to research finding on the nutritional adequacy of program meals and the diet and nutritional health of participants: Implications for future research and the summer food service program. Nutrients 7(12):10145–67. doi:10.3390/nu7125523
Juonala M, Magnussen C, Berenson G, et al. 2011. Child-hood adiposity, adult adiposity, and cardiovascular risk factors. N Engl J Med 365(20):1876–85. doi:10.1056/ NEJMoa1010112.
Kaiser L, Schneider C, Mendoza C, et al. 2012. Develop-ment and use of an evaluation tool for taste-testing activities by school-aged children. J Acad Nutr Diet 112(12):2028–34. doi:10.1016/j.jand.2012.07.006 Kuba V, Leone C, Damiani D. 2013. Is waist-to-height ratio a useful indicator of cardio-metabolic risk in 6-10-year-old children? BMC Pediatr 13:91. doi:10.1186/1471-2431-13-91.
Maggio A, Martin X, Saunders Gasser C, et al. 2014. Medi-cal and non-mediMedi-cal complications among children and adolescents with excessive body weight. BMC Pediatr 14:232. doi:10.1186/1471-2431-14-232.
Ogden C, Carroll M, Kit B, Flegal K. 2014. Prevalence of childhood and adult obesity in the United States, 2011-2012. JAMA 311(8):806–14.
Pan L, Sherry B, Park S, Blanck H. 2013. The association of obesity and school absenteeism attributed to ill-ness or injury among adolescents in the United States, 2009. J Adolesc Health 52(1):64–9. doi:10.1016/j.jado-health.2012.04.003.
Scherr R, Cox R, Feenstra G, Zidenberg-Cherr S. 2013. Integrating local agriculture into nutrition programs can benefit children’s health.Calif Agr 67(1):30–7. doi:10.3733/ca.v067n01p30.
Tovar A, Lividini K, Economos C, Folta S, et al. 2010. School’s out: What are urban children doing? The sum-mer activity study of Sosum-merville youth (SASSY). BMC Pediatr 10:16. doi:10.1186/1471-2431-10-16.
[USDA and DHHS] US Department of Agriculture and US Department of Health and Human Services. 2005. Dietary Guidelines for Americans, 2005. 6th ed. http://health.gov/ dietaryguidelines/dga2005/document/ (accessed Janu-ary 2016).
USDA and DHHS. 2010 Dietary Guidelines for Americans, 2010. 7th ed. http://health.gov/dietaryguidelines/ dga2010/dietaryguidelines2010.pdf (accessed October 2015).
von Hippel P, Powell B, Downey D, Rowland NJ. 2007. The effect of school on overweight in childhood: Gain in BMI during the school year and during summer vacation. Am J Pub Health 97(4):696–702.
Sar
a Hamilt