Method development and validation of RP- HPLC in the application of
in-vitro dissolution study of Lamivudine in bulk drug and tablet formulation
D.K.Mandloi1*, P.K.Tyagi2, V.K.Rai2, S. Dey2, R.K Ashada1, P.Mohanraj1 1
Department of Pharmaceutical Sciences, Himalayan Pharmacy Institute, East Sikkim, India 2
Shri RNS College of Pharmacy, Gormi, Bhind, M.P., India
______________________________________________________________________________
Abstract
A new RP-HPLC method was developed for the determination of Lamivudine in the bulk drug and tablet dosage forms and it was applied for the in-vitro drug dissolution studies. Isocratic elution mode with a mixture of methanol and water in the ratio of (89:11) was selected as the
mobile phase with a C18 column (250 x 4.6mm, 5µ) for separation. This mixture was found to be
appropriate allowing good elution for the Lamivudine at retention time 2.72 minute at flow rate of 1 ml/min and detection wavelength at 272nm. The linearity was found in the concentration range of Lamivudine 5-100 µg/ml. The liquid chromatography method was extensively validated for linearity, range, accuracy, precision (intermediate precision, repeatability) and specificity. All these analytical validation parameters were observed and the %RSD was determined which indicates the useful of RP-HPLC method for determination of Lamivudine in the bulk drug & tablets dosage form.
Key words: Lamivudine; Validation; In-Vitro studies; RP-HPLC
______________________________________________________________________________
Introduction
(-)-enantiomer is more resistant to cleavage from nascent RNA/DNA duplexes by cellular 3'-5' exonucleases, which may contribute to its greater potency. [1]
Fig.1. Chemical structure of Lamuvidine
There have been several publications describing analytical methods for the determination of lamuvidine [2-5]. Few methods have been described for the simultaneous determination other antiretroviral drugs in biological samples and pharmaceutical dosage forms [6-18]. Some of the earlier reported methods are having long analysis time (12 min [10], 17 min [17], 50 min [15], 25 min [18], 21 min [2], 30 min [16]) and some methods need liquid-liquid extraction of the sample before injection [19]. These are time consuming and costly methods. No method has been developed and applied to in-vitro pharmacokinetic studies for different classification of antiretroviral drug of Lamivudine by using single method.
Drug dissolution testing is an integral part of pharmaceutical development and routine quality control monitoring of drug release characteristics [20]. The profiles, obtained from dissolution rate studies, have also been used in an attempt to characterize the in-vitro behaviour of drug with success. They have to be performed under precisely specified conditions (i.e; temperature, volume, and stirring rate) that mimic process in the gastrointestinal tract.
The present work reports the development and validation of RP-HPLC for the determination of Lamivudine in bulk drug and tablet formulation and application of this method to in-vitro dissolution studies.
Experimental Section Chemicals
Mobile phase consisted of methanol (SD Fine Chem. Ltd, HPLC grade) and water (Millipore HPLC grade) was used during analysis. For in-vitro dissolution studies was used. Lamivudine reference standard was generous gift from Cipla Pharmaceutical Ltd, Mumbai, India. Lamivudine tablets were procured from the local market lamivir-HBV 100 mg, lamivir 150mg (film coated tablets).
Instrumentation Shimadzu L20AT liquid pump, SPD-20A UV-Visible detector, a Luna 5µ
software were used. Sartorius (CP225D) electronic balance was used for weighing the materials. The dissolution rate studies of Limivudine from tablets were performed on a Veego, VDA-8DR USP dissolution apparatus
Method development
Various solvent systems were tried for the development of suitable HPLC method for the analysis of Lamivudine in the bulk and tablet formulation. The suitability of the solvent system was decided as the basis of the sensitivity of the assay, suitability for stability studies and availability of cost effective solvents.
Preparation of stock solution
Accurately weighed 100 mg of lamivudine standard was taken in separate 100 ml volumetric flasks and dissolved with 70 ml of mobile phase in each volumetric flask and sonicated for 5 min and then mark with mobile phase to get final concentration of 1mg/ml which was considered as stock solutions.
Preparation of standards solution
Standard stock solution was further diluted with mobile phase to obtain the concentration of solution in the range of 5-100 µ g/ml was performed with UV detector for Lamivudine 272nm in 20µl of each prepared solutions were injected with a flow rate of 1ml/min and the peak area were recorded.
Table.1 Calibration values of Lamivudine in standard drug
Concentration µg/ml Peak area (mV.s)*
5 123.881
10 269.736
15 371.494
20 503.710
30 748.583
40 983.960
50 1226.043
80 2006.804
100 2448.166
The operation were carried out in triplicate group was plotted between concentration vs. peak area.
Selection of analytical wavelength
By appropriate dilution of standard stock solution with mobile phase, various concentration of Lamivudine was prepared accurately. The solutions were scanned between the wavelengths range 400-200 nm using the Shimadzu double beam UV visible spectrophotometer in the spectrum mode
Preparation of sample solutions
For the estimation of lamivudine from twenty tablets were weighed separately and powder equivalent to 100 mg of the drugs were accurately weighed and transferred to separate 100 ml volumetric flasks and sonicated for 5 minutes. Volumes were made up to the mark with mobile phase and filtered through 0.45µm filter. The concentrations of sample solution was prepared
and analyzed with UV detection for Lamivudine at 272 nm, with a flow rate of 1ml/min.
In Vitro Dissolution Studies from Tablet Dosage Form
Drug dissolution studies were carried out in 900 ml of 0.1N HCl (pH 1.2, simulated gastric medium) according to the USP 2000 [21] dissolution procedures the single entity products with the use of a USP paddle type of apparatus at a stirring rate of 75 rpm. The temperature of the cell was maintained at 37 ± 0.5ºC. Aliquots of lamivudine were withdrawn at predetermined time intervals at 10, 20, 30, 40, 50, 60, 70, 80, 90, 100, 110 and 120 min replaced with equal volume of pre-warmed 0.1N HCL solution to maintain the sink condition. The sample solutions were diluted with methanol (HPLC grade) and it was analyzed by using methanol and water (89:11%, v/v) ratio and concentrations were determined at 272nm for Lamivudine peaks are given in Figure-3. The retention time of Lamivudine is 2.86 min. The cumulative percentage of drug released in the media was plotted against time in order to determine the release profile from the tablet formulations. The dissolution test data were obtained by averaging three parallel studies. (Table.2)
Time (min.)
Peak areaa
Concentration (x)
Amount in 5ml
Amount in 900 ml
CR %CR
10 374.946b 14.924b 0.746 134.316 134.316 89.544
20 403.805 16.097 0.804 144.873 145.619 97.079
30 398.445 15.879 0.793 142.911 143.715 95.81
40 396.665 15.807 0.790 142.263 143.056 95.370
50 403.521 16.086 0.804 144.774 145.564 97.042
60 400.115 15.947 0.797 143.523 144.327 96.218
70 398.066 15.864 0.793 142.776 143.573 95.715
80 405.272 16.157 0.807 145.413 146.206 97.470
90 405.269 16.157 0.807 145.413 146.22 97.48
100 400.260 15.953 0.797 143.577 144.384 96.256
110 391.241 15.586 0.779 140.274 141.071 94.047
120 395.392 15.755 0.787 141.795 142.574 95.049
a
n= Three times
b
= at concentration and peak area mostly same as compared with developed method
Results and Discussion
Method development:
Effect of incorporating methanol
Methanol is a polar solvent being widely used in RP-HPLC. The primary effects it was found that the retention factor (k) was decreases with increases in the concentration of sample. The peak obtained was broad and showed severe tailing. However the final concentration of methanol was adjusted to achieve a good capacity factor. The chromatogram revealed that with increased in methanol concentration the retention time was reduced. The peak obtained was best acceptable at the methanol concentration of 89%. The peak was found sharp and reproducible
To determine the effect of flow rate, the programmed controller was set at different flow rates 0.5
mL/min, 0.7 mL/min, 0.9 mL/min 1.0 mL/min, 1.1 mL/min, 1.2 mL/min and 1.5 mL/min. operate were performed at each flow rate. The optimum flow rate was also chosen keeping in mind the recommended flow rate for a column with a given internal diameter.
Method validation:
Linearity and range
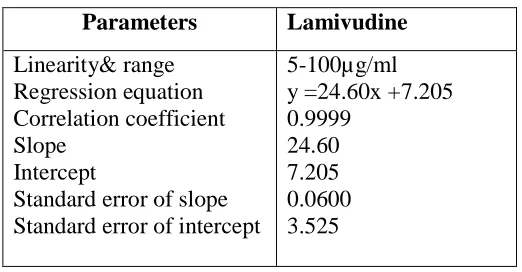
Under the optimized conditions, a calibration curve was used for Lamivudine. Six standard mixtures of different concentrations were prepared. The corrected peaks were used for constructing the calibration graph. Linearity range, regression equation, correlation coefficient, slope, standard errors of slope, standard errors of intercept, are shown in Table 2 The plot of peak area of each sample against respective concentration of Lamivudine was found to be linear
in the range of 5-100 µg/ml, using regression analysis of the linear equation for Lamivudine Y=
24.60x + 7.205 with correlation coefficient of r2= 0.9999. Linearity data obtained from the
[image:6.595.168.429.384.520.2]measurements are given in Table 3.
Table.3 Data for the calibration graphs of Lamivudine
Parameters Lamivudine
Linearity& range Regression equation Correlation coefficient Slope
Intercept
Standard error of slope Standard error of intercept
5-100µg/ml y =24.60x +7.205 0.9999
24.60 7.205 0.0600 3.525
Accuracy
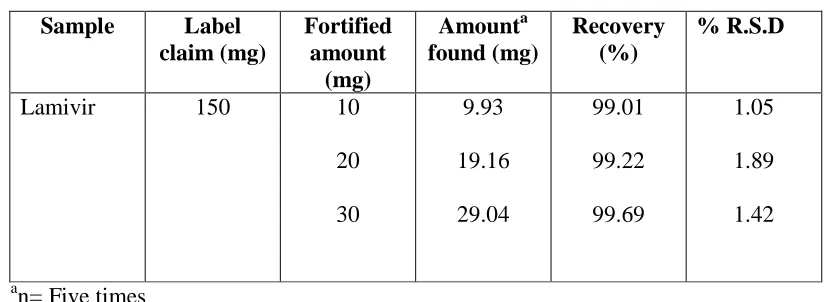
In order to examine the accuracy of the method and to check the interference from excipients used in tablet dosage formulation, the recovery studies were carried out by standard addition method. In this method, three different amounts of Lamivudine were added to a constant known concentration of the composite tablet solution. Each solution was injected five times and the amounts determined were compared to theoretical amounts. The results were summarized in Table 4. The recovery range was found from 99.01 to 99.69 for Lamivudine.The relative standard deviation (% RSD) of Lamivudine 1.42 was observed which indicates that the method gives sufficient accuracy.
Sample Label claim (mg) Fortified amount (mg) Amounta found (mg) Recovery (%) % R.S.D
Lamivir 150 10
20 30 9.93 19.16 29.04 99.01 99.22 99.69 1.05 1.89 1.42 a
n= Five times
Precision
[image:7.595.90.507.138.289.2]Precision of the method was tested by performing intra-day and inter-day studies. For intra-day studies, triplicate of prepared samples were analyzed within same day. For inter-day validation, concentrations were determined on three separate days. The % RSD values obtained from peak area for LAM was observed. It can be seen from Table 5, a good precision was obtained for drug.
Table 5 Intra-and inter-day precision Analyte Concentration
(µµµµg/ml)
Intra- Day
%RSDa (n= 3)
Inter- Day %RSDb
(n= 9) LAM 20 40 80 493.104 970.377 1973.850 0.907 0.513 0.879 504.424 986.628 1960.273 1.052 0.545 0.815 a n=Three times b n=Three days
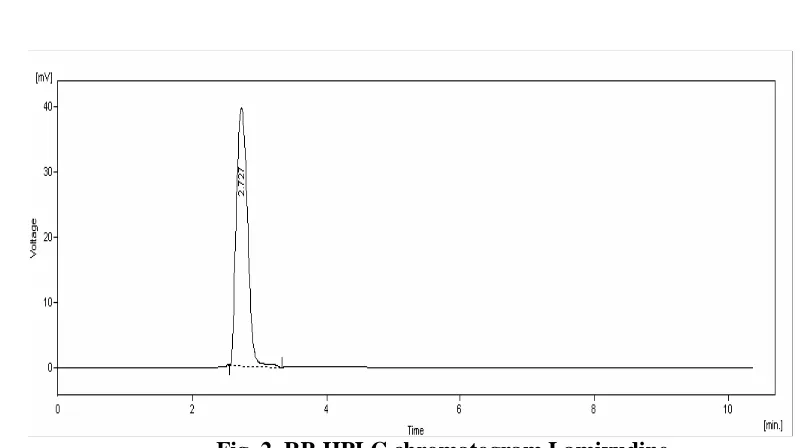
Limit of Detection (LOD) and Limit of Quantification (LOQ)
The limit of detection (LOD) and limit of quantification (LOQ) for Lamivudine was found to be
1.705, 5.16 µg/ml. The typical chromatogram of Lamivudine was shown in Figure 2. A mixture
Fig. 2. RP-HPLC chromatogram Lamivudine
Specificity
The effect of inactive ingredients (placebo) on the determination of the drug in tablet formulation was studied. Each tablet contains 150mg of LAM along with some inactive ingredients, such as titanium dioxide, red oxide, yellow oxide, talc and methyl cellulose. In the chromatogram, no interfering peaks were observed in the region of analytes.
Robustness
Robustness of the method was tested by small but deliberate variations of flow rate, mobile phase and temperature. Effects of variation in the flow rate (±1 ml/min) were studied at three different concentrations and temperatures (±1˚C to ±5˚C) were studied. Effect of variation in the different mobile phase ratio also studied at three different concentrations.
Ruggedness
A different analyst, using a different batch of chemicals, column, tried the method. There was not much variation in results calculated by % RSD. These studies showed that the method is rugged.
System suitability parameter
[image:8.595.108.513.118.342.2]Table.6 System suitability Test for Lamivudine
Parameters LAM
Retention Time 2.7
HETP(mm) 0.022
Tailing factor 1.12
Theoretical plates/m 32247.057
LOD(µg/mL) 1.705
LOQ(µg/mL) 5.16
Applied to the dissolution studies:
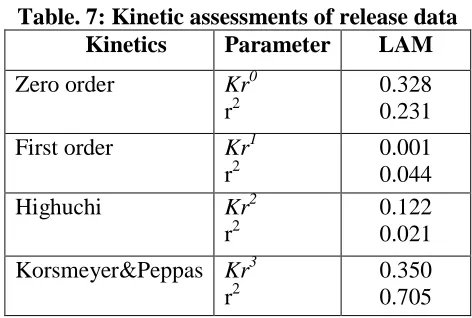
The method was also applied to determine the release rate pattern of the drug from the tablet dosage form of Lamivudine in dissolution rate studies. The release data were evaluated according to different models namely Zero order, First order, Higuchi and Korsmeyer& Peppas function. The regression coefficient values obtained after fitting the dissolution data to various kinetic models is shown in Table 7. The regression value of Lamivudine was found to be following the Korsmeyer-Peppas release pattern following diffusion controlled release of the contained drug.
The assay of Lamivudine tablet was found to be 149.39, & 99.83. The results are given in Table 8 The absence of additional peaks in the chromatogram indicates non interference of the common excipients used in the tablets. Lamivudine was found to give individual identical results when compared to their peak area and peak height when samples were collected and analyzed by developed RP-HPLC method using the same solvent system. Drug release kinetics was determined by analyzing the regression values.
[image:9.595.179.415.549.708.2]
Table. 7: Kinetic assessments of release data
Kinetics Parameter LAM
Zero order Kr0
r2
0.328 0.231
First order Kr1
r2
0.001 0.044
Highuchi Kr2
r2
0.122 0.021
Korsmeyer&Peppas Kr3
r2
The present study indicates the possibility of using the same solvent system for quality control samples and for analyzing the drug release pattern from the tablet dosage forms.
Table. 8: Results of Lamivudine analysis in tablet dosage forms
Sample Label claim (mg)
Amount found
%Recoverya % RSD
Tablet-A
Lamivir 150 149.39 99.59 0.730
Tablet-B
Lamivir-HBV 100 99.83 99.83 0.669
an= Five times
0 20 40 60 80 100 120
0 50 100 150
Time
%
C
R Series1
Fig.4: In-vitro dissolution profile of Lamivudine
Conclusion
quantitative analysis of Lamivudine in bulk drug and tablet formulations. The method does not involve any costly sample extraction procedure in the method which highlights its usefulness in routine quality control testing. In addition, the reported method can also be used for pharmacokinetic studies.
Acknowledgements
The authors are very grateful to the Director, Dr. H.P.Chhetri, Himalayan Pharmacy Institute, East Sikkim, for providing sophisticated facilities to perform this work.
References
[1] Goodmann and Gilman's, The Pharmacological Basis of Therapeutics, 11th Edition.,
Mc-HILL Medical Publishing Division, New York, 2006; 1288-1294
[2] Y Alnouti; CA White; MG Bartlett. Biomed. Chromatogr. 2004, 18, 641-647.
[3] RM Lopez; L Pou; MR Gomez; I Ruiz; J Monterde. J. Chromatogr. 2001, 75, 371-376.
[4] JW Pav; LS Rowland; DJ Korpalski. J. Pharm Biomed. Anal. 1999, 20, 91-98.
[5] TL Laurito; V Santagada; G Caliendo; CH Oliveira; REB Astigarraga; GD Nucci. J. Mass
Spectrom, 2002, 37, 434.
[6] G Ramachandran; AK Hemanthkumar; V Kumaraswami, S Swaminathan. J. Chromatogr.
2006, 843, 339-44.
[7] R Sekar; S Azhaguvel. J. Pharm Biomed. Anal. 2005, 39, 653-660.
[8] N Erk. Pharmazie. 2004, 59, 106-111.
[9] E Marchei; L Valvo; R Pacifici; M Pellegrini; G Tossini; P Zuccaro. J. Pharm Biomed Anal.
2002, 9, 1081-1088.
[10] F Bin; JT Stewart. J. Pharm Biomed. Anal. 2002; 28; 903-908.
[11] S Anbazhagan; N Indumathy; P Shanmugapandiyan; SK Sridhar. J. Pharm Biomed Anal.
2005, 39, 801-804.
[12] RM Hollanders; EBK Van; DM Burger; EW Wuis; PP Koopmans; YA Hekster. J.
Chromatogr B. 2000, 744, 65-71.
[13] HN Mistri; AG Jangid; A Pudage; N Gomes; M Sanyal; P Shrivastav. J. Chromatogr B.
2007, 853, 320-332.
[14] N Kapoor; S Khandavilli; R Panchagnula. J. Pharm Biomed. Anal. 2006, 41, 761-765.
[15] RM Hoetelmans; M Profijit; PL Meenhorst; JW Mulder; JH Beijnen. J. Chromatogr B.
1998, 713, 387-393.
[16] KB Keeney; SA Wring; RM Carr. J. Pharm.Biomed. Anal. 2000, 22, 289-294.
[17] JJ Zheng; ST Wu; TA Emm. J. Choromatogr B. 2001, 761, 195-199.
[18] XJ Zhou; JP Sommadossi. J. Chromatogr B. 1994, 656, 389-396.
[19] G Bahrami; S Mirzaeei; A Kiani; B Mohammadi. J. Chromatogr B. 2005, 823, 213-217.
[20] AB Morrison; JA Campbell. J. Pharm Sci. 1965, 54, 1-8.
[21] The United States of Pharmacopoeia, Easten Rand Mc Nally Taunten, MA. 2000: 24th