Journal of Chemical and Pharmaceutical Research, 2013, 5(2):162-170
Research Article
CODEN(USA) : JCPRC5
ISSN : 0975-7384
Effect of barley (Hordeum vulgare L.) flour incorporation on the baking
quality of wheat (Triticum aestivum L.) flour
A. El Yamlahi
1*, E. Berny
1, A. Hammoumi
2and M. Ouhssine
11
Laboratoire de Biotechnologie, Environnement et Qualité, Faculté des Sciences. Université Ibn
Tofaïl, BP: 133, 14000 Kénitra. Morocco
2
Laboratoire de Microbiologie, Pharmacologie, Toxicologie et Environnement, Faculté des
Sciences. Université Hassan II Casablanca. Morocco
______________________________________________________________________________________
ABSTRACT
Incorporation of barley flour (BF) to wheat flour (WF) at 0, 5, 10, 15, 20, 25, 50 and 100% levels was carried out to test the effect on baking quality. BF is characterized by its wealth in soluble fibers and tocols witch have several health benefits. Methods of analysis focused on the determination of physical-chemical criteria, technological and rheological properties. This study has revealed that the addition of BF affected adversely the various criteria and properties studied. In fact, BF increased the ash content and decreased the Zeleny sedimentation value (ZSV). The effect on the ZSV is highly significant (α = 0.01) for level superior than 10 %. A narrow correlation was noticed (r = -0.994). As for rheological properties, the addition of BF resulted in an increase of dough tenacity (P), decrease in baking strength (W) and extensibility (L). The variation of P and L in two opposite directions ended in an imbalance of alveograms (P/L). The tenacity showed significant difference at 15% above the rate of incorporation, while the baking strength and configuration ratio (P/L) showed significant differences beyond 10% incorporation rate. It may be concluded that the use of BF to improve the content of soluble fiber and tocols, associated with acceptable baking quality, can be incorporated up to a 10% level.
Keywords: wheat flour, barley flour, baking quality, rheological and physical-chemical analysis.
_____________________________________________________________________________________________
INTRODUCTION
Historically speaking, barley has been an important food source in many parts of the world. However, better product quality and mouth-feel of food products prepared from wheat and rice, compared to barley, considerably lowered the use of barley as food, especially in the 19th and 20th centuries [1].
At the international level, very few studies have been devoted to genetic selection and breeding to develop varieties for food. Industrial requirements have not been taken into account, which makes the use of barley products in specific food products so difficult.
But, it has been reported that barley flour can be easily integrated into products made from wheat for the production of bread, cakes, biscuits and extruded pasta [2]. In some countries (Russia, Poland, Tibet, India and Japan), barley products are used for preparing many traditional dishes [3].
To cook different dishes, barley grains, after milling, come in many forms and are used for various purposes. Barley Semolina, known locally as "balboula or dchicha", can be used for the production of couscous, soup and other dishes. It is also used during the shaping stage of bread-making to sprinkle the dough rolls made from wheat. While Barley flour is used alone or blended with common wheat flour for bread-making.
In some parts of Morocco, barley is collected up to physiological maturity when the grain is still green. The grain is beaten, steamed and dried. Subsequently, it is ground and used to prepare other dishes, mostly soups. In 1988, Morocco, and in order to absorb the excess production of barley, authorized the incorporation of 15% barley flour in wheat flour produced by the industrial mill plants [5].
The impact of BF incorporation on the baking quality of some local varieties flour has been the subject of some studies [6-7-8]. The objective was to give barley greater valorization in food security and to reduce the use of imported bread wheat.
Nowadays, the importance of barley food uses lies in its wealth of natural compounds beneficial to health. Barley contains tocopherols, phenolics, phytosterols and soluble and insoluble fiber.
Beta-glucan, a soluble fiber, is the most well-known compound, promoting health [9-10]. Barley grains contain an average of 2 - 9% [11]. The recent approval of soluble barley b-glucan health claims by the Food and Drug Administration of the USA for lowering blood cholesterol level could further boost food product development from barley and consumer interest in eating these food products.
Baking quality is complex attribute. Since its direct estimation is a lengthy process. Indirect quality assessment is often used; these are made on the basis of a number of physical and chemical tests on flour [12-13-14]. The parameters which are involved in baking quality assessment are ash and moisture content, protein content, Hagberg falling number and Zeleney sedimentation value. However, rheological properties of wheat flour dough are essential for the successful manufacturing of bakery products because they determine its behavior during mechanical handling, thereby affecting the quality of the finished products [15-16]. Using the alveograph technique, Agyare and
al. evaluated the bread and cookie-making qualities of hard and soft wheat flour [17].
Basing on these tests, the present work aimed to investigate the effect of different mixtures of WF and BF on the baking quality. For this study, industrial flours were used.
EXPERIMENTAL SECTION
Material
Common wheat flour (WF) regulated in Morocco under the name “farine de luxe” was obtained from a Moroccan industrial mill. Barley flour (BF) was purchased from the local grain market commonly called “Rahba”.
The bread improver, provided by a bakery (located in Rabat), was incorporated at a level of 0.2%. It consists of wheat flour (83.5%), ascorbic acid (4%), malt (10%) and alpha-amylase (2.5%).
BF and WF blends were prepared in such a way that BF replaced WF at 0, 5, 10, 15, 20, 25, 50 and 100% levels. All the blends prepared were used for the analysis outlined below.
Methods
• The moisture content was measured according to the method recommended by Moroccan standard NM 08.1.202 [18]. The principle of this method is based on the determination of the loss weight suffered by the sample when dried at a temperature of 130-133 ° C for one hour and 30 minutes.
• The ash content was determined, according to the method published by Moroccan standard NM 08.1.211, by ashing a flour sample in a muffle furnace (model Tipoforno ZA No. 18203 Gef Ran 1001) at 550°C [19]. The operation is completed when only pure white ash is to be seen in the porcelain crucible. After cooling, the crucible is weighed and the quantity of ash stated as a percentage of the dry matter.
• Determination of fat acidity was performed according to the method published by the Moroccan standard NM. 08.1.225 [20]. The fat acidity is expressed in grams of sulfuric acid per 100 g (0% dry matter basis).
• The sedimentation value according to Zeleny (expressed in ml) describes the degree of sedimentation of flour suspended in a lactic acid solution during a standard time interval. Swelling of the gluten fraction of flour in lactic acid solution affects the rate of sedimentation of a flour suspension. The determination was performed according to the method published by the Moroccan standard NM 08.1.208 [22].
• Hagberg falling number (α -amylase activity) was determined according to the method described by the Moroccan standard NM 08.1.209 [23]. The Hagberg falling number is defined as the time in seconds required to stir and to allow a viscometer stirrer to fall a measured distance through a hot aqueous meal, flour or starch gel undergoing liquefaction due to alpha-amylase activity.
• Rheological properties were determined by a Chopin NG alveograph according to the Moroccan standard NM 08.1.213 [24]. The test is based on measuring the pressure required to blow a bubble in a sheeted piece of dough. The phases of the Alveograph method simulate the sheeting, rounding and molding of the dough pieces during baking process. The five dough pieces are prepared by mixing and extruding, followed by shaping into small discs which are then left for resting during 20 minutes. After that, air is blown under the disk at a constant rate creating a bubble. The pressure inside the bubble is recorded until the bubble ruptures creating the alveogram giving the data relating to the dough’s resistance to deformation such as :
i.P: tenacity represents the maximum pressure reached when blowing dough bubble to rupture. This parameter is expressed in mm H2O ;
ii.L: average abscissa to rupture represents the average length of the alveogram from the point in which the bubble starts to inflate to the point in which the bubble ruptures. The L value is generally related to dough extensibility and predicts the handling properties of the dough. It is expressed in mm ;
iii.P/L: configuration ratio indicates the shape of alveogram ;
iv.G: swelling index represents the square root of the air volume needed to rupture the dough bubble. This value is the measure of dough extensibility.
v.W: deformation energy represents the energy needed for the dough piece inflation until rupture, expressed in 10-4 J. The W value is related to the baking "strength" of the flour. This parameter has the uppermost significance in the interpretation of alveogram.
The variables represent the average of five curves from five dough patties.
RESULTS AND DISCUSSION
Composite flours
• Physical-chemical analysis:
Results analysis of Wheat flour (WF) and Barley flour (BF) are presented in Table 1. WF was found to contain 12.80% moisture, 0.61% ash and 0.03 g H2SO4 Fat acidity. These results show that this flour can be classified as
“farine de luxe”, the main product used, in Morocco, for bakery [25]. On the other hand BF was found to contain 10.70% moisture, 2.06% ash and 0.15 g H2SO4 fat acidity.
The low moisture content observed for BF is justified because barley is generally milled without tempering. This parameter is very important not only for flours shelf life but also for the determining of solids content. For many tests, it is necessary to know dry weight for the material in order to determine the amount of substances it contains [26].
[image:3.595.183.430.645.686.2]However the values obtained for ash and fat acidity of BF are judged too high and will affect negatively the baking quality. Indeed, in most regions of the world, flours are trade according to their mineral content. The baking properties of the flours change with the degree of extraction, therefore the ash content should stated in concrete terms [26].
Table 1: Physical-chemical analyzes of barley and wheat flours
Parameter Wheat flour Barley flour
Moisture content (%) 12.8 10.7
Ash (dry matter basis) 0.61 2.06
Fat acidity (g H2SO4 % dry matter basis) 0.03 0.15
Concerning fat acidity, this factor is an important indicator of flour freshness. The fats and phosphatides are broken down enzymatically during storage of the flour. This breakdown is accelerated by a high water content, high temperatures and a high degree of extraction. The lipases and phosphatases naturally present in the cereal cause an increase in the percentage of free fatty acids and phosphate [26].
The high level of flour fat acidity affects negatively the results of some quality tests, like alveograph and bread-making. The alveograph curves are more scattered, the baking force (W) decrease, P/L Ratio reflecting balance between dough strength and extensibility increases and bread volume decreases significantly [28].
• Technological and rheological analysis:
[image:4.595.187.427.272.361.2]The results obtained from technological analysis and alveographic measurement of dough are summarized in table 2. An important difference was observed between BF and WF for the parameters analyzed. The values obtained for WF were 11.95% for protein and 41 ml for Zeleny sedimentation value (ZSV) and 309 sec for Hagberg falling number (HFN). According to these characteristics, the baking quality wheat flour can be classified as good and satisfied largely the bread-making requirements [25].
Table 2: Technological and alveograph properties
Parameter Wheat flour Barley flour
Protein* (dry matter basis) 11.95 13.74
Zeleny sedimentation value (ZSV) (ml) 41 14
Hagberg falling number (HFN) (sec) 309 269
Alveograph parameter :
•P (mmH2O) •L (mm)
•W (10-4 J) •P / L
92 75 237 1.23
- - - -
* (Nx5.7) for WF and (Nx6.25) for BF
BF was found to have 13.74% for protein. This value is in agreement with that reported by Moudden (1993), but higher than that reported by Bhatty (1987) [7-27]. Despite this high value of protein, the average of ZSV did not exceed 14 ml. The ZSV depends on the protein composition and is mostly correlated to the protein content [29]. The protein content will not necessarily guarantee that given flour will make a satisfactory loaf of bread [30]. In our case, BF, as mentioned below, results mainly from peripheral peeled layers of the grain, (aleurone layer) naturally rich in proteins, but not able to swell and to form gluten. Since the swelling value is a measure of the protein quality, it must also be taken into account in predicting flour dough behavior [31].
The ZSV of barley flour therefore highlights the negative effect that could make the addition of barley flour on the quality of gluten formed during baking. Values less than 20 ml are below the minimum threshold to submit a wheat intervention but they are suitable for wheat biscuit; in terms of wheat for the current bakery, a range between 30 and 40 is desirable [32].
As for α -amylase activity, table 2 indicate a low diastatic activity for WF, translating into a relatively high time fall
that reached 309 sec. For values greater than 260 sec, the WF flour must be corrected for optimal amylase activity [28]. For barley flour, the average falling time was 269 sec; this value approaches the optimal value but cannot in any way indicate that this flour can be used for bread-making on account of the fact that this test provides information only about α-amylase activity. However, this flour, mixed with wheat flour, could correct the deficiency of alpha-amylase activity of the whole mixture and therefore the falling time of the mixture will be reduced compared to that of the initial wheat flour.
As regards the alveograph test, the rheological properties for WF were found to be 237 (10-4 J), 92 mmH2O and 1.23
respectively for baking strength (W), tenacity (P) and configuration ratio (P/L).
In general, strong flours are characterized by high P and W and low or medium L values. Particularly, the suitability of certain wheat/flour for intended purpose on the basis of alveogram values depends between different countries and is influenced by the availability of raw material of certain quality [33-34]. Thus, by performing the quality testing of bread wheat cultivars, Bordes et al. classified available wheat cultivars on the basis of alveogram parameters [35]. P values for standard wheat quality range 60-80 mm H2O, very good wheat quality 80-100 mmH2O, whilst extra strong wheats are characterized by P value higher than 100 mm H2O. Moreover, the L of 100
The configuration ratio is commonly used in wheat trade where value of 1.50 indicates very strong and moderately extensible dough. Concerning the interpretation of W value for standard quality wheat is characterized by W value in range 160-200 (10-4J), whilst good quality wheat and improving wheat are characterized by W value in the range 220-300 and higher than 300, respectively [35].
Compared to these values, the results obtained for WF showed a good baking quality. As for BF, it was impossible to perform the test because the volume of water recommended by the standard for kneading was not sufficient to form dough.
Flour blends
• Technological analysis
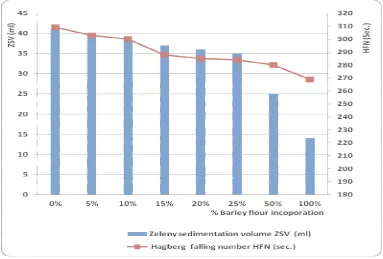
The previously broached technological parameters were also measured for the flour blends containing different levels of BF. Figure 1 shows the effect of BF on ZSV and HFN.
The results highlight a decrease of ZSV and HFN. ZSV decreased with the increase in the level of replacement from 41 ml for control (0% BF) to 38, 36 and 25 ml for flour blends supplemented respectively with 10, 20 and 50% BF. This reduction of the ZSV is mainly due to the dilution of the wheat gluten content. These results are in agreement with those obtained by Dhingra and al. (2004) [36]. These authors reported that the gluten content, sedimentation value and water absorption capacity of the flour blends decreased with increase in the level barley flour.
Substitution of BF in WF decreased the values of HFN. It ranged from 309 sec for control to 288 and 280 sec for 15 and 50 % BF respectively. Moreover, this substitution had a positive effect on the diastatic activity of the flour blends. The optimum level of enzyme activity is ultimately governed by the end use of the flour and the type of processing involved as mentioned by Mailhot and Patton (1988) [37]. For bread-making, admitted values of HFN should range between 180 and 250 sec [38].
As to ash content that is determined by calculation, increasing level of BF resulted in an increase in ash. Values of ash ranged from 0.68 for 5% to 1.34% for 50% compared with Control 0.61%. According to the Moroccan regulatory limits of wheat flour, the addition of 5% barley flour mixture ranks beyond the reserved range "farine de
[image:5.595.115.498.430.689.2]luxe" (maximum of 0.65 dry matter basis).
Figure 1: Technological parameters of WF-BF blends
Statistical analysis showed that the effect of BF addition on the ZSV is highly significant (α =0.01) for rates superior than 10 %. A narrow correlation was noticed (r = -0.994). However, the flour of mixture kept its baking properties until a level of 50 % (figure 1). The ZSV decreasing observed is mainly due to the deterioration of the protein flour blends quality. These findings agreed with the results obtained by Bakhella et al. (1991) who advocated the negative correlations that are remarkable and detected between the rate of incorporation of barley and ZSV [8]. However, the BF addition had a positive effect on the diastatic activity of flour mixtures. The correlation coefficient was r= - 0.87.
• Alveograph test
The alveograph Chopin test predicts the baking quality of flour. It presents an interest for professionals of the second transformation, because it accounts for the various measured alveographic parameters, for the ability of flour to be done, according to its baking strength, for an adhoc purpose [38].
This test is also used to predict the quality of flour resulting from mixtures of different flours and test power enhancing additives and defining the optimal dose. In figure 2, is referred to the results of alveograph test of flour blends.
[image:6.595.147.466.266.361.2]0% 5% 10% 15% 20% 25%
Figure 2: Alveograms of flour blends
These results indicate that the rheological properties (tenacity P, swelling index G, extensibility L, and configuration ratio P/L and baking strength W) of dough obtained from different flour blends are negatively influenced by BF addition.
The tenacity P increased with increasing levels of BF. P passed from 92 for control to 140 mmH2O for an
incorporation rate of 25%. On the other hand, extensibility L is negatively correlated with the addition of barley flour. Its value varied from 75 mm for the control and gradually decreases to 21 mm for the incorporation rate of 25% barley flour. The variation of P and L in two opposite directions resulting in an imbalance of alveogram is measured by the ratio of configuration P/L, and passed from 1.23 to 6.67. Concerning the swelling index G, it varied
in the same manner as the extensibility ( ). Substitution of BF in WF decreased the values of baking strength W. It ranged from 237 to 133 (10-4 J) for control (0%BF) and for incorporation of 25% respectively. The effect of BF addition is highly significant (α = 0.001) for the parameters P, L, G and P/L, and very significant for the parameter W. The tenacity showed significant difference at 15% above the rate of incorporation, while the baking strength and configuration ratio (P/L) showed significant differences beyond 10% mixture. As for extensibility, the effect of adding barley becomes evident at 5%.
One should bear in mind that the alveograph test works dough at constant hydration. The rheological properties of the dough in these conditions for common wheat flour are normal. So, the increase of the tenacity and the weakening of the extensibility observed in our case denoted a change of the dough gluten properties. The gluten becomes firm and short.
The BF addition acts by making less important the quantity of free and available water for kneading, what would give to the dough more firmness and tenacity. This result is concomitant with that of Bhatty and al. (1993) who related that the barley flour, compared with that of common wheat, after mixograph analysis, demonstrates weak and non-elastic gluten, absorbing more than twice the volume water absorbed by the wheat flour [39].
Figure 3: Variation of ZSV (ml) and baking strength w (10-4 J)
As for baking strength W, the recorded decrease of the results is mainly due to the deterioration of the protein quality of flour blends. Indeed, the baking strength is strongly linked to the quality and quantity of gluten, the latter being the network formed by the protein insoluble in water during kneading. Yet proteins provided by barley contain weak and non-elastic gluten, so higher the rate of incorporation of barley flour is, less will be the quality of the gluten network formed and less baking strength W of the mixture will be.
This result confirms the values found for the ZSV as they are shown in figure 3 witch reveal strong correlation between the two parameters (r = +0.96).
To simulate the conditions for preparing bread bakery, a bread-improver was used at a percentage of 0.2% (80 ppm of ascorbic acid) for three flour blends (5, 10 and 20 %). In table 3, is referred to the results of alveograph test obtained.
[image:7.595.144.466.64.307.2]The addition of a bread-improver had the effect of increasing the tenacity and baking strength. In retrospect, extensibility and swelling index have evolved in opposite directions. This effect is attributed to the presence of ascorbic acid, which thanks to its antioxidant role, increases the elasticity of the dough and the baking strength [38]. However, the use of bread improver has unbalanced more the configuration ratio P/L. It passed from 2.28 and 4.75 to 3.41 and 6.91 respectively for 10 and 20 % BF incorporation.
Table 3: Results of alveograph mixtures with improver
% BF P (mmH2O) L (mmH2O) G W
(10-4 J)
P/L
0% 102 64 17.8 254 1.59
5% 121 46 15.1 236 2.63
10% 133 39 13.8 228 3.41
20% 159 23 10.6 158 6.91
CONCLUSION
Intrinsic properties of barley flour were tested for the objective of being deployed in bread making. To this end, different incorporation rates 0, 5, 10, 15, 20, 25, 50 and 100% barley flour mixed with wheat flour were prepared and submitted to physical-chemical, technological and rheological tests.
These changes become apparent in addition to the level of 15% for the tenacity and 10% for Zeleny sedimentation value and baking strength. Conducting these tests in the presence of an ascorbic acid-based bread improver has corrected some quality defects caused by the addition of barley flour especially the baking strength, but has unbalanced more the configuration ratio P/L.
Following this study, one can conclude that the assignment of the baking quality hinges heavily on the quality of flours composites used for blending. Strong wheat flour is preferred. As for barley flour, its quality can be more improved if it is milled as main product under controlled conditions to decrease its ash and fat acidity contents.
REFERENCES
[1] CW Newman; RK Newman. Cereal Foods World, 2006, 51, 4–7. [2] RK Newman; CW Newman. Cereal Foods World, 1991, 36, 800–805.
[3] SR Chatterjee; YP Abrol. Journal of Food Science and Technology, 1977, 14, 247–250.
[4] H Belhadfa; A Bentasil; EA Chafai; M Mekkaoui. Evolution de la production et de la consommation des trois principales céréales au Maroc au cours des dernières cinquante années. Document sténographique, 1992.
[5] Arrêté du Ministre de l'Agriculture et de la Réforme Agraire n°1147-88 du 28 juillet 1988, Bulletin Officiel n°
3958, Maroc, 1988, 303-304.
[6] H Ghamraoui. Mémoire de 3ème cycle, Option des Industries Agricoles et Alimentaires, Institut Agronomique et Vétérinaire Hassan II (Rabat, Maroc, 1992).
[7] M. Moudden, Mémoire pour l’accès au grade d’ingénieur en chef, Institut National de Recherche Agronomique (Rabat, Maroc, 1993).
[8] M Bakhella; A El Kharbili; M El Mir. Actes Inst. Agron. Vet., Vol 11 (3) 1991, 33-44.
[9] AA Qureshi; WC Burger; DM Peterson; CE Elson. Journal of Biological Chemistry, 1986, 261, 10544–10550. [10] AA Qureshi; N Qureshi; JJK Wright; Z Shen; G Kramer; A Gapor; YH Chong; G Dewitt; ASH Ong; DM Peterson; BA Bradlow. American Journal of Clinical Nutrition, 1991, 53, 1021–1026.
[11] F. Jaby El-Haramein In: S. Grando and H. G. Macpherson (Eds.), Food Barley: Importance, Uses and Local Knowledge, ICARDA, Aleppo, Syria, 2005; 141-144.
[12] L Zeleny. In: Y Pomeranz (ed.), Wheat: Chemistry and Technology, 2nd edition, AACC, Inc, St. Paul, Minnesota, USA, 1978; 19-49.
[13] DB Pratt. In: Y Pomeranz (ed.), Wheat: Chemistry and Technology, 2nd edition, AACC, Inc, St. Paul, Minnesota, USA, 1978; 201-226.
[14] E Dwyer; T Walshe; TR Gormley. Irish Journal of Food Science and Technology, 1982, 6:79-89.
[15] RC Hoseney; P Wade; JW Finley. In: Y Pomeranz (ed.), Wheat: Chemistry and Technology, Vol. II, 3rd ed., AACC, Inc, St. Paul, Minnesota, USA, 1988; 407-417.
[16] D Weipert. Cereal Food World, 1992, 37, 15-24.
[17] KK Agyare; K Addo; YL Xiong; CC Akoh. Journal of Cereal, 2005, 42, 309-316.
[18] IMANOR. Norme marocaine NM 08.1.202, Céréales et produits dérivés : Détermination de l'humidité, Maroc,
1998, 12 p.
[19] IMANOR. Norme marocaine NM 08.1.211, Céréales, Légumineuses et Produits Dérivés : Détermination du
taux de minéralisation par incinération à 550 °C, Maroc, 1998, 6p.
[20] IMANOR. Norme marocaine NM 08.1.225, Céréales et Produits de Mouture : Détermination de l’acidité
grasse, Maroc, 2002, 6 p.
[21] IMANOR. Norme marocaine NM 08.1.206, Céréales et Produits Céréaliers : Détermination de la teneur en
protéines (méthode de référence), Maroc, 1998, 5 p.
[22] IMANOR. Norme marocaine NM 08.1.208, Blé tendre : Indice de sédimentation de Zeleny, Maroc, 1998, 6 p. [23] IMANOR. Norme marocaine NM 08.1.213, Céréales et produits dérivés : Détermination de l'indice de chute, Maroc, 1998, 8 p.
[24] IMANOR. Norme marocaine NM 08.1.213, Farines de blé tendre : Détermination des caractéristiques
rhéologiques au moyen de l'alvéographe, Maroc, 2002, 12 p.
[25] Arrêté du Ministre de l'Agriculture et de la Pêche Maritime n°2318-09 du 28 août 2009, Bulletin Officiel n°
5778, Maroc, 2009, 1373-1375.
[26] F Freund; MY Kim. In: L Popper; W Schäfer; W Freund (eds.), Future of Flour: A compendium of Flour Improvement. Agrimedia GmbH&Co.KG, Clenze, Germany, 2006; 101-116.
[27] RS Bhatty, Cereal Foods World, 1987, 32: 268, 270, 272.
[28] Institut technique des céréales et des fourrages; Contrôle de la qualité des céréales et protéagineux: Guide pratique, Edition 2, Les Presses du Val de Loire, France, 2001; 155-220.
[29] PR Shewry; AS Tatham. Wheat. The Royal Society of Chemistry. Cambridge CB4 OWF, UK, 2000; 335–339. [30] WP Edwards. The science of bakery products. The Royal Society of Chemistry. Cambridge CB4 OWF, UK,
[31] GL Rubenthaler; Y. Pomeranz. Cereal Chem., 1987, 64: 407–411.
[32] Règlement (CE) No 824/2000. Journal officiel des Communautés Européennes, 2000; L 100/31–L100/52. [33] B Vergnes; G Della Valle; P Colonna. In: G Kaletunç & KJ Breslauer, (Eds.), Characterization of Cereals and Flours, Marcel Dekker, Inc., New York, USA, 2003; 209-265.
[34] M Dubois; A Dubat; B Launay B. The AlveoConsistograph Handbook (2nd edition), AACC International, St. Paul, Minnesota, USA, 2008; 87 p.
[35] J Bordes; G Branlard. FX Oury; G Charmet; F Balfourier. Journal of Cereal Science, 2008, Vol. 48, No. 3, 569-579.
[36] S Dhingra; S Jood. International Journal of Food Science & Technology, 2004, 39, 213–222.
[37] WC Mailhot; JC Patton. In: Y Pomeranz (ed.), Wheat: Chemistry and Technology, Vol. II, 3rd ed., AACC, Inc, St. Paul, Minnesota, USA, 1988; 69–90.
[38] A. Cola, In : B. Godon et C. Willm. Les Industries de Première Transformation des Céréales (2° tirage revu), Collection Sciences et techniques agroalimentaires : Technique et Documentation Lavoisier, Paris- France. 1998; 590-626.