Verification of the MeteoExpert Nowcasts
T. A. Bazlova
*, N. V. Bocharnikov
Research Department, Institute of Radar Meteorology (IRAM), Russian Federation
Copyright©2017 by authors, all rights reserved. Authors agree that this article remains permanently open access under the terms of the Creative Commons Attribution License 4.0 International License
Abstract The MeteoExpert system was operational at
the Main Operations Center of Sochi-2014 Olympic and Paralympic Games. The MeteoExpert provided information support round the clock for forecasters, referees and organizers of the Olympic and Paralympic Games via MeteoExpert web site and FROST-2014 web site. The MeteoExpert generated pointwise time series of meteorological variables for five Olympic venues in mountain cluster with four hour lead time and update cycle of ten minutes. They were based on local observations including automatic weather stations (AWS) and Doppler weather radar, and numerical atmospheric boundary layer (ABL) model. Nowcasts have been verified against actual observations at the sites where automatic weather stations exist.Keywords Verification, Nowcasting, MeteoExpert
1. Introduction
Nowcasting is usually applied as a tool to generate prognostic information with lead times of several hours for use in issuing of time-critical weather warnings. Generation of accurate and timely nowcast products is a basis of early warning automated system providing information about significant weather conditions for decision-makers.
The MeteoExpert system in operational is used in many aviation meteorological centers and a few hydrometeorological centers. It is designed as a comprehensive system covering wide range of weather-forecasting tools and following new technologies. The system is employed by forecasters at 44 aviation meteorological centers and aviation meteorological groups in six countries. It supports aviation forecasters and provides information required for pre-flight planning. MeteoExpert meets the requirements of the ICAO SADIS Operations Group (SADISOPSG) and delivers functions for the correct use of the WAFS and OPMET data [1]. Nowcasting is one of its functionalities developed last years and implemented for the first time in Sochi.
The MeteoExpert system was operational at the Main Operations Center of Sochi-2014 Olympic and Paralympic Games. MeteoExpert was one of the nowcasting systems of the FROST-2014 (FROST - Forecast and Research: the Olympic Sochi Testbed), which was approved WWRP (World Meteorological Organization’s World Weather Research Program) project.Specific objective of the project was to develop nowcasting systems for winter applications and to demonstrate their capabilities. The MeteoExpert system description regarding its nowcasting functionality and results of preliminary verification have been presented in [2,3]. The purpose of this paper is to demonstrate results of verification for a period of the Games (7 Feb - 16 March 2014) with a particular emphasis on low visibility, most critical for open-air competitions and relevant for helicopter landing and takeoff.
2. Method
2.1. The MeteoExpert Nowcasting System
Sport events in the mountain cluster were especially weather-sensitive. Each sport object there has a helipad and fully equipped automatic weather station. MeteoExpert provided information support for forecasters, referees and organizers of the Olympic and Paralympic Games in Sochi via MeteoExpert web site and FROST-2014 web site 24/7. Four-hour location-specific forecasts were visualized at the MeteoExpert web-site together with the following accompanying information: automatic weather stations data, weather radar data including composite weather radar maps for the Black Sea region, actual and prognostic weather maps, radiosonde data, satellite data, AMDAR data, temperature profiles, and video camera images. Nowcasts generated by MeteoExpert were available round-the-clock for all concerned (forecasters, referees, organizers), including decision-makers. This information was especially important in an emergency (urgent evacuation of injured person by a helicopter, open air competition postponement in a case of severe weather conditions).
observations including automatic weather stations (AWS) and weather Doppler radar, an adaptive assimilation scheme, and numerical atmospheric boundary layer (ABL) model. 1D model with very high vertical resolution (up to 2m in the sub-surface) takes into account radiative transfer, surface exchange processes, and boundary layer dynamics. It takes also some account of local orography in a simple way.
For a model to be useful for operational use it must be reasonably accurate, relatively simple to implement, economical to run, and lead to stable calculations. The 1D ABL model is designed to represent the evolution of vertical profiles in the lower atmosphere induced by the land-atmosphere coupling and associated exchanges of energy and momentum taking place along the vertical axis only. Under horizontally homogeneous conditions, and assuming incompressibility, the momentum, water conservation and thermodynamic equations in terms of potential temperature, specific humidity and wind components is written in the standard form. The k-ɛ turbulence closure scheme is used which is based on the prognostic equations for turbulent kinetic energy and the eddy dissipation rate. It enables reasonable predictions for turbulent flows. Other approaches (for example, DNS – Direct Numerical Simulation, LES -Large Eddy Simulation) can be more accurate, however, at the same time complexity increases, computing time increases, and their usability decreases.
The lower boundary conditions for the model equations are formulated with the aid of the Monin-Obukhov similarity theory for the atmospheric surface layer which is generalization of the law of the wall to account for buoyancy and shear. Interactions between the atmospheric flow and the surface are taken into account in the model, where the surface temperature is modeled with a simplified energy balance relation at the surface, the force-restore equation, where the soil flux at the surface is given by the surface energy balance. The net radiation flux at ground level is parameterized in a simple way. The incoming solar radiation flux on the inclined surface is given in terms of cloud cover, the incoming long-wave radiation is expressed in terms of effective air temperature and cloud cover, and the outgoing long-wave radiation from the surface is calculated in accordance with Stephan-Boltzman law.
The model ran for each point where AWS was installed. A combination of three methods was employed to estimate precipitation movement: a cross - correlation tracking method, averaged Doppler velocity, and prognostic wind at a level of 700 hPa. Vertical profiles of the following meteorological parameters were simulated: air temperature, wind speed and wind direction, dew point, turbulence kinetic energy, and eddy dissipation rate. The model did not forecast cloud ceiling height and horizontal visibility directly. Visibility parameterization was developed in terms of temperature, relative humidity, precipitation type and intensity.
Four-hour location-specific forecasts were generated by
MeteoExpert with an update cycle of 10 minutes. Prognostic data concerning air temperature, dew point temperature, relative humidity, wind speed and direction, precipitation, visibility and cloud ceiling height were visualized for customers. This information was provided for five locations (nowcast points) connected to sports venues in mountain cluster.
2.2. Sample Collection
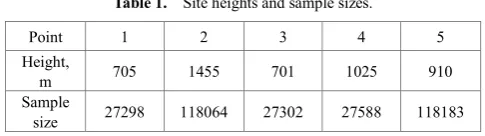
[image:2.595.310.553.307.375.2]Nowcast points were connected to the following sports venues in mountain cluster: ‘Ski-jump-650’ (point 1), ‘Biathlon stadium’ (point 2), ‘Sanki-700’ (point 3), ‘Snowboard’ (point 4), and ‘Rosa Khutor’ (point 5). Table 1 shows height and sample size for each point. The highest (almost 1.5 km) point was connected to the point 2 (‘Biathlon stadium’). More statistics is available for points 2 and 5.
Table 1. Site heights and sample sizes.
Point 1 2 3 4 5
Height,
m 705 1455 701 1025 910
Sample
size 27298 118064 27302 27588 118183
2.3. Verification Scheme
The reason for verification of MeteoExpert nowcasts is mostly scientific. The scientific point of view is concerned more with understanding and hence improving the nowcasting system. A detailed assessment of the strengths and weaknesses of a set of nowcasts requires a few summary scores. On the other hand, verification scheme needs to be customer-based and to take into account thresholds that are relevant to different customers concerned in the meteorological providing of sports competitions and helipads.
Site specific weather forecasts produced by MeteoExpert have been verified against actual observations at the sites. The automatic weather stations observations were employed as reference for verification. Verification involves investigation of the properties of joint distribution of forecasts and observations for each 10 minutes. Thresholds are chosen that are directly relevant to the customers. Criteria of accuracy correspond to operationally desirable accuracy of forecasts [4].
Dependency Index (SEDI) derived from the contingency table for a few forecast thresholds.
The bias is one of the basic descriptive statistics, but is not a measure of forecasting skill. It is a verification measure in some sense, being function of the forecasts and observations, but is not a performance measure since it is not concerned directly with the correspondence between forecasts and observations. Other verification measures used are performance measures because they focus on the correspondence between forecasts and observations.
To generate the verification metrics, a set of forecasts is displayed in a 2 x 2 contingency table representing the frequencies of forecast–observation pairs for which the event (visibility below threshold) and nonevent (visibility is equal to or higher than threshold) were forecasted and observed.
Frequency bias (it is referred as bias) is the ratio of the number of forecasts of occurrence to the number of actual occurrences. Perfect forecasts with H=1 and F= 0 are always unbiased (bias=1).
The hit rate (H), also called probability of detection (POD), is the proportion of occurrences that were correctly forecast. H can have values from 0 to 1, where 1 corresponds to a perfect forecast, and 0 to a poor forecast. Since a good forecast should have high hit rates and a low number of false alarms, the hit rate alone is insufficient for measuring forecast skill. The false alarm rate F is the proportion of non-occurrences that were incorrectly forecasted by the model. F can have values from 0 to 1, where 0 corresponds to a perfect forecast, and 1 to a poor forecast.
The miss rate is a proportion of the event occurring despite not being forecast (misses) to the total number of misses and correct rejection (instances of the event not occurring after a forecast that it would not occur).
The proportion of correct forecasts PC is also expressed in percent and then called percent correct. Note that very frequent or very rare events score with a high PC if occurrence or non-occurrence, respectively, is always predicted.
Forecast skill is usually presented as a skill score, which is often interpreted as a percentage improvement over the reference forecasts. One of the drawbacks of many performance measures is their dependence on the base rate (or event probability), so that the pure natural variability may cause different skill of the same forecast model.
The Heidke Skill Score (HSS) is one of the most frequently used skill scores. The reference accuracy measure in the HSS is proportion correct. The HSS is an equitable score since constantly forecasting occurrence or nonoccurrence results in zero skill, as do random forecasts. It vary within the range of -1 to 1, where 1 corresponds to a perfect forecast, -1 is a perfect, but wrongly calibrated forecast, and 0 is the no skill forecast. However, HSS is not a regular score, it depends on the base rate and threshold probability, and so it is unreliable as a performance measure.
The Peirce’s Skill Score (PSS) is formulated similar to the HSS, except that the reference forecast is that of random
forecast that is constrained to be unbiased. PSS vary in the range of -1 to 1. Perfect forecasts receive a score of 1, random forecasts receive a score of 0, and forecasts inferior to the random forecasts receive negative scores. The PSS is equitable and does not depend on sample climate. It does depend strongly on threshold probability, and is not regular. PSS is unreliable as a performance measure unless these factors are taken into account.
The Equitable Threat Score (ETS) is constructed using the threat score as the basic accuracy measure. For very rare events ETS (and other skill scores mentioned above) also approaches zero or some other constant, even for skillful forecasts. Alternative skill scores not suffering this deficiency are ORSS, EDI and SEDI.
The ORSS is equitable in the qualified sense, is regular and does not depend on base rate. It is therefore preferable to all of the previously discussed performance measures. However, it does not adequately describe the performance of forecasting systems in case of low sample size. The ORSS vary in the range of -1 to 1. Random forecast receive 0, and perfect forecast receive 1.
Verifying forecasts of rare (extreme) events is difficult because of degenerating of traditional forecast performance measures to trivial values (zero or infinity) [8]. Many of them are dependent on the base rate and easy to hedge. Even base-rate independent measures can diminish to zero. Two measures (EDI and SEDI) were proposed [7] and were shown to overcome all these shortcomings. The EDI and SEDI are expressed in terms of H and F only, so they are base-rate independent, and are calculated as
EDI = ( logF –logH)/( logF + logH), (1) SEDI = [logF - logH - log(1 - F) +
+log(1 - H)]/[ logF +logH +log(1 - F) + log(1 - H)]. (2) The range of the EDI and of the SEDI is -1 to 1. EDI is maximized whenever H = 1 and minimized whenever F = 1. SEDI only approaches its maximum value as H → 1 and F→ 0, and approaches its minimum value as H → 0 and F → 1.
One of the desirable properties of verification measures is equitability. A measure is equitable if its expected value is the same for all random forecasts. Many measures (including the ETS) are equitable only in the limit as the sample size increases to infinity, hence they are asymptotically equitable.
Both EDI and SEDI are base-rate independent, asymptotically equitable, harder to hedge, and nondegenerating measures.
3. Results
3.1. Verification of Basic Variables
verification for the point 2 (“Biathlon stadium”) are shown in Table 2 for nowcasts with 2-hour and 4-hour lead time. Point 2 was chosen for presentation due to two reasons: first, height of the point is the biggest one, and hence forecast success for the point is not the highest, and second, sample size for the point is one of the largest.
Table 2. Verification of basic variables
MAE Bias RMSE PC, %
Lead, h 2 4 2 4 2 4 2 4
T air, °C 0.6 0.9 -0.2 -0.2 0.9 1.2 95 89
T
dew, °C 0.7 1.1 -0.3 -0.4 1.2 1.7 91 84
V, m/s 0.7 0.8 -0.5 -0.5 0.9 1.0 98 97
Dir,° 4 6 0.4 5.0 34 61 70 57
Values presented in the Table 2 are results of comparison of forecasts with observations at the same location and at the same height above ground (2m for air temperature and dew point temperature, and 10m for wind velocity and direction, where corresponding sensors are installed).
All estimated values tend to become worse with a lead time, however, not so significantly. Thus, for the wind velocity MAE increases from 0.7 to 0.8 m/s, bias is equal to -0.5 in both cases, RMSE increases from 0.9 to 1.0 m/s, and PC decreases from 98 to 97 %. The worst results were obtained for wind direction, with PC being equal to 70 – 57%, depending on lead time. This is caused by nonsufficient performance of the 1D ABL model to simulate dynamics, especially in case of mountain terrain. For the latter one has to consider that a 1D model cannot predict the wind vector. Values of PC for 4-hour forecasts of air temperature, dew point temperature and wind velocity are equal to 89, 84, and 97%, correspondingly, representing their adequate accuracy.
3.2. Verification of Visibility
The following thresholds are set: visibility equal to 100m for the Games decision makers (under the condition of Vis<100m they should take a decision concerning a cancellation of open air competitions), visibility equal to 800m for aviation customers (under the condition of Vis<800m special actions are to be performed [4]), visibility equal to 1000m as a typical value under the fog condition, and visibility equal to 3000m. Low visibility (under a threshold) is referred as the event.
Figure 1 shows frequency bias for 4-hour nowcasts under the threshold of 800m for five points. Values of bias for three points of five are of 1, approximately, hence these forecasts are nearly unbiased (the event was forecast nearly the same number of times that it was observed). Values of bias for the rest two points are above 2, which is a feature of overforecasting (the event was forecast more often than observed). Figure 2 shows frequency bias for 4-hour
[image:4.595.314.554.125.271.2]nowcasts against threshold for the point “Biathlon stadium”. All values are more than 0.9 and less than 1.05, depending on threshold, and giving evidence of nearly unbiased forecasts.
[image:4.595.313.553.301.448.2]Figure 1. Frequency bias for different points, threshold of 800 m.
Figure 2. Frequency against forecast threshold.
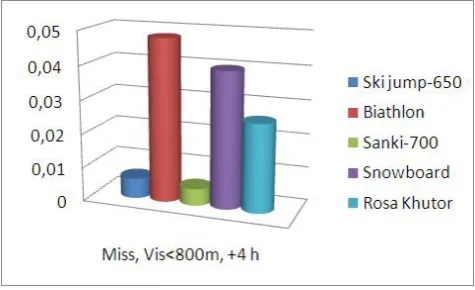
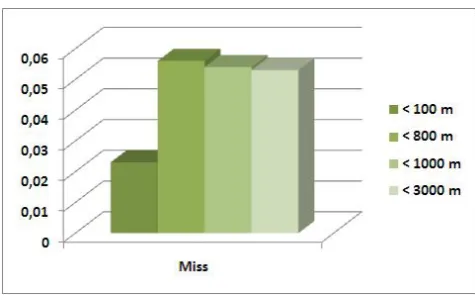
[image:4.595.313.551.573.718.2]Figure 3 shows miss frequency for 4-hour nowcasts under the threshold of 800m for five points. Figure 4 shows miss frequency for 4-hour nowcasts against threshold for one nowcast point (“Biathlon stadium”). All values are small enough (0.05 or less). This means that most of low visibility cases were forecasted. This corresponds to the results of bias calculations.
Figure 4. Miss frequency against forecast threshold.
[image:5.595.315.553.236.379.2]Figure 5 shows probability of detection (POD) or hit rate (H) for 4-hour nowcasts under the threshold of 800m for five points. The range of the calculated values under the threshold of 800m for different points is 0.3 to 0.7. The values of POD (H) for the point “Biathlon stadium” are highest in comparison with other ones, likely due to the fact that sample size for the point is the biggest one. Figure 6 shows POD for 4-hour nowcasts under various thresholds for one nowcast point (“Biathlon stadium”). The value of POD has a tendency to increase with a threshold, being equal to 0.4 under 100m and reaching 0.75 under 3000m.
Figure 5. POD (Hit rate) for different points, threshold of 800 m.
Figure 6. POD against forecast threshold.
Figure 7 shows false alarm rate (F) for 4-hour nowcasts under the threshold of 800m for five points. Values of F are less than 0.05 for all points, indicating a low number of false alarms on average. Figure 8 shows false alarm rate for 4-hour nowcasts against threshold for one point (“Biathlon stadium”). F increases with the threshold, being less than 0.06 in any case.
[image:5.595.55.295.381.701.2]Results of H and F calculations show quite reasonable relation between these verification metrics (F →0, and H-F>0.6 under the threshold of 800m and higher) and indicate adequate forecast quality, since a good forecast should have high hit rates and a low false alarm rates.
Figure 7. False alarm rate for different points, threshold of 800 m.
Figure 8. False alarm rate against forecast threshold.
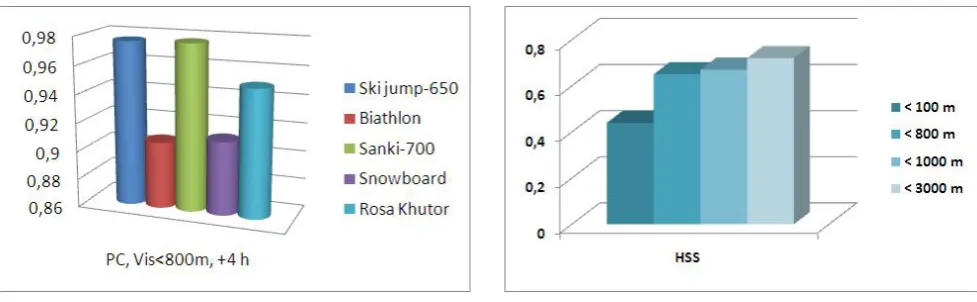
[image:5.595.306.551.409.555.2]Figure 9. Proportion correct for different points, threshold of 800 m.
Figure 10. Proportion correct against forecast threshold. Figure 11 shows Heidke Skill Score (HSS) for 4-hour nowcasts under the threshold of 800m for five points. All five values of HSS are less than 0.7, two of them being less than 0.2. Figure 12 shows HSS for 4-hour nowcasts against threshold for one point (“Biathlon stadium”). HSS lies in the range of 0.6 to 0.7 under thresholds of 800m and higher, and decreases to 0.4 under the threshold of 100 m.
Figure 11. HSS for different points, threshold of 800 m.
Figure 12. HSS against forecast threshold.
Pierce Skill Score (PSS) does not depend on base rate. Figure 13 shows PSS for 4-hour nowcasts under the threshold of 800m for five points. All calculated values of PSS are within range of 0.3 to 0.7. Figure 14 shows PSS for 4-hour nowcasts against threshold for one nowcast point (“Biathlon stadium”). The PSS values lie in the range of 0.6 to 0.7 under thresholds of 800m and higher, and decrease to less than 0.4 under the threshold of 100 m.
Figure 13. PSS for different points, threshold of 800 m.
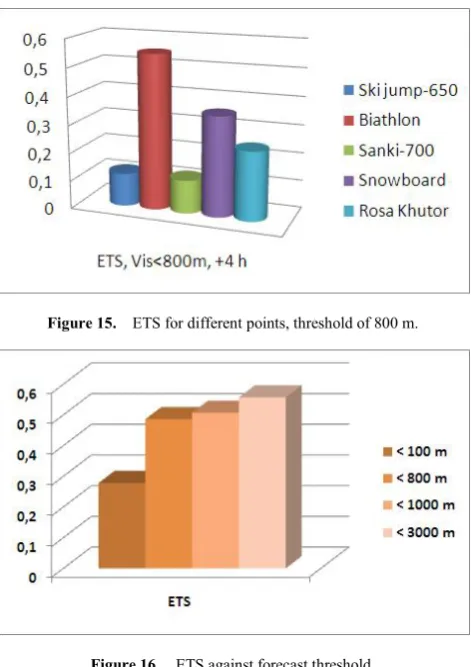
[image:6.595.58.554.354.665.2]Figure 15 shows Equitable Threat Score (ETS or GSS) for 4-hour nowcasts under the threshold of 800m for five points. Figure 16 shows ETS for 4-hour nowcasts under various thresholds for one point (“Biathlon stadium”). The ETS values for the point lie in the range of 0.4 to 0.5, approximately, under thresholds of 800m and higher, and decrease to 0.2 under the threshold of 100m.
Figure 15. ETS for different points, threshold of 800 m.
Figure 16. ETS against forecast threshold.
Odds Ratio Skill Score (ORSS) is base-rate independent, equitable in some sense, and regular. Figure 17 shows ORSS for 4-hour nowcasts under the threshold of 800m for five points. Figure 16 shows ORSS for 4-hour nowcasts under various thresholds for one point (“Biathlon stadium”).
Figure 17. ORSS for different points, threshold of 800 m.
Figure 18. ORSS against forecast threshold.
All calculated ORSS values exceed 0.9, depending on forecast threshold slightly (from 0.94 to 0.96 under the threshold from 100m to 3000m). ORSS is preferable to all of the previously calculated skill scores (HSS, PSS, and ETS) due to its equitability in some sense, regularity and independence of base rate.
Figure 19 shows EDI for 4-hour nowcasts under various thresholds for one point (“Biathlon stadium”). Figure 20 shows SEDI for 4-hour nowcasts under various thresholds for one point (“Biathlon stadium”).
[image:7.595.58.298.171.314.2]Figure 19. EDI against forecast threshold.
Figure 20. SEDI against forecast threshold.
Both EDI and SEDI values are in the range 0.6 to 0.81, depending on forecast threshold.
[image:7.595.77.551.366.727.2] [image:7.595.299.549.370.702.2]of extremly low visibility (< 100 m) are one and a half or two times less than their values for other cases (see Fig.12, Fig.14, and Fig.16). ORSS, EDI and SEDI decrease for very rare events slightly (see Figs.18-20). Measures EDI and SEDI were shown [7] to overcome all drawbacks which are a feature of other measures used for verification forecasts of rare events. So, ORSS, EDI and SEDI seem to be the most appropriate measures to use for rare events such as low visibility. Other skill scores are worth obtaining due to their simplicity and usability. They are widely adopted for verification, and therefore it is useful to estimate them.
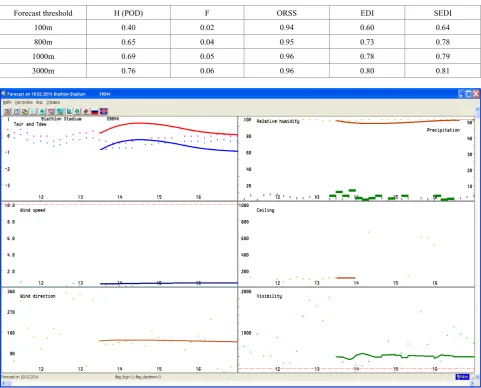
Values of ORSS, EDI, and SEDI together with hit rate and false alarm rate are summarized in Table 3. For low visibility (less than 1000 m) hit rate is nearly 0.7 whereas false alarm
rate is 0.05 only; values of ORSS are above 0.9; EDI and SEDI are nearly 0.8. So far as value of 1 is an attribute of the skill scores of a perfect forecast, the results demonstrate quite good accuracy of the forecasts, though the position of the point 2 is on a mountain ridge at a level of clouds which advection can result in sharp visibility reduction.
[image:8.595.64.546.280.668.2]Useful tool was provided also for online forecast verification when any forecast was displayed together with observations. An example is shown in figure 21 where air temperature, dew point temperature, relative humidity, wind speed and direction, precipitation, cloud ceiling height, and visibility forecasts against observation are visualized. A client can analyze easily how good forecasts were produced by the system at any time.
Table 3. Values of selected verification measures against forecast threshold
Forecast threshold H (POD) F ORSS EDI SEDI
100m 0.40 0.02 0.94 0.60 0.64
800m 0.65 0.04 0.95 0.73 0.78
1000m 0.69 0.05 0.96 0.78 0.79
3000m 0.76 0.06 0.96 0.80 0.81
In the Figure 21, a case of low visibility caused by precipitation on the 18 of February 2014 at a location of “Biathlon stadium” is displayed. That day, visibility dropped down strongly, and decision-makers monitored weather conditions closely so to take a decision about postponement of open air competition (such as biathlon), if it would be necessary, and about helicopter take-off in case of emergency. The minimal forecasted and observed value of visibility was below 200 m. The MeteoExpert system generated forecasts of precipitation and visibility which were in good agreement with observations, providing correct information to take a right decision.
4. Conclusions
The MeteoExpert system provided 4-hour nowcasts with 10 minute update cycle for the Sochi-2014 Olympic venues in mountain cluster. Results of verification are presented which demonstrate their good accuracy. Thresholds were chosen in correspondence with operating regulations that are directly relevant to the customers concerned to the Games (forecasters, referees, organizers) and to aviation (especially, for meteorological providing of helicopters).
Verification scores ORSS, EDI and SEDI seem to be the most appropriate scores to use for rare events since they overcome shortcomings peculiar to other verification measures. For 4-hour visibility forecasts of the MeteoExpert system, values of ORSS are above 0.9, EDI and SEDI are nearly 0.8 at visibility less than 1000 m. Considering that the scores of a perfect forecast reach 1, the results indicate good forecast accuracy.
Objective verification facilitates improvements. The MeteoExpert system performance in respect of nowcasting has been further enhanced. Additional observations (pyranometers data, soil temperature measurements, and data of runway surface analyzers) are assimilated. Advection is also taken into account in some way to consider fog transfer to an airdrome area from foggy sites where additional automatic weather stations are installed. The system has been used operationally for more than two years to produce short range forecasts for two airports (in Saint Petersburg, and in Irkutsk). Forecasts are verified
monthly. Onset time accuracy for high-impact events (fog, precipitation, and icy conditions on the airdrome) is evaluated together with other verification measures. Information is provided to the customers regularly.
Further improvement is expected with better initialization connected with the using of additional measurements. Mainly for humidity, available observations are insufficient. The observations required are vertical profiles, so that remote sensors such as profilers and AMDAR data are possible options for an airport. Nowcasting of precipitation type and intensity using dual-polarization radar data is also subject to improvement. This information is valuable itself and at the same time can result in visibility parameterization improvement.
REFERENCES
[1] Online available from http://www.metoffice.gov.uk/aviation/ sadis/software
[2] T. Bazlova, N. Bocharnikov, A. Solonin. The MeteoExpert system of IRAM. 1st European Nowcasting Conference, 2014,
Vienna, Austria.
[3] T. Bazlova. Weather stations for Sochi 2014. Meteorological Technology International, 142-145, August 2014.
[4] ICAO Annex 3 to the Convention on International Civil Aviation. Meteorological Service for International Air Navigation. 2013.
[5] I. T. Jolliffe, I.T., D.B. Stephenson. Forecast Verification: A Practitioner's Guide in Atmospheric Science. 2nd Edition. Wiley and Sons Ltd, England, 2012.
[6] D. S. Wilks. Statistical Methods in the Atmospheric Sciences. 3rd Edition, Elsevier, 2011
[7] C. A. T. Ferro, D.B. Stephenson. Extremal Dependence Indices: improved verification measures for deterministic forecasts of rare binary events. Wea. Forecasting, 26, 699-713, 2011.