Streamwise Vorticity in the Wake of a Sliding
Bubble
R. O’Reilly Meehan, D.B. Murray
Abstract—The dynamics of bubbly flows are rich and varied, with the understanding of these flows a major issue for many engineering applications. Although a large body of work exists for bubbles rising in an unbounded medium, that of bubbles rising in constricted geometries has received less attention. The particular case of a bubble sliding underneath an inclined surface is common to two-phase flow systems such as shell and tube heat exchangers, mineral flotation and oxidation in water treatment. Prior work by the authors has quantified the surface heat transfer of a single air bubble sliding under a heated surface, showing that enhanced heat transfer is achievable for gas bubbles, even at low wall superheats. The current study intends to expand this knowledge by performing experiments to quantify the streamwise flow structures associated with a single sliding air bubble under an inclined surface in quiescent water and adiabatic conditions. This is achieved by means of two-dimensional, two-component particle image velocimetry (PIV), performed with a continuous wave laser and high-speed camera. PIV velocity and vorticity fields obtained in a plane perpendicular to the sliding surface show that there is significant bulk fluid motion away from the surface, likely contributing to the aforementioned heat transfer enhancement. Additionally, the associated momentum of the bubble means that this wake motion persists for a significant time before viscous dissipation. Bubbles in the shape regime defined by the Reynolds, Morton and Weber numbers are ellipsoidal and experience path oscillations. The magnitude and direction of the flow structures in the streamwise mea-surement plane are found to depend on the point on its path through which the bubble enters the plane. This entry point, represented by a phase angle, affects the nature and strength of the vortical structures. Previous work has shown that streamwise vorticity downstream of the bubble is key to understanding these flow structures and their effects on fluid mixing. The current study reconstructs the vorticity field in the wake of the bubble, converting the field at different instances in time to slices of a large-scale wake structure. This is, in essence, Taylor’s “frozen turbulence” hypothesis. Applying this to the obtained vorticity fields provides a pseudo three-dimensional representation from 2-D data, allowing for a more intuitive understanding of the bubble wake. This study provides insights into bubble behaviour for a configuration that is ubiquitous to engineering applications, and will aid in the interpretation of previously obtained surface heat transfer measurements.
Keywords—bubbly flow, particle image velocimetry, two-phase flow, wake structures
I. INTRODUCTION
T
HE motion of bubbles through fluids has attracted con-siderable attention for many years due to its prevalence in engineering applications. In addition to this, the coupling between the complex fluid mechanics in the bubble wake and the dynamics of bubble motion is a topic that has drawn particular interest. It has also been found that vapour andR. O’Reilly Meehan and D.B. Murray are with the Department of Mechan-ical and Manufacturing Engineering, Trinity College Dublin, Ireland. e-mail: [email protected].
gas bubbles can significantly increase convective heat transfer rates between liquids and adjacent surfaces, particularly at low wall superheats. One such situation is the impact and subsequent sliding of a bubble along a heated inclined surface. This situation is applicable to many industrial processes, particularly shell and tube heat exchangers in the nucleate boiling regime. In multiphase flow systems, bubbles play a large part in determining the process efficiency, although the mechanisms responsible for the heat transfer enhancement are not fully understood [1]. Although a large body of work exists for bubbles rising in an unbounded medium, that of bubbles rising in constricted geometries has received less attention in the literature. The particular geometry of interest to the current study is an inclined plate. In such a configuration, all walls besides the inclined wall are negligible. These bubbles can take on different shapes and paths depending on the properties of the bubble and the surrounding fluid, namely the Reynolds, E¨otv¨os, and Morton numbers. Air bubbles of intermediate diameter in water are in the ellipsoidal regime, and were found by Clift et al. [2] to experience oscillations in shape and path triggered by the bubble wake, which is the region of non-zero vorticity downstream of the bubble.
Flow field measurement can provide an insight into the fluid mechanics of complex bubbly flows, with particle image velocimetry (PIV) among the most ubiquitous. Br¨ucker [3] performed 2-D PIV on a freely rising bubble, finding that the flow field in a perpendicular plane downstream of the bubble consisted of a pair of counter-rotating vortices alternately generated close to the bubble base. Regions of concentrated vorticity were observed at the locations of maximum surface curvature of the bubble. By combining information acquired in two 2-D planes, the author deduced that the structures in three dimensions formed a chain of hairpin vortex loops of alternate circulation and orientation. Hairpin vortices have also been identified as a mechanism in near-wall turbulence [4] and bluff bodies [5], [6]. Zenit & Magnaudet [7] also used PIV to study the rising bubble wake, performing streamwise measurements of vorticity in a plane downstream of a rising bubble. In their experiments, the authors revealed two counter-rotating regions of vorticity stretching to the rear of the bubble.
rising bubbles [3]. A complete knowledge of this multiphase process is thereby incomplete without a knowledge of the bubble wake. Thus, the current study intends to quantify the streamwise flow structures associated with a single air bubble sliding under an inclined surface submerged in quiescent water.
II. EXPERIMENT AND ANALYSIS
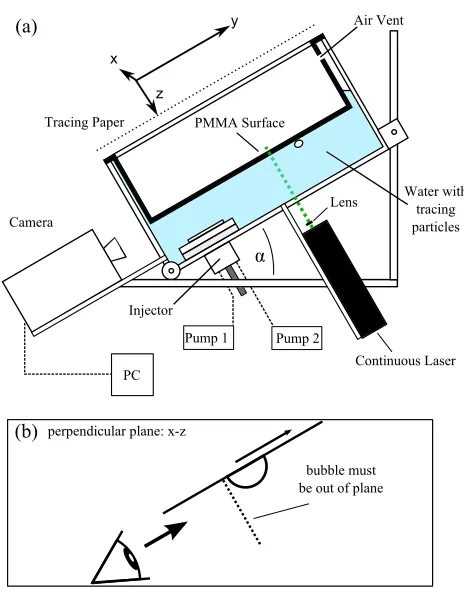
The experimental apparatus for this study, shown in figure 1 (a), is an inclined glass tank mounted in an aluminium support structure with a PMMA surface under which the bubble slides. The tank is an open top box of internal dimensions
300×108×200mm3and contains the bubble injection system
in the base. Two stainless steel wheels, brackets and a steel rod are used to secure the tank in place at inclination angles, α, of 20◦, 30◦and 40◦to the horizontal. Angles are measured using an inclinometer accurate to within 0.1◦. The tank is filled with deionised water and 10 µmdiameter hollow glass spheres (Dantec Dynamics 80A6011) as tracer particles for PIV measurements. Bubbles are introduced to the surface by an injector system comprising of an acetal copolymer box, gastight syringe (model Hamilton 1000 series GASTIGHT, 5 ml), silicone rubber tubing, a syringe needle, a syringe pump (NE-1000 from New Era Pump Systems, Inc.) and a rotating plate. The acetal box is mounted on a polycarbonate flange bonded to the base of the tank. Inside the box, a series of small bubbles are introduced via the syringe pump and 5mm internal diameter tubing into a cylindrical bubble chamber, coalescing to form a bubble of known size. By rotating a circular plate above this chamber, the bubble is released from the chamber. The bubble rises from the release mechanism, impacts the surface and slides up into the measurement region. Upon reaching the measurement region, the bubbles are at their terminal velocity and are no longer bouncing. This design allows for PIV to be performed in the streamwise direction of the bubble without the injector blocking the view of the camera.
Particle image velocimetry (PIV) is based on the principle of illuminating small, neutrally buoyant seeding particles in the working fluid using a high intensity stroboscopic light sheet, and tracking the displacement of these particles. The current study uses an Optotronics VA-II-2000-532 continuous wave laser (2W maximum power, beam divergence 3±0.2mrad), a plano-concave cylindrical lens and lens mount to provide a 1.2mm thick green beam of 532nm wavelength. To record the fluid motion, a PhantomV311high speed camera (1280 x 800 CMOS sensor, 20 µm pixel size) is used, controlled by a dedicated computer using the Phantom Camera Control 1.3 (P CC) software package. For these experiments, a frame-rate of 1000 Hz is sufficient to capture the fluid behaviour, with the exposure time set to 30 µs.
The flow fields herein are evaluated frame-by-frame using a continuous wave laser, which differs to the double-pulsed systems more common to stroboscopic PIV measurement. This is because temporal resolution of the time scales of the flow requires a very short repetition rate between successive image pairs. In this study, the relatively low flow velocity and the
PC
Pumpd1 Camera
Injector Tracingd Paper
Aird Vent
PMMAdSurface
α
Continuousd Laser Water with
tracing particles
Pumpd2 x
Lens
perpendiculardplane:dx-z
bubbledmustd bedoutdofdplane (a)
(b)
z
y
Fig. 1: (a) Schematic of experimental apparatus used in the current study, (b) the three planes in which PIV is performed.
high frame-rate of the camera allow for stroboscopic imaging of the tracer particles without streaking, in lieu of a high frequency double-pulsed laser. Measurements are performed in a perpendicular plane at sy = 80 mm that looks at the
streamwise structures after the bubble has passed through the plane.
All PIV vectors for the current study are evaluated using the Insight4G V3V PIV package provided by TSI and are post-processed in MATLAB in order to present instantaneous veloc-ity and vorticveloc-ity plots. The PIV algorithm in Insight applies a multi-pass, multi-grid correlation with image deformation [12] and Gaussian sub-pixel fitting that decreases in size from 32
×32 to 16×16 pixels in 3 passes, applying a 50% window overlap for the first pass and a 75% overlap in the subsequent two passes.
In the current study, the methods discussed by Zenit & Magnaudet [7] are used to reconstruct the streamwise wake structures to the rear of the bubble. This is converts the vorticity a different instances in time into a pseudo three-dimensional vortex element, with the distance between ad-jacent cross sections ∆sy given by ∆sy = Ubt, where
Ub is the bubble velocity. This can be considered as an
[image:2.612.322.554.51.347.2]the flow structures in a time/space plot, particularly in terms of the downstream mixing offered by a sliding bubble.
III. RESULTS& DISCUSSION
PIV results are presented at a surface inclination angle, α, of 30◦ to the horizontal and an equivalent bubble diameter de = 5.8 mm. The measurement plane is fixed in space
perpendicular to the surface at the position sy = 80 mm.
Bubbles of this size are in the ellipsoidal shape regime as in Clift et al. [2] and experience undulating path oscillations in the spanwise direction as they traverse the surface. In a study on the wakes of freely rising ellipsoidal bubbles, Br¨ucker found the mode of vortex shedding to be that of hairpin vortices separating from the near wake of the bubble at the extrema of the path. As such, for these measurements it is useful to define the phase angle, φ, as the location along the bubble’s undulating path corresponding to its entry point to the plane. The bubble path and phase angle are shown in figure 2. In this study, results are presented at two different phase angles, corresponding to the bubble entering the measurement plane at a local minimum and a local mean of its path.
−1
0 1
φ(t)
s x /d e
φdetermines fluid motion observed
φ=90°]o
°]
s
x /s
x,max
φ °]
s
x /s
x,ma
[image:3.612.314.564.56.129.2]=180o
Fig. 2: Illustration showing that the magnitude and direction of structures observed in the perpendicular plane are dependent on the phase angle.
Figure 3 shows the near-wake visualisation for φ= 90◦ at two instances in time after the bubble passage, averaged over a range of images to show the motion of the tracer particles. The position sx = 0 corresponds to the bubble entry point,
whilesz= 0is the PMMA surface. After the bubble passage,
the fluid in the near wake forms a high velocity, counter-clockwise rotating region that overshoots the bubble path in the negative spanwise direction. At the same time, a region of fluid beneath the surface is advected towards the surface. This is conceivably the recirculation region to the rear of the bubble in its near wake. Later in time, the eddy initially shed at the local minimum has continued to overshoot the bubble path in the negative spanwise direction.
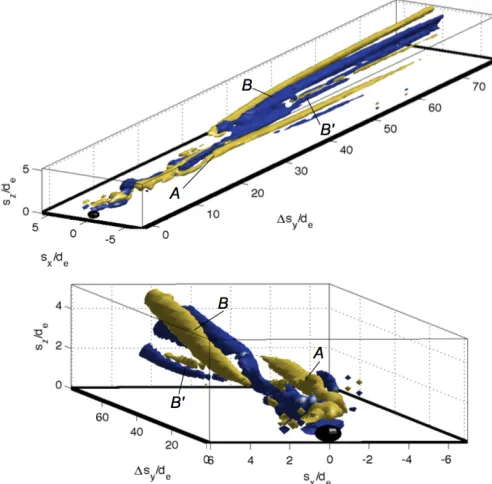
In these experiments, PIV is being performed on a three-dimensional wake that is being advected through the plane due to the momentum of the bubble. To provide an understanding of the flow structures in the streamwise direction, the vor-ticity fields are converted into slices of the flow at different streamwise distances from the bubble, ∆sy. The wake is
reconstructed to show the in-plane mixing as isosurfaces of vorticity at Ω = ±1.3, which is calculated as the curl of
Fig. 3: Raw images of the near wake at two instants in time for α= 30◦,de= 5.8mm,φ= 90◦.
[image:3.612.313.559.246.488.2]the x−z velocity field. Figure 4 shows these isosurfaces of vorticity for φ = 90◦. These are provided for two views, in which the bubble is at the origin and the surface is shown by the white rectangle.
Fig. 4: Streamwise reconstruction of vorticity for isosurfaces of Ω =±1.3 for α= 30◦,de = 5.8mm,φ= 90◦. The key
structuresA,B andB0 are also highlighted.
[image:3.612.57.291.335.442.2]the plane. This region is high in velocity and spreads away from the surface, causing significant mixing. Some secondary fluid structures are also observed that are consistent with the findings of Acarlar and Smith for a near-wall bluff body flow [5]. One such example of these are the secondary vortex pair B0. These could be due to the interactions that occurred between the hairpin vortex loops atB and the quiescent bulk fluid before the structure entered the plane.
Fig. 5: Raw images of the near wake at two instants in time for α= 30◦,de= 5.8mm,φ= 0◦.
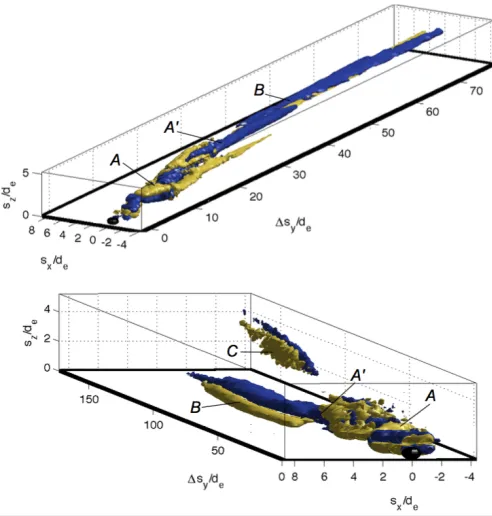
The near-wake visualisation forφ= 0◦is provided in figure 5 for the bubble entering the plane at the mean spanwise displacement. The near wake forms a clockwise rotating region that overshoots the bubble path in the positive spanwise direc-tion, corresponding to the vortex shed at the previous local maximum. The near wake velocity is greater for φ= 0◦ than was the case for φ= 90◦. Figure 6 shows the corresponding isosurfaces of vorticity for α = 30◦, de = 5.8 mm, and
φ = 0◦. These are again provided for two views, where the bottom view has a longer ∆sy dimension. There are subtle
differences between these structures and those observed at φ = 90◦. The fluid disturbance caused by the near wake of the bubble, A, is greater in velocity and persists for a longer time than the corresponding regionAin figure 4. This leads in to the second primary region that enters the plane at B, which corresponds to fluid shed from the previous local maximum in path, does so earlier than for theφ= 90◦, with the majority of this motion remaining close to the surface. Finally, a greater distance downstream of the bubble, a third structure C enters the plane, which is the fluid shed at the previous local minimum of the bubble path.
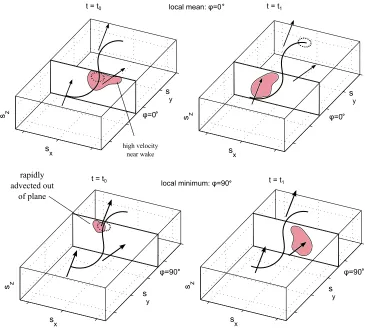
A sketch describing the dependence of the wake structures observed on the phase angle is provided in figure 7. The bubble and its path are shown for both phase angles at two instants in time, t0 andt1. The direction of the bubble wake is indicated
on the figure by means of arrows; this is shed from the bubble at the local path extrema and continues to overshoot the path in the spanwise and length directions. When the bubble enters the plane at φ= 0◦, high velocity fluid from the near wake shed at the previous local maximum (φ= 270◦) follows soon after, and is advected through the plane and in the positive spanwise direction. This results in a high magnitude region of vorticity in the near wake for φ = 0◦. At some time t1
later, the wake shed at the previous local minimum of path (φ= 90◦) enters the plane, with low velocity.
[image:4.612.49.299.164.239.2]For the bubble at φ = 90◦, the wake separates from the bubble as it enters the plane; however, the momentum of the bubble means that this structure is advected through the plane rapidly and appears lower in magnitude than the φ= 0◦. At
Fig. 6: Streamwise reconstruction of vorticity for isosurfaces of Ω =±1.3 for α= 30◦, de = 5.8mm, φ= 0◦. The key
structuresA,A0,B andC are also highlighted.
a time t1 later, the wake structure shed at the previous local
maximum (φ= 270◦) enters the plane. Although the structures observed at different phase angles vary slightly, the isosurfaces of vorticity provided in figures 4 and 6 are indicative of a wake structure that separates from the bubble at the extrema of bubble path and spreading normal from the surface. This initially causes a significant disturbance of the bulk fluid in the near wake, which acts close to the surface. Later in time, the wake structure decreases in strength but spreads away normal to the surface, causing a large affected region of fluid.
IV. CONCLUSION
An experimental study has been conducted on the flow field associated with a bubble sliding under an inclined sur-face. This is achieved by means of dimensional, two-component particle image velocimetry (PIV), performed with a continuous wave laser and high-speed camera. Streamwise vorticity measurements revealed periodically shed vortices that develop in coherent pairs. These vortices spread outwards into the bulk fluid, increasing in size but decreasing in strength rapidly due to viscous dissipation and out-of-plane motion. A single sliding bubble creates an affected region many bubble diameters in size, with fluid motion persisting for several seconds after the bubble passage.
y
sx
s z
s
y
sx
s z
s
y
sx
s z
s y
sx
s z s
φ=0 φ=0
φ=90 φ=90
local mean: φ=0
local minimum: φ=90
t = t0 t = t1
t = t0 t = t1
rapidly advected out
of plane
[image:5.612.124.489.60.388.2]high velocity near wake
Fig. 7: Sketch showing the structures observed in the PIV measurement planes at the two phase angles at two times t0 and
t1. The bubble location and path are provided, and the arrows indicate the motion of the shed fluid in the bubble wake.
engineering applications, and will aid in the interpretation of previously obtained surface heat transfer measurements.
ACKNOWLEDGMENT
The authors would like to acknowledge the financial support of the Irish Research Council (IRC) under grant number EPSPG/2012/323.
REFERENCES
[1] G. Sateesh, S. Das, and A. Balakrishnan, “Analysis of pool boiling heat transfer: effect of bubbles sliding on the heating surface,”International Journal of Heat and Mass Transfer, vol. 48, no. 8, pp. 1543–1553, 2005. [2] R. Clift,Bubbles, drops, and particles. DoverPublications.com, accessed
06/09/13, 2005.
[3] C. Br¨ucker, “Structure and dynamics of the wake of bubbles and its relevance for bubble interaction,”Physics of Fluids, vol. 11, p. 1781, 1999.
[4] R. Adrian and Z. Liu, “Observation of vortex packets in direct numerical simulation of fully turbulent channel flow,” Journal of Visualization, vol. 5, no. 1, pp. 9–19, 2002.
[5] M. Acarlar and C. Smith, “A study of hairpin vortices in a laminar boundary,”Journal of Fluid Mechanics, vol. 175, pp. 1–83, 1987. [6] B. Stewart, M. Thompson, T. Leweke, and K. Hourigan, “Numerical
and experimental studies of the rolling sphere wake,”Journal of Fluid Mechanics, vol. 643, no. 1, pp. 137–162, 2010.
[7] R. Zenit and J. Magnaudet, “Measurements of the streamwise vorticity in the wake of an oscillating bubble,”International Journal of Multiphase Flow, vol. 35, no. 2, pp. 195–203, 2009.
[8] T. Maxworthy, “Bubble rise under an inclined plate,”Journal of Fluid Mechanics, vol. 229, pp. 659–674, 1991.
[9] A. Peron, L. Kiss, and S. Poncs´ak, “An experimental investigation of the motion of single bubbles under a slightly inclined surface,”International Journal of Multiphase Flow, vol. 32, no. 5, pp. 606–622, 2006. [10] B. Podvin, S. Khoja, F. Moraga, and D. Attinger, “Model and
exper-imental visualizations of the interaction of a bubble with an inclined wall,” Chemical Engineering Science, vol. 63, no. 7, pp. 1914–1928, 2008.
[11] B. Donnelly, R. O’Reilly Meehan, K. Nolan, and D. B. Murray, “The dynamics of sliding air bubbles and the effects on surface heat transfer,”
International Journal of Heat and Mass Transfer, vol. 91, pp. 532–542, 2015.