A m e t h o d t o d e t e r m i n e t h e
i m p a c t of r e d u c e d vis u al fu n c ti o n
o n n o d u l e d e t e c ti o n p e r f o r m a n c e
T h o m p s o n , JD, L a n ç a , C, L a n ç a , L a n d H o g g , P
h t t p :// dx. d oi.o r g / 1 0 . 1 0 1 6 /j. r a di. 2 0 1 6 . 0 7 . 0 0 2
T i t l e A m e t h o d t o d e t e r m i n e t h e i m p a c t of r e d u c e d vis u al f u n c tio n o n n o d u l e d e t e c tio n p e r f o r m a n c e
A u t h o r s T h o m p s o n , JD, L a n ç a , C, L a n ç a , L a n d H o g g , P
Typ e Ar ticl e
U RL T hi s v e r si o n is a v ail a bl e a t :
h t t p :// u sir. s alfo r d . a c . u k /i d/ e p ri n t/ 4 0 2 1 8 / P u b l i s h e d D a t e 2 0 1 7
U S IR is a d i gi t al c oll e c ti o n of t h e r e s e a r c h o u t p u t of t h e U n iv e r si ty of S alfo r d . W h e r e c o p y ri g h t p e r m i t s , f ull t e x t m a t e r i al h el d i n t h e r e p o si t o r y is m a d e f r e ely a v ail a bl e o nli n e a n d c a n b e r e a d , d o w nl o a d e d a n d c o pi e d fo r n o
n-c o m m e r n-ci al p r iv a t e s t u d y o r r e s e a r n-c h p u r p o s e s . Pl e a s e n-c h e n-c k t h e m a n u s n-c ri p t fo r a n y f u r t h e r c o p y ri g h t r e s t r i c ti o n s .
Introduction
It is recognised that interpretation errors occur in radiology and while it is more difficult to
assign a definitive cause for them, they are typically split into three different classes: search,
recognition, and decision.1 There has been a heavy focus on error in medical imaging
research, in an attempt to both understand and reduce the cause. A broad investigation of
error requires consideration of confounding factors, such as education and training,
expertise, visual perception and search.2–10
Fatigue is known to have an impact on error rates, where there is a reduction in optimal
cognitive performance. It has also been found to have a negative influence on observer
performance11,12 and some work has been devoted to methods that can help combat the
effects of fatigue.13,14 Ikushima et al13 have assessed the relationship between fatigue and
visual acuity, finding visual acuity to be better when there is less fatigue. However, very
little work has investigated the impact of sub-optimal visual acuity on observer
performance.15
This may present a problem in radiology. Visual acuity is known to decrease with age and
currently there is no legal requirement for radiologists or reporting radiographers to
undergo a vision test on a regular basis. Safdar et al16 allude to this where they point out
that while a great deal of attention has been paid to the quality control of digital displays,
the same cannot be said for those who examine images. They continue to explain that not
every radiologist in their study of visual acuity had 20/20 vision. Two key points were made:
(i) some of the radiologists required visual correction and, (ii) some had gone without a
vision test for 15 years. Without a regular vision test it can be difficult for an individual to
recognize that their quality of vision has reduced. The symptoms of decreased visual
function may be gradual and may not be perceived by the individual to be related to vision
and they may complain of other secondary symptoms like headaches or red, sore, watery
eyes. We hypothesize that a reduction in visual acuity, consistent with age, may have a
negative impact on observer performance (i.e. a reporting task). We believe that there
cannot be many other professional roles that have the potential to be so dependent on
visual acuity, and also have the chance to be so heavily influenced by a reduction in acuity.
Several measurements of visual function have been proposed to help determine the impact
artificially induce a reduction in visual function and assess observer performance
concurrently with a nodule detection task.
Method
We assess nodule detection performance and visual function under normal conditions (no
reduction in visual acuity) and with two-levels of optically induced eye defocus. Observer
responses were collected under the free-response receiver operating characteristic (FROC)
paradigm. Ethical approval was granted by the Lisbon School of Health Technology.
Visual function assessment and visual defocus
Optically induced defocus was applied with lenses in order to reduce retinal image contrast
and alter the spatial frequency,18 thus causing a blurring effect for near vision. The refractive
power (dioptres; D) of an optical system is the reciprocal of the focal length of a lens.19
Defocus using lenses in the magnitude of -1.00 D, -2.00 D and 0.00 D were applied to the
observers in a random order.
Prior to each image evaluation, each observer’s visual function was assessed to ensure it
was within normal limits. Visual function was not expected to be within normal limits when
the lenses were applied to induce defocus, as the purpose of the work was to assess
observer performance with reduced visual acuity. The acceptable limits of the visual
function tests used are described in Table 1. The tests for visual function assessment in
medical imaging research are described in more detail in a previous paper.17 Contrast
sensitivity was measured only prior to defocussing vision; this was to ensure that the
contrast sensitivity of the observers was within normal limits for performing visual tasks
prior to beginning the observer study.
Visual Function Test Summary of Observer Requirements
Visual Acuity Near visual acuity should be better than:20
20/50
Contrast Sensitivity Considered normal when:21
≥1.61 for gratings of 3 cycles per degree
≥1.08 for gratings of 12 cycles per degree
≥0.56 for gratings of 18 cycles per degree
Stereoacuity Normal values should be equal or smaller than:22
50 seconds of arc
Table 1: A summary of acceptable visual function for the tests used to evaluate visual function prior to the
image evaluations. With a visual acuity of 20/50 for near vision the observer can read a column of newsprint
with an 8-point font size. Contrast sensitivity values are for mesopic conditions (low light level). The
instrument automatically controls the test lighting to a level of 85 cd/m2.Stereoacuity is better when the
angle is smaller.
Prior to completing an image evaluation with lenses (i.e. at -1.00 D and -2.00 D) an
adaptation period of ten minutes was enforced. There is no current standard for this, as it is
not typical to make the vision of an observer worse before they begin an observer
performance study. However, we felt that an adjustment period was appropriate, but that
should remain short since previous work has identified blur adaptation to lenses in the
magnitude of 2.00 D, with improved visual performance after wearing lenses for 60
minutes.23 Each image evaluation lasted approximately 40 minutes. Rest periods were
permitted, but no observer required a break mid-evaluation.
Image Display
Postero-anterior radiographic images of an anthropomorphic chest phantom were used for
the observer study. Images of the phantom without simulated nodules were considered
‘normal’. Images of the phantom containing different configurations of simulated nodules of
5, 8, 10 and/or 12 mm spherical diameter were considered abnormal. All nodules were
placed within the phantom and we did not use any digitally superimposed nodules in this
study. For the observer study there were 50 different configurations of nodule position,
with 1-4 nodules present in each abnormal image. A nodule of each size could only appear
once in each abnormal image but there was freedom to place the nodules in any position
within the simulated lung fields of the phantom. Twenty-five normal cases were also used.
Images were displayed on a 2.3-megapixel monitor (Barco MFCD 1219, Barco, Belgium)
calibrated to the DICOM greyscale display function standard. Ambient luminance in the test
Observer Performance Study
Three consultant radiologists (age range 31-50, and 5-18 years reporting experience)
completed the observer study. All observers received training directed towards viewing
normal images and a sample of images containing simulated nodules that were not used in
the main study. All observers were shown how to use ROCView24 for the collection of
freeresponse data. Each observer was required to complete three image evaluations (0.00 D,
-1.00 D & -2.00 D). Images were displayed in a different randomised order for all image
evaluations. An image evaluation schedule is presented in Table 2.
Observer (Age) Evaluation 1 Evaluation 2 Evaluation 3
1 (50) -1.00 D 0.00 D -2.00 D
2 (35) -2.00 D -1.00 D 0.00 D
3 (31) 0.00 D -2.00 D -1.00 D
Table 2: Each observer completed the observer study in a different order to reduce the dependence of
evaluation order on the overall result.
Image display and the storing of free-response data were managed by ROCView.24
Observers were instructed to localise all simulated nodules. This was done using a mouse
click. Each localisation would prompt a slider-bar confidence scale (1-10) to appear. The
scale worked from left (1; low confidence) to right (10; high confidence). All localisations
were classified as either lesion localisation (LL) or non-lesion localisation (NL) using an
acceptance radius based on the size of the largest nodule.25 The mean size of largest nodule
was approximately 100 pixels; the acceptance radius was set at 50 pixels.
Statistical Analysis
Free-response data were analysed using the latest version of Rjafroc, an R (statistical
programming language) implementation of jackknife alternative free-response receiver
operating characteristic (JAFROC) analysis; available from
https://cran.rproject.org/web/packages/RJafroc/index.html. The equally weighted JAFROC
rating is rated higher than a non-lesion rating on a normal case.26 A random reader fixed
case analysis is reported for this phantom study. A difference in nodule detection
performance would be considered significant at p<0.05.
Results
Visual Function Assessment and Visual Defocus
The results of the visual function assessment are summarised in Table 3. All observers had
acceptable visual function prior to beginning the observer study. Contrast sensitivity was
assessed with gratings of 18 cycles per degree, to assess vision at high spatial frequency. For
acceptable contrast sensitivity it should be ≥0.56 and all observers reached 1.25. This was
only measured prior to the observer study and was not measured while vision was
defocussed with lenses. Visual acuity was assessed for ‘near’ without lenses and with both
magnitudes of defocussing lenses; summarised in Table 3. Visual acuity should be equal to
or better than 20/50 for near visual tasks. We observed an expected decrease in visual
acuity in some instances when lenses were applied. For observer 1 visual acuity
deteriorated to 20/63 and 20/80 for -1.00 and -2.00 D of defocus respectively. For observer
2, visual acuity was acceptable at -2.00 D but deteriorated to 20/80 at -1.00 D. Observer 2
completed the -1.00 D evaluation first, followed by the -2.00 D evaluation. For observer 3,
visual acuity was acceptable at all levels of defocus with a small deterioration at -2.00 D.
Stereoacuity should be less than or equal to 50 seconds of arc; this was the case for all
observers with the exception of observer 1 at a defocus of -2.00 D. The youngest observer
(3) was measured to have the best visual acuity and the oldest observer (1) had the worst.
Observer
(Age)
Near Visual Acuity Stereoacuity Contrast Sensitivity
Defocus (Dioptres, D)
0.00 -1.00 -2.00 0.00 -1.00 -2.00 0.00 -1.00 -2.00
1 (50) 20/25 20/63 20/80 50 50 400 1.25 - -
2 (35) 20/10 20/80 20/50 40 40 40 1.25 - -
Table 3: A summary of the visual function for all observers. Near visual acuity and stereoacuity were
measured for normal vision (no defocus; 0.00 D), and for both levels of visual defocus (-1.00 D and -2.00 D).
Contrast sensitivity was measured only for normal vision (0.00 D).
All observers were asked if they experienced visual problems during the observer
performance study to assess tolerance to the lenses used to apply visual defocus. All
observers reported temporary blurred vision after wearing lenses to cause defocus but all
observers reported that their vision returned to normal within 2-3 minutes of removing the
lenses. The image evaluations at -1.00 D and -2.00 D were rated as ‘hard’ and ‘very hard’
respectively by all observers on a scale of ‘Easy, Normal, Hard, Very Hard, and Intense’.
Evaluations at 0.00 D were rated as ‘normal’. Only minor complaints of fatigue and
adjustment to defocus were expressed.
Observer Performance Study
Random reader fixed case wJAFROC analysis revealed that there was no significant
difference in nodule detection performance for all treatment pairs of visual defocus (F(2,4) =
3.55, p = 0.130). Specifically, the observer averaged FOM for evaluations at 0.00 D, -1.00 D,
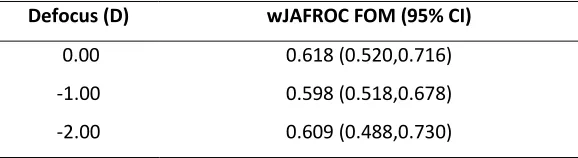
and -2.00 D were not significantly different. The wJAFROC FOM and 95% confidence interval
(CI) for all levels of defocus are described in Table 4 and in Figure 1. The inter-treatment
difference and 95% confidence intervals are shown in Figure 2. Observer averaged wAFROC
curves are displayed in Figure 3.
We also considered the impact of evaluation order on the FOM achieved; the observer
averaged wJAFROC FOM for the first, second and third image evaluation was 0.605, 0.614
and 0.606. In addition, no single observer showed an incremental improvement when
completing the second and third image evaluations.
Defocus (D) wJAFROC FOM (95% CI)
0.00 0.618 (0.520,0.716)
-1.00 0.598 (0.518,0.678)
[image:7.595.73.362.626.705.2]-2.00 0.609 (0.488,0.730)
Discussion
The aim of this paper was to validate a method to induce visual defocus and assess nodule
detection as a stepping-stone to understanding the impact of visual defocus on observer
performance. We found a measurable difference in visual function when inducing defocus
with lenses but we were unable to find a statistically significant difference in nodule
detection performance for this phantom and simulated nodules using a small sample of
radiologists. However, we cannot say that there is no radiological penalty when visual acuity
is reduced. We now need to apply this method to a range of clinical radiological
applications, such as lesion detection in mammography, where the observer task is more
difficult and varied.
Currently there is no requirement for those providing a radiological report to have a vision
test. Without any knowledge of the impact of reduced visual acuity on diagnostic tasks (i.e.
evaluation of a clinical image) we have no evidence to confirm that this is the correct
standard. It would therefore be useful to understand what level of visual defocus and
reduction in visual acuity causes a statistically significant impact on observer performance.
However, we do not assume that the same level of visual defocus will have the same impact
on all diagnostic tasks. In order to help us understand this it may also be valuable to
examine the effect of reduced visual acuity on both detection and decision error. Decision
error would relate to a clinical task such as a search for breast lesions. Detection error may
be better characterised by performing an observer evaluation using a contrast/detail
phantom. This would inform us whether the reduction in visual acuity had any impact on
detection in a signal known exactly / background known exactly (SKE / BKE) test (i.e.
whether the observer could count the same number of line pairs or contrast discs when
visual acuity was reduced).
We consider good visual acuity to be most important to those who are providing a formal
report of a medical image. However, this is also important for front line radiographers, for
example anyone involved in red-dot or commenting system for fracture. Radiographers are
skilled practitioners playing a key role in the ensuring the effective appropriate
management of acute injuries and conditions. If they are not able to complete this task to
impact on patient care. Good visual function is essential to detect the smallest objects or
resolve the finest detail.
In future work we must also consider the potential impact of fatigue. Fatigue is known to
have an influence on observer performance11,12 and visual function is known to decrease
toward the end of a radiology work day.27 Additionally, observers with sub-optimal visual
acuity use visual adaptation processes in order to overcome visual defocus 28 which may
give rise to visual symptoms and cause a quicker onset of fatigue. Therefore, we need to
separate these effects by performing observer tasks at different times of day. It would be
advantageous to compare an image evaluation with visual defocus induced by lenses at the
beginning of a radiology workday against an image evaluation at the end of a radiology
workday when the radiologist is fatigued.
A limitation of reducing visual acuity with lenses, as per our method, is that it does not truly
represent a physiological decline in visual function, as would happen with age. We accept
that this is a limitation since it could be assumed that a gradual decrease in visual function
may be compensated by an increase in experience. In the present study the oldest observer
had the worst visual function. However, nodule detection performance was similar between
observers, which may reinforce the importance of the experience factor. The impact of
experience has previously been explored: for example, it has been found that more
experienced readers tend to find lesions earlier in their search,29 while inexperienced
readers have been found to take longer to localise lesions and are more prone to error.30
We do not wish to have inexperience as a compounding source of error in our future work
and we do not believe it would be worthwhile investigating the impact of reduced visual
acuity in novice or naïve observers when we do not yet know the impact in experienced
observers. This is why we feel it is important to first devote our time to the evaluation of
those providing a formal a report on medical images, before we consider the wider
radiography profession. However, this potential offset between visual acuity and experience
is yet to be proved.
The results of our study must be interpreted in consideration of the inherent differences
between measurements obtained from simulated nodules in a phantom and those obtained
in studies with patients. A phantom study can provide methodological advantages, such as
the removal of case variation and absolute control over nodule positions. However, this does
observer to remember fifty different configurations of nodule position between evaluations.
In addition, there is no variation in the type of nodules/pathology when using this phantom
model. Nodules of lower density and different shapes and in different anatomical
backgrounds could be more difficult to detect and may have the potential to be influenced by
a reduction in visual acuity. However, this is currently unknown and we cannot state that this
is the case until a thorough investigation of wider range of clinical tasks has been completed
with a greater number of radiologists and reporting radiographers such that we can generalise
to the population. Since it is not normal to degrade vision, we cannot claim to fully understand
the impact of this. The visual adaptation processes or blur adaptation cannot be controlled
and it is possible that visual acuity may improve during the course of the image evaluation.23,31
To evaluate this, it may be useful to perform a vision test at different times while wearing the
trial lenses, or to assess whether search strategy changes over time.
Our observer study does have some limitations, but these should be considered within the
context of the purpose of this work: to outline and validate a method to assess the impact
of reduced visual acuity for diagnostic tasks.
Conclusion
A method to assess visual function and observer performance is proposed. In this pilot
evaluation we were unable to detect any difference in nodule detection performance when
using lenses to reduce visual function. We seek to apply this method to a clinical problem
using patient images.
References
1. Kundel HL, Nodine CF, Carmody D. Visual scanning, pattern recognition and
decision-making in pulmonary nodule detection. Invest Radiol. 1978;13:175-181.
doi:10.1097/00004424-197805000-00001.
2. Krupinski EA. The importance of perception research in medical imaging. Radiat Med.
2000;18(6):329-334.
3. Beam CA, Conant EF, Sickles EA. Factors affecting radiologist inconsistency in
4. Krupinski E. The role of perception in imaging: past and future. Semin Nucl Med.
2011;41(6):392-400.
5. Mello-Thoms C. How does the perception of a lesion influence visual search strategy
in mammogram reading? Acad Radiol. 2006;13(3):275-288.
doi:10.1016/j.acra.2005.11.034.
6. Manning DJ, Gale A, Krupinski EA. Perception research in medical imaging. Br J Radiol.
2005;78(932):683-685. doi:10.1259/bjr/72087985.
7. Kundel H. History of research in medical image perception. J Am Coll Radiol.
2006;3(6):402-408. doi:10.1016/j.jacr.2006.02.023.
8. Burgess AE. Visual perception studies and observer models in medical imaging. Semin
Nucl Med. 2011;41:419-436. doi:10.1053/j.semnuclmed.2011.06.005.
9. Mello-Thoms C, Chapman B. A preliminary report on the role of spatial frequency
analysis in the perception of breast cancers missed at mammography screening. Acad
Radiol. 2004;11(8):894-908. doi:10.1016/j.acra.2004.04.015.
10. Bochud FO, Abbey CK, Eckstein MP. Search for lesions in mammograms: Statistical
characterization of observer responses. Med Phys. 2004;31(1):24.
doi:10.1118/1.1630493.
11. Krupinski EA, Berbaum KS, Caldwell RT, Schartz KM, Madsen MT, Kramer DJ. Do long
radiology workdays affect nodule detection in dynamic CT interpretation? J Am Coll
Radiol. 2012;9(3):191-198. doi:10.1016/j.jacr.2011.11.013.
12. Krupinski EA, Berbaum KS, Caldwell RT, Schartz KM, Kim J. Long radiology workdays
reduce detection and accommodation accuracy. J Am Coll Radiol. 2010;7(9):698-704.
doi:10.1016/j.jacr.2010.03.004.
13. Ikushima Y, Yabuuchi H, Morishita J, Honda H. Analysis of dominant factors affecting
fatigue caused by soft-copy reading. Acad Radiol. 2013;20(11):1448-1456.
doi:10.1016/j.acra.2013.08.013.
14. Krupinski EA. Potential method for relieving fatigue in radiologists. In: Abbey CK,
Mello-Thoms CR, eds. Proc SPIE. Vol ; 2013:86731N. doi:10.1117/12.2007024.
15. Halpenny D, O’Driscoll D, Torreggiani WC. Ocular health among radiologists in the age
of PACS: is it time for our profession to open its eyes to this issue in light of existing
European legislation? Br J Radiol. 2012;85(1020):e1309-e1311.
16. Safdar NM, Siddiqui KM, Qureshi F, et al. Vision and quality in the digital imaging
environment: how much does the visual acuity of radiologists vary at an intermediate
distance? Am J Roentgenol. 2009;192(6):W335-W340. doi:10.2214/AJR.07.3515.
17. Lança C, Thompson JD, Lança L. Visual Function Assessment in Medical Imaging
Research. Radiol Technol. 2015;87(2):129-138.
18. Ravikumar S, Bradley A, Thibos L. Phase changes induced by optical aberrations
degrade letter and face acuity. J Vis. 2010;10(14):1-12. doi:10.1167/10.14.18.
19. Lang G. Ophthalmology. New York: Thieme; 2000.
20. Colenbrander A. Measuring Vision and Vision Loss. In: Duane TD, Tasman W EA, ed.
Duane’s Clinical Ophthalmology. Vol Vol 5. Philadelphia: Lippincott Williams &
Wilkins; 2001:1-42.
21. Vector Vision. CSV Norms: Contrast Sensitivity Values and Norms for the CSV-1000E.
Vector Vis. 2004. http://www.vectorvision.com/html/educationCSV1000Norms.html.
22. Lee S-Y, Koo N-K. Change of stereoacuity with aging in normal eyes. Korean J
Ophthalmol. 2005;19(2):136-139.
23. Poulere E, Moschandreas J, Kontadakis GA, Pallikaris IG, Plainis S. Effect of blur and
subsequent adaptation on visual acuity using letter and Landolt C charts: Differences
between emmetropes and myopes. Ophthalmic Physiol Opt. 2013;33(2):130-137.
doi:10.1111/opo.12020.
24. Thompson JD, Hogg P, Thompson S, Manning DJ, Szczepura K. ROCView: prototype
software for data collection in jackknife alternative free-response receiver operating
characteristic analysis. Br J Radiol. 2012;85(1017):1320-1326.
doi:10.1259/bjr/99497945.
25. Haygood TM, Ryan J, Brennan PC, et al. On the choice of acceptance radius in
free-response observer performance studies. Br J Radiol.
2013;86(1021):42313554-42313554. doi:10.1259/bjr/2013;86(1021):42313554-42313554.
26. Chakraborty DP, Berbaum KS. Observer studies involving detection and localization:
Modeling, analysis, and validation. Med Phys. 2004;31(8):2313-2330.
doi:10.1118/1.1769352.
27. Safdar NM, Siddiqui KM, Qureshi F, et al. Vision and quality in the digital imaging
environment: how much does the visual acuity of radiologists vary at an intermediate
28. Noorden G von, Campos E. Binocular Vision and Ocular Motility: Theory and
Management of Strabismus. Vol 6th ed. St Louis: Mosby; 2002.
29. Krupinski E. Influence of experience on scanning strategies in mammography. In:
Kundel H, ed. Proc SPIE 2712. Vol ; 1996:95-101. doi:10.1117/12.236845.
30. Nodine CF, Mello-Thoms C, Kundel H. Time course of perception and decision making
during mammographic interpretation. Am J Roentgenol. 2002;179:917-923.
31. Ohlendorf A, Tabernero J, Schaeffel F. Neuronal adaptation to simulated and
optically-induced astigmatic defocus. Vision Res. 2011;51(6):529-534.