O b s e r v a ti o n of li q ui d–li q ui d
p h a s e t r a n si tio n s i n e t h a n e a t
3 0 0 K
P r o c t or, JE, B ail ey, M , M o r ri s o n , I, H a k e e m , MA a n d C r o w e , I F
h t t p :// dx. d oi.o r g / 1 0 . 1 0 2 1 / a c s.j p c b . 8 b 0 7 9 8 2
T i t l e
O b s e r v a tio n of li q ui d–liq ui d p h a s e t r a n si tio n s i n e t h a n e a t
3 0 0 K
A u t h o r s
P r o c t or, JE, B ail ey, M , M o r ri s o n , I, H a k e e m , MA a n d
C r o w e , I F
Typ e
Ar ticl e
U RL
T hi s v e r si o n is a v ail a bl e a t :
h t t p :// u sir. s alfo r d . a c . u k /i d/ e p ri n t/ 4 8 8 9 1 /
P u b l i s h e d D a t e
2 0 1 8
U S IR is a d i gi t al c oll e c ti o n of t h e r e s e a r c h o u t p u t of t h e U n iv e r si ty of S alfo r d .
W h e r e c o p y ri g h t p e r m i t s , f ull t e x t m a t e r i al h el d i n t h e r e p o si t o r y is m a d e
f r e ely a v ail a bl e o nli n e a n d c a n b e r e a d , d o w nl o a d e d a n d c o pi e d fo r n o
n-c o m m e r n-ci al p r iv a t e s t u d y o r r e s e a r n-c h p u r p o s e s . Pl e a s e n-c h e n-c k t h e m a n u s n-c ri p t
fo r a n y f u r t h e r c o p y ri g h t r e s t r i c ti o n s .
Observation of Liquid
−
Liquid Phase Transitions in Ethane at 300 K
John E. Proctor,
*
,†,‡Matthew Bailey,
†Ian Morrison,
†Malik A. Hakeem,
†and Iain F. Crowe
‡†Materials and Physics Research Group, School of Computing, Science and Engineering, University of Salford, Manchester M5
4WT, U.K.
‡Photon Science Institute and School of Electrical and Electronic Engineering, University of Manchester, Manchester M13 9PL,
U.K.
*
S Supporting InformationABSTRACT: We have conducted Raman spectroscopy
experiments on liquid ethane (C2H6) at 300 K, obtaining a
large amount of data at very high resolution. This has enabled the observation of Raman peaks expected but not previously observed in liquid ethane and a detailed experimental study of the liquid that was not previously possible. We have observed a transition between rigid and nonrigid liquid states in liquid ethane at ca. 250 MPa corresponding to the recently proposed Frenkel line, a dynamic transition between rigid liquid (liquidlike) and nonrigid liquid (gaslike) states beginning in the subcritical region and extending to arbitrarily high pressure and temperature. The observation of this transition in liquid (subcritical) ethane allows a clear differentiation to be made between the Frenkel line (beginning in the subcritical region at
higher density than the boiling line) and the Widom lines (emanating from the critical point and not existing in the subcritical region). Furthermore, we observe a narrow transition at ca. 1000 MPa to a second rigid liquid state. We propose that this corresponds to a state in which orientational order must exist to achieve the expected density and can view the transition in analogy to the transition in the solid state away from the orientationally disordered phase I to the orientationally ordered phases II and III.
■
INTRODUCTIONThe supercriticalfluid state beyond the critical pressure (Pc)
and critical temperature (Tc) is frequently viewed as a region in the pressure−temperature (P,T) space where material proper-ties change in a gradual and monotonic manner. In fact, this simplistic viewpoint belies the enormous complexity of the supercritical fluid and liquid states. Although it is correct to state that there are nofirst-order phase transitions, there are a number of other transitions present (Widom lines,1,2inversion lines,3,4 and the Frenkel line5) dividing the P−T space into regions where the sample has qualitatively different properties. We will begin our discussion with the Widom lines.6,7When the boiling line is crossed below the critical point, there are discontinuities in some parameters. For instance, there are abrupt maxima in the isochoric and isobaric heat capacities, an abrupt minimum in the speed of sound, and a discontinuous jump in the density. If a transition is made just beyond the critical pointfor instance, an isothermal pressure increase
through Pc just beyond Tcthen less abrupt maxima and
minima are observed in the heat capacities and speed of sound and a point of inflexion is observed in the density. The plot of
the line through the P−T space linking these points for a
specific parameter is a Widom line. The Widom lines for a
given sample all emanateby definitionfrom the exact
critical point and extend afinite distance from it.6The further
beyond the critical point, the more smeared out the maxima and so forth become until eventually they disappear completely.
In the vicinity of the critical point, thefluid density is such that there is on average just enough space to squeeze in an additional particle in between each particle in the fluid. The Widom lines emanate from the critical point and extend from it roughly along isochores. In theP,Tregion belowTcbut close
to the boiling line region, the liquid is gaslike.
On the other hand, as pressure is increased (for instance, in an isothermal path commencing at or just below the critical point), the density increases until the theoretical description of the liquid as a gaslike sample is no longer appropriate. It is now
proposed5,8 that this change manifests itself in qualitative
changes to the dynamic properties of the liquid. In the liquid state close to the melting curve, the motion of particles is principally oscillatory motion about certain equilibrium positions and the Debye model can be applied in a similar manner to solids, giving a dispersion relation of vibrational
modes up to a certain maximum frequency ωD and
corresponding minimum period τD. The occasional diffusive
Received: August 16, 2018
Revised: October 10, 2018
Published: October 16, 2018
Article
pubs.acs.org/JPCB Cite This:J. Phys. Chem. B2018, 122, 10172−10178
copying and redistribution of the article or any adaptations for non-commercial purposes.
Downloaded via UNIV OF SALFORD on February 22, 2019 at 14:55:39 (UTC).
motion of particles is characterized using the parameter of the
liquid relaxation time τR;9 this is the average time that a
particle spends in a certain equilibrium position before executing a jump to a new equilibrium position. This is a contrast to the dynamics in the liquid state close to the critical point, where particle motion is entirely diffusive.
Upon pressure decrease or temperature increase away from the region close to the melting curve,τRdecreases drastically to the point where τR < τD. At this point, the particles do not remain in an equilibrium position for long enough to support even the highest frequency shear waves, the ability to support the lower frequency shear waves having already been lost. The
narrow P−T region where this change occurs has been
christened the “Frenkel line”.5 The most fundamental
quantitative definition of the Frenkel line is the conditions at which the minimum in the velocity autocorrelation function disappears, leaving particle motion which is purely diffusive instead of a combination of diffusive and oscillatory motion.8 The shear wave criterion follows from this, as do predicted effects on solubility/miscibility offluids10 and (related to the shear wave propagation) explanation of the experimentally observed trends in heat capacities of liquids.11
We will refer to the region in which the liquid can support shear waves as the “rigid liquid” state and that in which it
cannot support shear waves as the “nonrigid liquid” state,
though we note that the terms“liquidlike” and“gaslike” have also been used. The Frenkel line is expected to begin in the subcritical region and, unlike the boiling line and Widom lines, continue to arbitrarily highP,Tin the supercritical region. This is because, whatever the temperature, it is possible to compress the supercritical fluid into a close-packed rigid structure if enough pressure is applied. Indeed, the Frenkel line has been observed by Prescher et al. in supercritical neon,12by Pipich
and Schwahm in supercritical CO213 and by ourselves in
supercritical methane.14
In our spectroscopy study on supercritical methane, we observed a narrow crossover in dynamic properties up to the highest temperature reached in the study, 397 K (2.1Tc),14
which we associated with the Frenkel line. In this contribution, we complement the methane study with a study of ethane
(C2H6) at ambient temperature (300 K). The critical
temperature of ethane is 305 K, so these experiments allow us to study the proposed continuation of the Frenkel line into the subcritical region, one of the most controversial aspects of the proposal.15
From the experimental point of view, ethane has a variety of
Raman-active excitations observed with significant intensity
allowing more detailed information to be obtained about the transition between the rigid and nonrigid liquid states. Existing studies of solid ethane indicate that it remains chemically stable at 300 K well above the solidification pressure of 2500
MPa. Podsiadło et al.16 performed single-crystal X-ray
diffraction at 295 K at 2700 and 5900 MPa. Their diffraction pattern was indexed to a structure in which the ethane
molecule remains intact. Zerr et al.17 studied the
decom-position of ethane under extreme conditions. In their work, compression at 300 K to over 20 GPa produced no evidence of irreversible chemical changes. Laser heating to above 3000 K was necessary to induce decomposition of the ethane molecule.
■
EXPERIMENT AND ANALYSIS METHODSA diamond anvil cell (DAC) was equipped with diamonds
having 1000 μm diameter culets and stainless steel gaskets.
Ethane was liquefied inside a cryogenic loading apparatus by
cooling the apparatus with liquid nitrogen. The DAC was then closed whilst completely immersed in liquid ethane. The liquid nitrogen does not enter the cryogenic loading apparatus during this procedure, and the strong Raman-active nitrogen vibration was not observed during our experiments.
Pressure was measured using the ruby photoluminescence method, resulting in a typical error of±0.002 GPa. Because of the need to collect several Raman spectra of ethane at each pressure, pressure was measured both before and after the collection of the ethane data at each pressure to evaluate the total error in the pressure measurement. In all cases, error bars are too small to display. Data were collected on pressure decrease at constant temperature. To calibrate the pressure measurement, a spectrum was collected of the same chip of ruby as used for the pressure measurement at ambient conditions.
Two separate Raman spectroscopy experiments were
performed. The first experiment was performed using 532
nm laser excitation and a conventional single grating (1200 lines per mm) 0.32 m Raman spectrometer. The spectra were collected using a 100μm diameter entrance slit, resulting in a
spectral resolution of 4.1 cm−1 half width half-maximum
(hwhm). A second set of spectra in thefirst experiment were
collected at each pressure data point with a 50 μm diameter
entrance slit (spectral resolution of 2.1 cm−1 hwhm) to
evaluate the degree to which the linewidth of the spectral peaks was limited by spectral resolution. The spectra collected at 100
μm slit width were used in the analysis except where otherwise
stated (see Supporting Information) because of the better
signal-to-noise ratio obtained with the 100μm slit width. Data were collected up the freezing pressure of 2500 MPa.
The second experiment was on a 0.8 m Raman spectrometer
with 100 μm slit width and 1800 lines per mm grating,
resulting in a spectral resolution of 1.3 cm−1hwhm. Data were collected up to 1000 MPa.
All data from both experiments were collected upon pressure decrease. At the lowest pressures studied, our spectra agree with those of ethane at ambient conditions in the gas state (see for instance ref18).
Both spectrometers were calibrated using the Raman peaks from silicon and diamond collected at ambient conditions. All
Raman spectra were collected using 180° backscattering
geometry through the cylinder diamond. To ensure the greatest accuracy possible in our measurements of peak intensity, we focused on the same point on the diamond culet before collecting the spectra at each pressure studied.
To correct for the difference in the observed peak intensity
resulting from the use of the different spectrometers, the
intensity data from experiment 1 were all multiplied by a constant factor of 0.736 (obtained from comparing the mean
intensity of theν3peak below 1000 MPa in both experiments).
As a result, within experimental error, there is no difference in the observed intensities between experiments 1 and 2 following this normalization procedure (seeSupporting Information). All Raman intensities given in the manuscript are integrated intensities, obtained following normalization in this manner and normalization to account for the variation in density of ethane due to the change in pressure.
All Raman peaks observed werefitted with Lorentzian peaks
following background subtraction. We observed all peaks expected except for the pure rotational peaks, which exist at
extremely low wavenumber19 so are obscured by the notch
The Journal of Physical Chemistry B Article
DOI:10.1021/acs.jpcb.8b07982 J. Phys. Chem. B2018, 122, 10172−10178
filters employed in our experiments, and theν2peak, which is obscured by the intense Raman peak from the diamond in the
high-pressure cell. Each Raman peak was fitted with a single
Lorentzian. The widths given refer in all cases to the hwhm. Out of the peaks we have observed and used in our analysis, thefit to 2ν6has the largest errors: up to±0.3 cm−1for the
peak position and up to ±0.5 cm−1 for the peak width. The
errors in the curvefits are therefore too small to justify plotting on our graphs.
The isothermal path through the liquid region of the ethane phase diagram followed in our experiments at 300 K from
condensation at 4.4 MPa20 to solidification at 2500 MPa21
involves a large change in density. This causes a significant increase in the intensity of the Raman peaks for purely experimental reasons because as pressure is increased, more molecules are in the volume illuminated by the laser spot at the focal point.
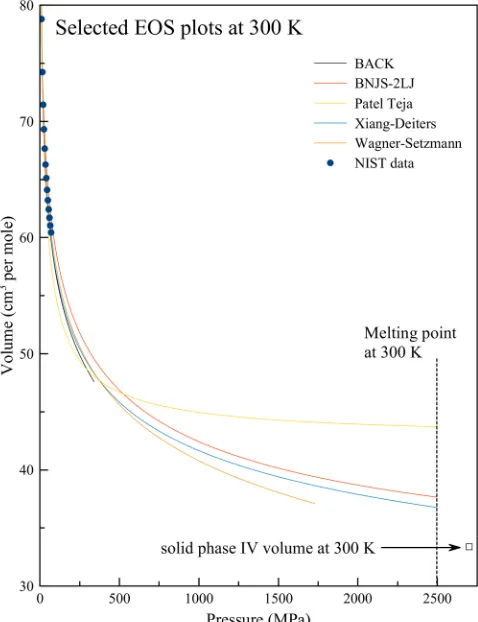
We have therefore normalized our observed Raman
intensities using the Xiang−Deiters equation of state (EOS)
for ethane, calculated using the ThermoC code.22However, it
must be noted that the accuracy of this EOS cannot be guaranteed in the pressure range of our study because of the lack of experimental EOS data in this region of the phase diagram. Accurate experimental EOS data are available from NIST only up to 70 MPa.20We examined a variety of different
equations of state using the ThermoC software. The Wagner−
Setzmann, Patel−Teja, Boubliḱ −Alder−Chen−
Kreglew-ski (BACK), Xiang−Deiters, and Boubliḱ −Nezbeda +
Jacobsen−Stewart (BNJS-2LJ) all lie close to the NIST data
in the region in which data are available but then diverge from
each other at higher pressure by up to 15% (Figure 1).
However, the volume of solid ethane at 2700 MPa and 300 K in phase IV, very soon after crystallization, has been measured accurately using X-ray diffraction (33.38 cm3 mol−1).16 The volume decrease upon crystallization is, as a general rule, small23(we would expect about 10%). Only the Xiang−Deiters and BNJS-2LJ equations of state are consistent with this
constraint. We have selected the Xiang−Deiters EOS for this
reason and because it was specifically developed for application to small alkane molecules.24
■
RESULTSWe will describe in turn the behavior of the different Raman
modes observed. The lowest frequency mode is the ν3C−C
stretching mode at ca. 1000 cm−1. This mode exhibited, within error, a linear increase in frequency upon pressure increase throughout. The width and intensity, however, exhibit a discontinuity at ca. 1000 MPa (Figure 2a). This is also visually evident in the observed spectra (Figure 2b).
Next, we observe theν11mode at ca. 1470 cm−1(Figure 3),
corresponding to deformation of the CH3groups. It is barely
detectable at the lowest pressures studied because of its weakness combined with high width, but upon pressure increase, it becomes more intense and narrow. We observe changes in the characteristics of this mode at extremely low pressure, ca. 250 MPa. The Raman frequency stops decreasing upon pressure increase and starts to increase upon pressure increase.
We then observe two groups of Raman modes at much
higher frequency. At 2735 cm−1, there is the 2ν6 CH
3
deformation (Fermi resonance with ν1 C−H stretching).
Because of its low intensity, this and 2ν2, which we will discuss next, were not observed in the only previous Raman studies of
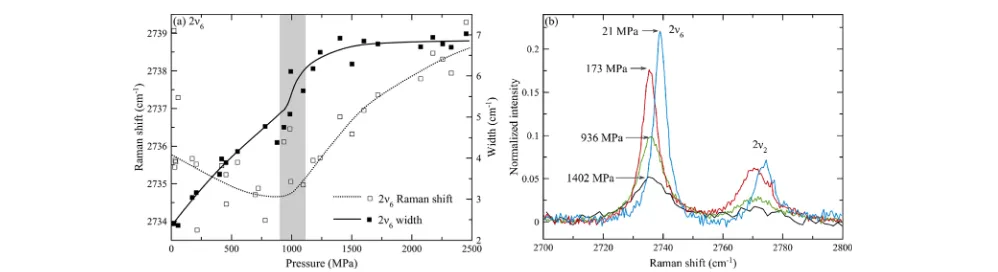
liquid ethane published to our knowledge.21,25−27They were, however, observed in previous studies of gaseous ethane.18,28 The 2ν6peak position decreases upon pressure increase at the very lowest pressures studied, then plateaus out, and begins to increase upon pressure increase above ca. 1000 MPa. The peak width increases linearly until ca. 1000 MPa and then remains
constant upon further pressure increase. Figure 4a shows the
variation in the 2ν6peak position and width as a function of pressure, andFigure 4b shows the selected spectra of this peak and the neighboring 2ν2. Although the parameters of the 2ν2
peak have been examined and are shown in the Supporting
Information, we will not discuss them further here because the weakness of the peak leads the spread of data to be too large to draw reliable conclusions.
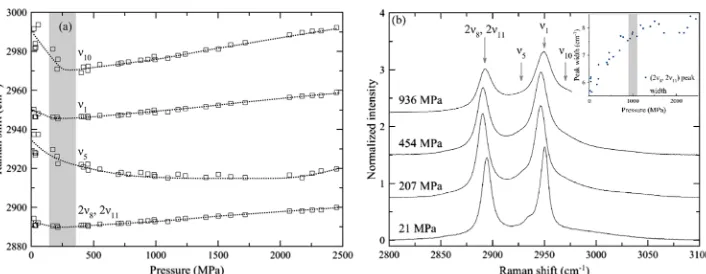
Last, we studied the group of overlapping peaks in the vicinity of 3000 cm−1(Figure 5). We observe the following two intense peaks: CH3deformation (2ν8, 2ν11) at ca. 2890 cm−1
(Fermi degeneracy, as outlined in ref 19) and the ν1 C−H
stretching at ca. 2980 cm−1 (also ref 19). To obtain an
acceptable fit to the data it is, however, necessary to include
two more peaks: One between (2ν8, 2ν11) and ν1and one at
higher frequency thanν1. The previous study by Shimizu et
al.21collected four data points in the liquid state andfitted only three peaks. Visual inspection indicates that their spectra are similar to ours and their decision tofit only three peaks is due to the poorer signal-to-noise ratio.
In this case, the weaker peak at higher frequency than ν1
would most logically be assigned toν10C−H stretching and
[image:4.625.325.564.69.380.2]there are various possible assignments for the weak peak in between (2ν8, 2ν11) andν1. The most plausible option isν5, an
Figure 1.Experimental EOS data for ethane from NIST20(circles),
EOS calculated using ThermoC software22 (lines), and volume of
ethane in the solid phase IV following crystallization.16
IR-active C−H stretching mode in the gas state19which may become weakly Raman-active in the liquid state. We do not consider that the numerical values of thefitting parameters for theν5andν10peaks can be treated as reliable because of the complete overlap between these and neighboring peaks, but substantial qualitative changes to the characteristics of these peaks upon pressure increase are evident from inspection of the raw data.
All four of the peaks fitted exhibit a decrease in frequency upon pressure increase at the lowest pressures studied, up to ca. 250 MPa (Figure 5a). The width of the (2ν8, 2ν11) peak undergoes a sharp change at ca. 1000 MPa from a regime in which it steadily increases upon pressure increase to one in which it remains constant (Figure 5b inset). The total intensity of this group of peaks remains constant within error throughout the entirety of both experiments, but there are
clear changes in intensity of some peaks (disappearance of the
shoulder due toν5and appearance of the shoulder due toν10
upon pressure increaseseeFigure 5b).
■
DISCUSSIONWe observe, at 300 K, two clear, narrow, transitions in liquid ethane at ca. 250 and ca. 1000 MPa. The condensation transition in ethane at 300 K is at 4.4 MPa, a lower pressure than any of our data points. We therefore propose that thefirst transition observed is the Frenkel line. On the low-pressure side of this transition, all Raman peaks exceptν3behave as we would expect in a nonrigid liquid (i.e., gaslike liquid); the frequency stays constant or decreases upon pressure increase
because of the increased effect of attractive van der Waals
[image:5.625.140.492.64.199.2]forces between molecules loosening the intramolecular bonds.
Figure 2.(a) Variation of theν3peak width and normalized intensity as a function of pressure, showing transition at ca. 1000 MPa (shaded). The
[image:5.625.79.564.232.369.2]lines are guides to the eye only and have no physical significance. (b) Example spectra ofν3, all collected during experiment 1.
Figure 3.(a) Variation of theν11peak position and width as a function of pressure. The peak shifts to lower frequency upon pressure increase at
extremely low pressures below ca. 250 MPa (shaded region). The lines are guides to the eye only and have no physical significance. (b) Example spectra ofν11demonstrating also the decrease in intensity at the lowest pressures studied.
Figure 4.(a) Plot of the 2ν6peak position and width as a function of pressure, demonstrating transition at ca. 1000 MPa (shaded). The lines are
guides to the eye only and have no physical significance. (b) Example spectra of 2ν6and 2ν2peaks.
The Journal of Physical Chemistry B Article
DOI:10.1021/acs.jpcb.8b07982 J. Phys. Chem. B2018, 122, 10172−10178
[image:5.625.66.565.413.549.2]Theν3does also exhibit this behavior, just at lower pressures than are achievable in our study. Lee and Ben-Amotz studied theν3mode using a large volume cell.25This mode exhibited a crossover between (what we now recognize as) nonrigid and rigid liquidlike behavior at a density of ca. 10 molecules nm−3. This corresponds to a pressure of about 70 MPa according to NIST. We note that the transition in different Raman peaks is observed at different pressure [ranging from ca. 70 MPa forν3 to ca. 200 MPa for (2ν8, 2ν11)]. This is consistent with the definition of the Frenkel line; it is a transition that takes place over a certainP,Trange rather than a discontinuous transition at a singleP,Tpoint.5,12It has also been pointed out that the different criteria to define the Frenkel line lead to transitions under differentP,Tconditions.15,29
All changes that we observe upon the transition at ca. 250 MPa are to properties which are more reminiscent of a dense, rigid, closely packed liquid. Following the transition, all modes which involve bond stretching (as opposed to rotation), theν3, 2ν6, andν1, exhibit upward shift in frequency upon pressure increase. This is what is predicted by the simple Grüneisen model for vibrational frequency that was developed for use with solids and which we applied to the rigid liquid state.14 Out of the remaining modes studied,ν11and (2ν8, 2ν11), (2ν8, 2ν11) does shift upward in frequency following the transition at
ca. 250 MPa, whereas ν11 does not. The Grüneisen model
cannot make any prediction of how the frequency of these modes will vary as a function of pressure because it works by relating the shift to the change in bond length, whereas the bond length stays constant when a rotational mode is excited.
Between thefirst transition at ca. 250 MPa and the second
transition at ca. 1000 MPa, we observe (except for theν11) an increasing peak width as pressure is increased. This is expected; the presence of nonhydrostatic stress always causes an increase in the width of Raman spectral peaks. The rigid liquid state cannot support static nonhydrostatic stress like a solid but it can support nonhydrostatic stress for a limited time period because of the propagation of shear waves (this is what differentiates it from the nonrigid liquid state5). The further pressure is increased, the lower the liquid relaxation time becomes and the larger the spectrum of shear waves that can be supported. Therefore, spectral peaks can broaden.
The ν3, ν11, 2ν6, and (2ν8, 2ν11) peaks all exhibit narrow changes in the dependence of peak width on pressure at ca. 1000 MPa. Following this, the behavior of all spectral peaks is solidlikethe peaks shift to higher wavenumber upon pressure
increase and the width increases upon pressure increase or stays constant. We observe no further changes until the onset of precrystallization phenomena9 close to the crystallization point at 2500 MPa.
Although the finding that high pressure induces solidlike
properties is not in itself a surprise, the nature of the transitions we observe is remarkable and important in two ways.
Regarding the first transition, the Frenkel line has been
controversial since its proposal in 2012.5The controversy has centered around two issues;first, the fact that it is proposed as a transition between liquidlike and gaslike states despite the fact that it does not begin at the critical point and instead is proposed to extend into the subcritical region. Thus far, existing experimental observations of the Frenkel line have observed it only in the supercritical region, failing to address this point. In our study, we directly observe the Frenkel line in the subcritical region for thefirst time, according to the same criteria as our previous observation of the Frenkel line in the supercritical region.14Second, the fact that our observation of the Frenkel line is not dependent on any data analysis procedure with the potential for systematic errors. The change from a decrease in Raman frequency upon pressure increase to an increase upon pressure increase is evident in the raw data. In contrast, the observation of the Frenkel line on the basis of diffraction experiments12has been disputed.15
One of the qualitative differences between the rigid liquid state and nonrigid liquid state is that the rigid liquid state can exhibit short-range order. As a result, the rigid liquid state can exhibit phase transitions as the nature of this short-range order
changes upon variation in pressure and/or temperature.8 We
propose that such a phase transition is what we observe at ca. 1000 MPa and can understand this by analogy to the
transitions between different solid phases of ethane at low
temperature. Pressure increase causes a transition away from the orientationally disordered phase (phase I) to orientation-ally ordered phases II and III.
Considering the ethane molecule as a rigid rod with
dimensions 4.755 Å × 3.988 Å,30 the absolute maximum
density that can be achieved by close packing of these rods is
66 Å3 per molecule or 39.7 cm3 per mole. According to the
[image:6.625.137.490.65.202.2]EOS we have utilized this density should be reached at ca. 1400 MPa. To achieve higher density than this, it is necessary for orientational order to exist and for direct compression of the intramolecular bonds to take place.
Figure 5.(a) Variation of the peak position as a function of pressure for all four peaks at ca. 3000 cm−1, where changes in theν10peak in particular
indicate transition at ca. 250 MPa. The lines are guides to the eye only and have no physical significance. (b) Example spectra of these peaks, illustrating also significant changes in intensity upon pressure increase, particularly of theν5peak. The inset to (b) shows variation in (2ν8, 2ν11) width upon pressure increase, showing transition at ca. 1000 MPa.
We are conducting a detailed study of solid ethane which will be published separately. However, we would like to make one proposal at this stage regarding solid ethane. The structure of solid ethane following crystallization at 2500 MPa 300 K has
been assigned to phase IV using X-ray diffraction16 and to
phase II, followed by a phase transition at 3300 MPa to phase
III using Raman spectroscopy.21Our Raman spectra collected
from solid ethane at 300 K (seeSupporting Information) are in
agreement with those shown in ref21, but we assign them to
phase IV rather than phase II. This is because the Raman spectra of phase II collected at low temperature26exhibit two intense peaks at ca. 1200 cm−1, which are absent from both our spectra of solid ethane and those in ref21.
■
CONCLUSIONSWe have observed experimentally the Frenkel line transition between the nonrigid liquid state and the recently hypothe-sized rigid liquid state in ethane. Our observation validates the hitherto controversial prediction that the Frenkel line extends into the subcritical region and is thus distinguished from the Widom lines. In addition, we observe a transition at ca. 1000 MPa that can only be understood by reference to the rigid
liquid state; the nonrigid liquid state is, by definition,
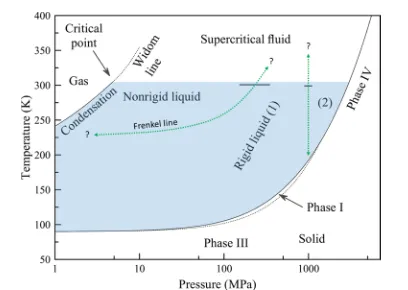
completely disordered (gaslike) and thus cannot contain any phase transitions. The phase diagram of ethane, covering gas, liquid, supercriticalfluid, and solid states is shown inFigure 6.
Here, we plot the known boundary lines between solid, liquid, and gas states. We also plot a representative Widom line (that for the heat capacity at constant pressure) and the phase transition line between the orientationally disordered solid phase I and the orientationally ordered solid phases. The metastable phase II is omitted from the diagram for clarity; the
stable phases III and IV are included. The phase transition line between phases III and IV has yet to be measured.
A number of other systems exhibit liquid−liquid phase
transitions.8,33−35 However, most of these (e.g., sulfur and phosphorus) involve actual changes in the covalent interatomic bonding so may be understood as reactions rather than purely as phase transitions. Such a transition/reaction could occur in the rigid or nonrigid liquid states. The intramolecular bonds can be broken under the right conditions whether the sample is a solid, liquid, or even a gas. What we observe in ethane, on the other hand, is a transition in the degree of structural order which should be understood by reference to the rigid liquid state, analogous to phase transitions in crystalline solids. There are few other instances of this kind of transition in liquids, water being the main example.36
Further computational, as well as experimental, work is required to characterize in detail and understand liquid−liquid phase transitions in molecular materials and relate the changes in the Raman spectra to the nature of the phase transitions. With the obvious exception of water, molecular materials have
been neglected in computational research onfluids because of
their complexity, despite their scientific importance. The major
and outer planets are composed mainly of molecularfluids.
The similarity between the solid and liquid states in ethane is reflected on both sides of the melting transition. Although we clearly see signs of solidlike order in the liquid state, there exists on the other hand a certain level of disorder in the solid phase (IV) obtained upon crystallization at 300 K. The orientation of the hydrogen atoms around the axis of the C−C bond is notfixed,16and it is likely that they are free to rotate. As was originally stated by Frenkel,9the difference between the solid and dense liquid states is quantitative rather than qualitative.
■
ASSOCIATED CONTENT*
S Supporting InformationThe Supporting Information is available free of charge on the
ACS Publications websiteat DOI:10.1021/acs.jpcb.8b07982. Graphs of Raman peak positions, widths, and intensities versus pressure; comparison of results from experiments 1 and 2; Raman spectrum of solid ethane at 2.9 GPa; and tabulated data (PDF)
■
AUTHOR INFORMATIONCorresponding Author
*E-mail:j.e.proctor@salford.ac.uk. ORCID
John E. Proctor:0000-0003-3639-8295
Notes
The authors declare no competingfinancial interest.
■
ACKNOWLEDGMENTS [image:7.625.80.284.362.507.2]We would like to acknowledge use of Raman spectroscopy facilities at the Royce Institute at the University of Manchester. We would like to thank Prof. Vadim Brazhkin (Institute for High Pressure Physics, RAS), Dr. Kostya Trachenko (Queen Mary University of London), Dr. Helen Maynard-Casely (ANSTO), Prof. Dragoslav Stoiljkovic (University of Novi Sad), and Dr. Marcin Podsiadlo (Adam Mickiewicz Univer-sity) for useful discussions. M.A.H. would like to thank the University of Salford for a Ph.D. scholarship.
Figure 6.Phase diagram of ethane. The liquid −gas20and solid−
liquid31transitions are shown, alongside a representative Widom line (that for heat capacity at constant pressure20). The region where phase I exists is shown,31alongside the regions where phase III and phase IV are believed to be stable. The metastable phase II is omitted for clarity. The approximate pressure of the Frenkel line transition (horizontal black line at ca. 250 MPa) and the second liquid−liquid transition (horizontal black line at ca. 1000 MPa) observed in our work are shown. This second transition is the boundary between rigid liquid states 1 and 2. These transitions occur at pressure 2 orders of
magnitude higher than the critical point20 and Widom line (note
logarithmic scale on the pressure axis). The Frenkel line is expected to begin at ca. 0.75Tc32and continue into the supercritical region. The dotted green lines are possibleP,T paths for the phase transitions observed at 300 K.
The Journal of Physical Chemistry B Article
DOI:10.1021/acs.jpcb.8b07982 J. Phys. Chem. B2018, 122, 10172−10178
■
REFERENCES(1) Simeoni, G. G.; Bryk, T.; Gorelli, F. A.; Krisch, M.; Ruocco, G.; Santoro, M.; Scopigno, T. The Widom line as the crossover between liquid-like and gas-like behaviour in Supercritical Fluids. Nat. Phys.
2010,6, 503−507.
(2) Xu, L.; Kumar, P.; Buldyrev, S. V.; Chen, S.-H.; Poole, P. H.; Sciortino, F.; Stanley, H. E. Relation between the Widom line and the dynamic crossover in systems with a liquid-liquid phase transition.
Proc. Natl. Acad. Sci. U.S.A.2005,102, 16558−16562.
(3) Brown, E. H.On the Thermodynamic Properties of Fluids; Bull.
Intnl. Inst. Refrig.: Paris, Annexe 1960−1961, 1960; pp 169−178. (4) Reif, F.Fundamentals of Statistical and Thermal Physics; McGraw-Hill: New York, 1965.
(5) Brazhkin, V. V.; Fomin, Y. D.; Lyapin, A. G.; Ryzhov, V. N.; Trachenko, K. Two liquid states of matter: A dynamic line on a phase diagram. Phys. Rev. E: Stat., Nonlinear, Soft Matter Phys. 2012, 85, 031203.
(6) Imre, A. R.; Deiters, U. K.; Kraska, T.; Tiselj, I. The pseudocritical regions for supercritical water. Nucl. Eng. Des. 2012,
252, 179−183.
(7) Gallo, P.; Corradini, D.; Rovere, M. Widom line and dynamical crossovers as routes to understand supercritical water.Nat. Commun.
2014,5, 5806.
(8) Trachenko, K.; Brazhkin, V. V. Collective modes and thermodynamics of the liquid state.Rep. Prog. Phys.2016,79, 016502. (9) Frenkel, Y. I.Kinetic Theory of Liquids; Dover Publications: New York, 1955.
(10) Yang, C.; Brazhkin, V. V.; Dove, M. T.; Trachenko, K. Frenkel line and solubility maximum in supercritical fluids.Phys. Rev. E: Stat., Nonlinear, Soft Matter Phys.2015,91, 012112.
(11) Bolmatov, D.; Brazhkin, V. V.; Trachenko, K. The phonon theory of liquid thermodynamics.Sci. Rep.2012,2, 421.
(12) Prescher, C.; Fomin, Y. D.; Prakapenka, V. B.; Stefanski, J.; Trachenko, K.; Brazhkin, V. V. Experimental evidence of the Frenkel line in supercritical neon.Phys. Rev. B2017,95, 134114.
(13) Pipich, V.; Schwahm, D. Densification of supercritical carbon dioxide accompanied by droplet formation when passing the Widom line.Phys. Rev. Lett.2018,120, 145701.
(14) Smith, D.; et al. Crossover between liquidlike and gaslike behavior in CH4 at 400 K.Phys. Rev. E2017,96, 052113.
(15) Bryk, T.; Gorelli, F. A.; Mryglod, I.; Ruocco, G.; Santoro, M.;
Scopigno, T. Behavior of Supercritical Fluids across the “Frenkel
Line”.J. Phys. Chem. Lett.2017,8, 4995−5001.
(16) Podsiadło, M.; Olejniczak, A.; Katrusiak, A. A new ethane
polymorph.Cryst. Growth Des.2016,17, 228−232.
(17) Zerr, A.; Serghiou, G.; Boehler, R.; Ross, M. Decomposition of alkanes at high pressures and temperatures.High Pressure Res.2006,
26, 23−32.
(18) Atamas, N. A.; Yaremko, A. M.; Seeger, T.; Leipertz, A.; Bienko, A.; Latajka, Z.; Ratajczak, H.; Barnes, A. J. A study of the Raman spectra of alkanes in the Fermi-resonance region.J. Mol. Struct.
2004,708, 189−195.
(19) Romanko, J.; Feldman, T.; Welsh, H. L. The Raman spectrum of ethane.Can. J. Phys.1955,33, 588−599.
(20)https://webbook.nist.gov/cgi/cbook.cgi?ID=C74840, accessed on 1/5/2018.
(21) Shimizu, H.; Shimazaki, I.; Sasaki, S. High-pressure Raman study of liquid and molecular crystal ethane Up to 8 GPa.Jpn. J. Appl. Phys.1989,28, 1632−1635.
(22)http://thermoc.uni-koeln.de/, accessed on 3/5/2018. (23) Pedersen, U. R.; Costigliola, L.; Bailey, N. P.; Schrøder, T. B.;
Dyre, J. C. Thermodynamics of freezing and melting.Nat. Commun.
2016,7, 12386.
(24) Xiang, H. W.; Deiters, U. K. A new generalized corresponding-states equation of state for the extension of the Lee-Kesler equation to fluids consisting of polar and larger nonpolar molecules.Chem. Eng. Sci.2008,63, 1490−1496.
(25) Lee, M.-R.; Ben-Amotz, D. Pressure induced vibrational frequency shifts of ethane and methyliodide. Evidence for the
formation of C-H hydrogen bonds in high density fluids. J. Chem.
Phys.1993,99, 10074−10077.
(26) Wisnosky, M. G.; Eggers, D. F.; Fredrickson, L. R.; Decius, J. C.
The vibrational spectra of solid II ethane and ethane-d6. J. Chem.
Phys.1983,79, 3505−3512.
(27) Wisnosky, M. G.; Eggers, D. F.; Fredrickson, L. R.; Decius, J. C. A metastable solid phase of ethane.J. Chem. Phys.1983,79, 3513− 3516.
(28) Van Helvoort, K.; Knippers, W.; Fantoni, R.; Stolte, S. The
Raman spectrum of ethane from 600 to 6500 cm−1 stokes shifts.
Chem. Phys.1987,111, 445−465.
(29) Yoon, T. J.; Ha, M. Y.; Lee, W. B.; Lee, Y.-W.″Two-Phase″
Thermodynamics of the Frenkel Line.J. Phys. Chem. Lett. 2018, 9,
4550−4554.
(30) Mao, Z.; Sinnott, S. B. Separation of organic molecular mixtures
in carbon nanotubes and bundles: Molecular dynamics simulations.J.
Phys. Chem. B2001,105, 6916−6924.
(31) Schutte, M. H. M.; Prins, K. O.; Trappeniers, N. J. Nuclear
magnetic resonance in solid ethane at high pressure.Physica B+C
1987,144, 357−367.
(32) Brazhkin, V. V.; Fomin, Y. D.; Lyapin, A. G.; Ryzhov, V. N.; Tsiok, E. N.; Trachenko, K.“Liquid-gas”transition in the supercritical Region: Fundamental changes in the particle dynamics.Phys. Rev. Lett.
2013,111, 145901.
(33) Brazhkin, V. V.; Lyapin, A. G. High-pressure phase trans-formations in liquids and amorphous solids.J. Phys.: Condens. Matter
2003,15, 6059−6084.
(34) Franzese, G.; Malescio, G.; Buldyrev, S. V.; Stanley, H. E.; Skibinsky, A. Generic mechanism for generating a liquid-liquid phase transition.Nature2001,409, 692−695.
(35) Stanley, H. E.; Mallamace, F. Experimental tests of the liquid-liquid phase transition hypothesis. InWater: Fundamentals as the Basis for Understanding the Environment and Promoting Technology; Debenetti, P. G., Ricci, M. A., Bruni, F., Eds.; IOS Press: Amsterdam, 2105.
(36) Mishima, O.; Calvert, L. D.; Whalley, E. An apparently first-order transition between two amorphous phases of ice induced by pressure.Nature1985,314, 76−78.