New molecular and cellular
aspects of mutant calreticulin
in Myeloproliferative
Neoplasms
MARIA MORLAN-MAIRAL
School of Environment and Life Sciences
University of Salford, UK
1
2
Contents
List of Figures ... 6
List of Tables ... 9
Acknowledgments ... 10
Declaration ... 12
Abbreviations ... 13
Abstract ... 16
CHAPTER 1: General background ... 18
1.1. Overview of normal and malignant megakaryopoiesis ... 18
1.2. Myeloproliferative Neoplasms ... 20
1.2.1. Myeloproliferative neoplasms, the emergence of key clonal markers... 21
1.3. Classic Ph-negative MPNs ... 22
1.3.1. Essential thrombocythemia ... 23
1.3.2. Primary myelofibrosis ... 26
1.4. JAK-STAT signalling, a key cellular pathway in megakaryopoiesis and MPNs pathogenesis .... 26
1.5. Classic mutations in Ph-negative MPNs ... 30
1.5.1. JAK2 mutations ... 30
1.5.2. c-MPL mutations ... 30
1.6. Calreticulin, a novel driver mutation in MPNs ... 31
1.6. Calreticulin: a multifunctional cellular protein ... 33
1.6.1. CALR chaperone activity ... 34
1.6.2. CALR calciumbuffering activity ... 35
1.6.3. CALR functions out of the ER... 37
1.7. Oncogenicity of CALR mutations in MPNs ... 38
1.8. General hypothesis and aims of this study ... 43
CHAPTER 2: Material and Methods ... 45
2.1. Computational methods ... 45
2.1.1. Input sequences ... 45
2.1.2. Computational analysis of the intrinsic disorder predisposition of the C-terminal domain of CALR wt and type1/2 mutants ... 46
2.1.3. Computational analysis of the secondary structure of CALR wt and mutants C-terminal domain ... 47
3
2.1.5. Computational analysis of the presence of MORFs regions within the CALR wt and
mutants C-terminal domain ... 48
2.1.6. Analysis of amino acid charge within the CALR wt and mutants C-terminal domain ... 48
2.2. Laboratory techniques ... 49
2.2.1. Cell culture and cell lines ... 49
2.2.2. Subculture of cell lines ... 49
2.2.3. Freezing and thawing cells ... 50
2.2.4. Cell counting and trypan blue exclusion... 50
2.2.5. Extraction of DNA plasmids from Whatman paper ... 51
2.2.6. Plasmids amplification ... 51
2.2.7. PolyFect transfection ... 52
2.2.8. Immunostaining ... 53
2.2.9. High-resolution imaging ... 54
2.2.10. Lentiviral transduction of DAMI cells ... 54
2.2.11. Protein extraction ... 55
2.2.12. Bradford assay ... 55
2.2.13. Sodium Dodecyl Sulfate Polyacrylamide Gel Electrophoresis (SDS-PAGE) ... 56
2.2.14. Western blotting ... 56
2.2.15. RNA extraction and cDNA synthesis ... 58
2.2.16. Taq polymerase chain reaction ... 58
2.2.17. Quantitative real-time Polymerase Chain Reaction (qRT-PCR) ... 59
2.2.18. Comparative Ct method (2-ΔΔCT) ... 61
2.2.19. Propidium Iodide staining and cell cycle analysis ... 62
2.2.20. Protein cell surface immunostaining ... 63
2.2.21. Free intracellular calcium staining ... 63
2.2.22. Flow-cytometry analysis ... 64
2.2.23. ER calcium release assay ... 64
2.2.24. Cell drug treatment ... 65
2.2.25. Mouse bone marrow cells megakaryocyte induction ... 65
2.2.26. May-Grunwald Giemsa staining ... 66
2.2.27. Bright field microscopy ... 66
2.2.28. Cell proliferation Assay ... 67
2.2.29. Statistical analyses ... 67
4
3.1. Introduction ... 68
3.1.1. Aims and hypothesis ... 71
3.2. Results ... 72
3.2.1. Initial analysis of CALR secondary structure ... 72
3.2.2. Analysis of CALR mutations effects in the intrinsic disorder state of CALR C-terminal domain ... 74
3.2.3. Three-dimensional structural modelling of CALR WT and CALR mutants ... 76
3.2.4. Assessment of CALR WT and CALR mutants structural predicted models... 79
3.2.5. Analysis of CALR WT and mutants C-terminal domain secondary structure based on s2D method ... 79
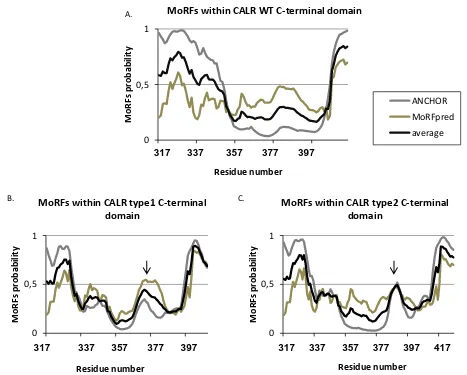
3.2.6. Localisation of disorder-based protein binding sites within the intrinsically disordered CALR WT and CALR mutants C-terminal domain ... 82
3.2.7. Effects of CALR mutations in the amino acid charge within the C-terminal domain ... 83
3.3. Discussion ... 86
3.3.2. Conclusion ... 89
3.3.4. Future work ... 90
Chapter 4: MARIMO cell line, a new model to study megakaryopoiesis with CALR mutations ... 91
4.1 Introduction ... 91
4.1.1. Aim and hypothesis ... 94
4.2. Results ... 95
4.2.1 Analysis of CD41a expression in MARIMO cells after PMA induction ... 95
4.2.2. MARIMO cell cycle analysis after PMA treatment... 99
4.2.3. Proliferation assay of MARIMO cells under PMA treatment ... 101
4.2.4. Morphological analysis of MARIMO cells under PMA treatment ... 102
4.2.5. Analysis of MPL expression in MARIMO cells after PMA treatment ... 106
4.2.6. Study of the expression of STAT5 gene signature in MARIMO cells after PMA treatment. ... 108
4.3. Discussion ... 110
4.3.1. Conclusions ... 114
4.3.2. Future directions ... 115
CHAPTER 5: Analysis of CALR mutant sub-cellular localisation ... 116
5.1. Introduction ... 116
5.1.1. Aims and hypothesis ... 118
5.2. Results ... 119
5
5.2.3. Analysis of CALR cell surface localisation in leukemic blast cells ... 123
5.2.4. Analysis of differences of CALR levels within the cell surface between blast and megakaryocyte like cells ... 125
5.3. Discussion ... 132
5.3.1. Conclusions ... 135
5.3.2. Future directions ... 136
Chapter 6: Analysing the importance of calcium during megakariopoiesis and the effects of CALR mutations in calcium homeostasis. ... 137
6.1. Introduction ... 137
6.1.2. Calcium cellular dynamics ... 137
6.1.2. Intracellular calcium oscillations ... 139
6.1.3. Calcium and its role in cellular differentiation ... 141
6.1.4. Megakaryocytes and calcium ... 142
6.1.5. Calcium and pathological megakaryocyte production ... 143
6.1.6. Methods to study intracellular calcium ... 144
6.1.7. Aims of the study ... 146
6.2. Results ... 147
6.2.1. Building a model of [Ca2+ i]oscillations during megakaryocyte differentiation. ... 147
6.2.2. Analysis of the specificity of [Ca2+ i] oscillations during cell differentiation of different blood lineages ... 153
6.2.3. Ca2+ dynamics in CALR mutant cells: an integrative analysis of different megakaryocyte differentiation stages. ... 156
6.2.4. Ca2+ channel blockers as inducers of megakaryocytic differentiation ... 168
6.3. Discussion ... 181
6.3.1. Conclusions ... 186
6.3.2. Future directions ... 187
CHAPTER 7: General Discussion ... 188
7.1. Discussion ... 188
7.2. Concluding remarks ... 193
7.3. Research limitations ... 194
References ... 195
6
List of Figures
Figure 1. Megakaryopoiesis. ... 19
Figure 2. Schematic diagram of MPNs classification. ... 23
Figure 3. JAK-STAT signalling pathway. ... 29
Figure 4. Calreticulin protein and its functional domains. ... 34
Figure 5. Schematic representation of CALR cellular functions. ... 36
Figure 6. Schematic representation of the CALR conserved sequence affected by mutations found in MPN. ... 39
Figure 7. CALR mutant oncogenic activity. ... 42
Figure 8. Typical haemocytometer chamber. ... 51
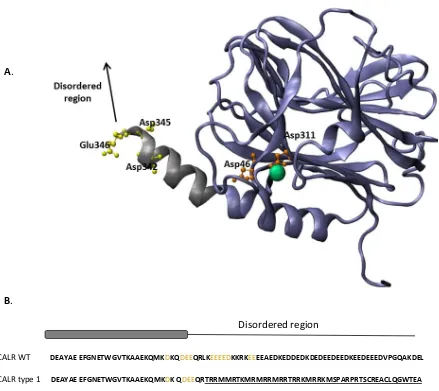
Figure 9. Structural characteristics of CALR wt ... 73
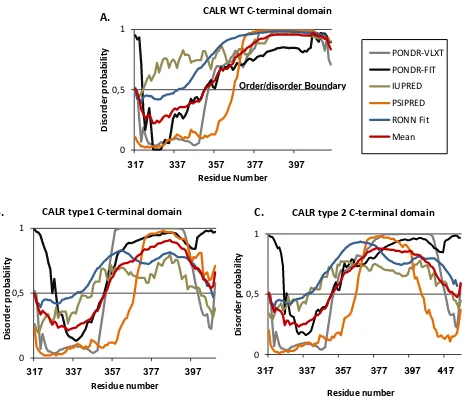
Figure 10. Protein disorder analysis of CALR wt and CALR mutants' C-terminal domain ... 75
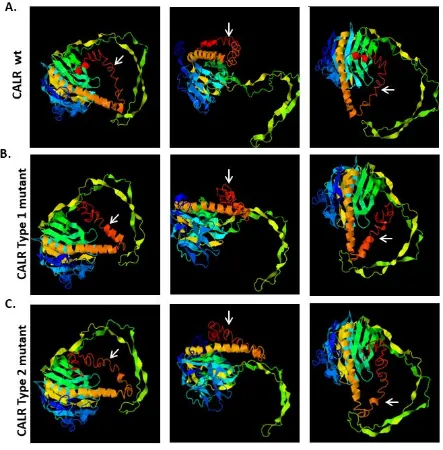
Figure 11. 3D structural modelling of CALR wt, type 1 and type 2 mutants. ... 78
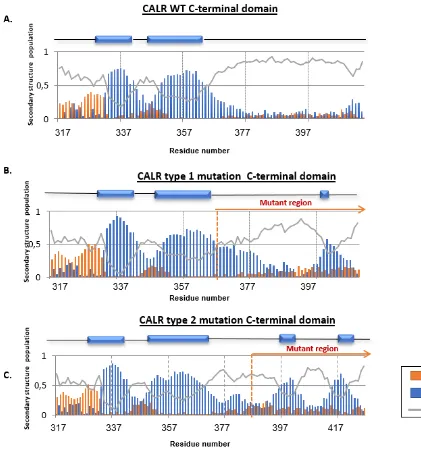
Figure 12. Analysis by S2D method of CALR wt, type 1 and type 2 C-terminal domains. ... 81
Figure 13. Computational analysis of MoRFs within the C-terminal domain of CALR wt, type 1 and type 2 mutants. ... 83
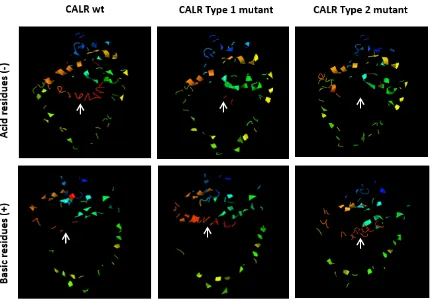
Figure 14. Analysis of acidic and basic residues location within the 3D structural models of CALR WT, type 1 and type 2 mutations. ... 84
Figure 15. Optimization of MARIMO PMA treatment. ... 96
Figure 16. CD41a quantification and cell death induction after MARIMO PMA induction. ... 98
Figure 17. Analysis of cell cycle in PMA induced MARIMO cells. ... 100
Figure 18. Proliferation analysis during PMA megakaryocytic induction of MARIMO cells. 101 Figure 19. Representative images of MARIMO live cells under PMA treatment. ... 103
Figure 20. MARIMO cytological changes under PMA treatment. ... 105
Figure 21. MPL expression in MARIMO cells after PMA megakaryocytic induction. ... 107
Figure 22. Expression of STAT5 gene signature in MARIMO cells after PMA treatment. ... 109
Figure 23. Schematic representation of MARIMO megakaryocyte like cells model based in the results obtained in this study. ... 113
Figure 24. CALR WT and CALR type 2 mutant cellular localisation. ... 120
7
Figure 26. CALR cell surface expression in K562 and MARIMO cells... 123 Figure 27. CALR cell surface levels in DAMI cells overexpressing CALR wt, type 1 and type 2 mutations. ... 124
Figure 28. K562 cells under PMA treatment display megakaryocytic characteristics. ... 126 Figure 29. DAMI cells under PMA treatment increase CD41a expression. ... 127 Figure 30. DAMI cells under PMA treatment display megakaryocytic phenotypic characteristics. ... 128
Figure 31. CALR cell surface levels in K562 and MARIMO cells after PMA induction. ... 130 Figure 32. CALR cell surface levels in DAMI cells overexpressing CALR wt, type 1 and type 2 mutations after PMA induction. ... 131
Figure 33. Cellular Ca2+ signalling dynamics. ... 140 Figure 34. Proposed model of megakaryocyte hyperplasia induced by increase [Ca2+I]. ... 144 Figure 35. [Ca2+
i] oscillations during K562 megakaryocyte formation. ... 148 Figure 36. In vitro megakaryopoiesis of mouse bone marrow cells... 150 Figure 37. [Ca2+
i] levels of HSC/Progenitors, megakaryocyte progenitors and megakaryocytes during in vitro megakaryopoiesis of mouse bone marrow cells. ... 151
Figure 38. [Ca2+
i] oscillations during DAMI megakaryocyte formation. ... 152 Figure 39. Model proposed in this study of [Ca2+i] oscillations during megakaryocyte formation in physiological conditions ... 153
Figure 40. K562 cells under Hemin treatment display erythrocyte characteristics. ... 154 Figure 41. [Ca2+
i] fluctuations during K562 erythropoiesis and megakaryopoiesis. ... 155 Figure 42. [Ca2+
i] levels in leukemic blasts. ... 157 Figure 43. [Ca2+
i] levels in DAMI cells overexpressing CALR wt, type 1 and type 2 mutations. ... 157
Figure 44. Fluorescence-based analysis of ER Ca2+ flow in K562 and MARIMO cells. ... 159 Figure 45. Fluorescence-based analysis of ER Ca2+ flow in DAMI cells overexpressing CALR WT, type 1 and type 2 mutations. ... 161
Figure 46. [Ca2+
i] levels in DAMI cells overexpressing CALR wt, type 1 and type 2 mutations after PMA induction. ... 163
8
Figure 48. Comparison of the fluorescence-based analysis of ER Ca2+ flow between DAMI cells overexpressing CALR wt, type 1 and type 2 mutations before and after PMA megakaryocyte
induction. ... 166
Figure 49. Comparison of the ER Ca2+ release between DAMI cells overexpressing CALR wt, type 1 and type 2 mutations before and after PMA megakaryocyte induction. ... 167
Figure 50. Analysis of CD41a cell surface marker expression in K562 cells after BTP-2 treatment. ... 169
Figure 51. Analysis of CD41a cell surface marker expression in MARIMO cells after BTP-2 treatment. ... 170
Figure 52. CD41a quantification and cell death induction after 50 µM BTP-2 treatment. ... 171 Figure 53. Analysis of CD41a cell surface marker expression in K562 cells after Fendiline treatment. ... 172
Figure 54. Analysis of CD41a cell surface marker expression in MARIMO cells after Fendiline treatment. ... 173
Figure 55. CD41a quantification and cell death induction after 20 µM Fendiline treatment. ... 174
Figure 56. Cell proliferation analysis of MARIMO and K562 cells exposed to BTP-2 and Fendiline treatment. ... 176
Figure 57. MPL expression in MARIMO cells after Riluzole, BTP-2 and Fendiline treatment. ... 178
9
List of Tables
Table 1. The 2016 WHO classification scheme for Myeloid Neoplasms and subcategorisation
of Myeloproliferative Neoplasms ... 21
Table 2. 2016 Who Diagnostic Criteria for PV, ET and PMF ... 25
Table 3. Described CALR mutations in MPN patients... 32
Table 5. CALR amino acid sequences used in this study. ... 45
Table 6. List of plasmids used in this study. ... 53
Table 7. List of antibodies used in this study. ... 54
Table 8. List of buffers used for western blot analysis. ... 57
Table 9. Taq PCR cycles. ... 59
Table 10. qRT-PCR cycles ... 60
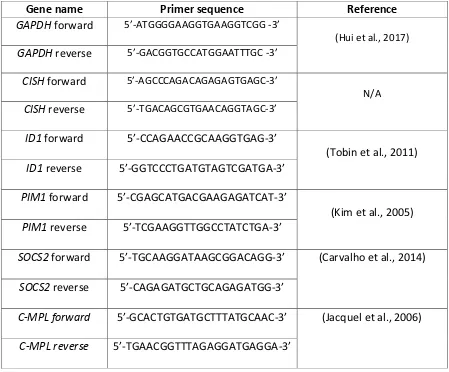
Table 11. Primers used in this study. ... 61
Table 12. List of antibodies used in this study. ... 63
Table 13. Drug treatments used in this study. ... 65
Table 14. Rank1 threading templates for query protein sequence. ... 76
10
Acknowledgments
Firstly, I would like to express my gratitude to my supervisor Dr. Athar Aziz, for his support
and trust throughout this thesis. Thanks for believing in me and for allowing me to do this
project. I am equally grateful to my co-supervisor Professor Marija Krstic-Demonacos for her guidance and help during this PhD.
Secondly, I would like to thank Dr Patrick Caswell for his collaboration and for allowing me
access to his laboratory to perform the microscopy experiments. To Dr Joseph Hetmanski for
his help in microscopy, it was great to have the opportunity to work with you again. To Dr.
Farooq A Kiani, for his contribution in thestructural analysis and to Dr Petros Papadopoulos,
for his collaboration in this project, his support and trust in me in the recent years. Also, I
would like to thank the laboratory of Dr Tony Green, for sharing the CALR plasmids and the
MARIMO cell line.
I would like to extend my gratitude to my friends in the laboratory for their help over the past
three years. To Dr. Laura Brettell, Jess Hall, May Rabaj and Dr. Paz Aranega Bou, it has been
great sharing this experience with you. I feel so lucky to have shared the lab and office with
you all, thanks for your friendship and continuous support. Special thanks to May for your
suggestions and ideas about the calcium experiments. To Basmah Allakari, for providing
invaluable help with flow cytometry, it has been essential for me to perform all the FACs
analysis. I am also thankful to everyone else in Salford University who gave me advice and
support throughout this project, including Jess Kevill, Muna Abubaker, Mathew Jones, Dr.
Emyr Baker, Alice Guazzelli and Sangkab Sudsaward.
I would also like to express my gratitude to the University of Salford, for their award of a
Pathway to Excellence Studentship which provided me financial support to perform this PhD
project.
I would additionally like to thank Inés Mateo and Elena Sánchez for your help and guidance in
the laboratory from a distance. Thanks for your useful discussions regarding my project and
11
journey would not have been the same without you. To you, and all my friends who provided
laugher through difficult times. I could not ask for better friends.
Last, but not least, I would like to thank my family. To my sister, Lucia Morlán, for being my
best companion, for all the laughs and for always showing a smile when I needed one. To my
mother, Mª del Mar Mairal, for your unconditional love, invaluable support and for teaching
me that there is no obstacle in life that cannot be overcome. And finally, to my father, Lorenzo
Morlán, who has always believed in me. Thanks for our endless scientific talks, for your
advices and for your invaluable help through this project. None of this would have been
12
Declaration
This thesis is presented for the Award of the degree of Doctor of Philosophy by Salford
University. The work presented in this thesis has been conducted in approximately three years
and a half and has been funded by the Pathway to Excellence Studentship from the University
of Salford. No portion of the work referred to in this thesis has been submitted in support of
an application for another degree or qualification in this or any other university or other
institute of learning.
Although the author has performed most of the experiments, some parts of this thesis were
carried out in collaboration with other colleagues. High resolution microscopy shown in
sections 5.2.1 and 5.2.2 was performed in collaboration with the laboratory of Dr. Patrick
Caswell (The University of Manchester, UK) and microscopy was mostly executed by Dr.
Joseph Hetmanski. Moreover, DAMI clones overexpressing CALR WT and CALR mutations
used during this thesis were transduced and established by Dr. Petros Papadopoulos (Hospital
13
Abbreviations
[Ca2+
i] Intracellular calcium concentration
AM Acetoxymethyl
AML Acute myeloid leukemia APC Allophycocyanin
BM Bone marrow Ca2+ Calcium
CALR Calreticulin
CCBs Calcium channel blockers CISH Cytokine inducible SH2 CML Chronic myeloid leukemia CNX Calnexin
DMS Demarcation membrane system DTT Ditiotreitol
EDTA Ácido etilendiaminotetraacético
14 IDPRs Intrinsically disordered protein regions IP3-R Inositol 1,4,5-trisphosphate receptor I-TASSER Interactive threading assembly refinement JAK2 Janus kinase 2
MAPK Mitogen-activated protein kinase MDS Myelodysplastic syndromes MoRFs Molecular Recognition Features MPL Myeloproliferative leukemia protein MPNs Myeloproliferative Neoplasms mRNA Messenger RNA
MTS [3-(4,5-dimethylthiazol-2-yl)-5-(3-carboxymethoxyphenyl)-2-(4- NMDARs N-methyl-D-aspartate receptors
PE Phycoerythrin
Ph Philadelphia chromosome pI Isoelectric point
PI3K Phosphoinositide 3-kinase
PIM1 Proto-oncogene, serine/threonine kinase
PKC Protein kinase C
PMA Phorbol 12-myristate 13-acetate PMCA Plasma membrane Ca2+ ATPase PMF Primary myelofibrosis
15 PV Polycythemia vera
qRT-PCR Quantitative real-time Polymerase Chain Reaction SERCA Sarco/endoplasmic reticulum Ca2+ ATPase
SOCE Store-operated Ca2+ entry
SOCS Suppressor of cytokine signalling
STATs Signal Transducer And Activator Of Transcription STIM Stromal interaction molecule
sulfophenyl)-2H-tetrazolium, inner salt; MTS]
TG Thapsigargin TPO Thrombopoietin
16
Abstract
Calreticulin (CALR) is an endoplasmic reticulum (ER) protein that plays an important role as a
calcium (Ca2+) buffering chaperone. Mutations in CALR exon 9 have been identified in essential thrombocythemia and primary myelofibrosis, two myeloproliferative neoplasms
(MPNs) characterised by megakaryocyte hyperplasia. Despite the large body of research built
around CALR mutations, many aspects of the oncogenic mechanisms of CALR in MPNs remain
unanswered. This investigation aims to investigate whether CALR mutations affect the nature
of the C-terminal domain of this protein, its sub-cellular compartmentalisation and its Ca2+ buffering activity during megakaryocyte hyperplasia. Additionally, this study establishes a
new cellular model to investigate megakaryocyte differentiation in presence of CALR
mutations.
In silico analysis of the structural characteristics of CALR mutant C-terminal domain revealed
that CALR mutations lead to changes in its secondary structure, its protein binding properties
and changes the acidity of CALR mutant´s C-terminal domain. These physical alterations could
affect CALR cellular behaviour by leading to inefficient ER Ca2+ buffering activity and lead to a novel oncogenic network of protein interactions.
This study revealed that MARIMO leukemic cell line, which harbours a CALR mutation, has in
vitro megakaryocyte differentiation potential. Importantly, this discovery was useful for
further studies aiming to analyse CALR mutant cells during megakaryocyte commitment.
Moreover, study of CALR mutant cellular localisation showed that this protein is localised
within the ER, but it is also mislocalised within the cytoplasm and cell membrane, where it
co-localised with thrombopoietin receptor. Interestingly, CALR cell surface expression increased
during megakaryocyte commitment in CALR mutant cells, showing a dynamic process of CALR
compartmentalisation during megakaryocyte differentiation.
One of the more significant findings shown in this study is the emergence of intracellular Ca2+ concentrations ([Ca2+
I]) as an important element during megakaryopoiesis. Importantly, CALR mutations impaired the cellular ER Ca2+ buffering activity and led to changes in the [Ca2+
17 that physical manipulation of [Ca2+
I] leads to the emergence of a megakaryocyte phenotype in leukemic cells, showing the relevance of this factor during megakaryocyte commitment.
All together, these findings elucidate novel effects of CALR mutations into the physical and
functional characteristics of CALR mutant in MPNs, describing new aspects of this driver
mutation during the oncogenesis of these diseases. Finally, the current data highlight the
importance of studying the effects of CALR mutations during the process of megakaryocyte
18
CHAPTER 1:
General background
1.1. Overview of normal and malignant megakaryopoiesis
Megakaryocytes are bone marrow cells characterised by a multilobulated or polyploid
nucleus and a large cytoplasmic diameter (100-150 µm). These cells are the precursors of
platelets, of which approximately 1x10¹¹ are released daily into the blood stream by a highly dynamic process (Wen et al., 2011). Megakaryocytes are infrequent within the bone marrow,
as there are only 1 in 103 nucleated cells. Megakaryopoiesis is the complex process of megakaryocyte formation which is highly regulated by external factors such as the bone
marrow stroma, cytokines or hormones (Wen et al., 2011; Machlus et al., 2014).
During megakaryopoiesis, megakaryocytes derive from haematopoietic stem cells (HSCs)
through several sequential commitment steps. HSCs are a rare population of cells that reside
in the bone marrow maintaining the hematopoietic lineage (Ogawa, 1993). These pluripotent
embryonic cells can differentiate into hematopoietic progenitor cells (HPCs) which will
subsequently commit into either of two different lineages, the common lymphoid progenitors
(CLPs) (Kondo et al., 1997) or common myeloid progenitors (CMPs) (Akashi et al., 2000). CLP
has the capacity to differentiate into lymphoid cells, whereas CMP leads to the development
of the myeloid cell linage. Firstly, CMP differentiate into more differentiated progenitors,
known as granulocyte/monocyte progenitors (GMPs) and megakaryocyte/erythroid
progenitors (MEPs) (Debili et al., 1996). Finally, MEP generates single lineage progenitor cells
which will finally become mature erythroid or megakaryocyte cells (Figure 1). The proportion
of each blood cell type is strictly regulated in the bone marrow and therefore, a controlled
balance between self-renewal and cell differentiation establishes a healthy blood cell
composition.
After megakaryocyte differentiation, cell maturation starts with the expression of platelet
specific genes, increase cell size and an increase in cell ploidy (Bianchi et al., 2016; Zimmet
and Ravid, 2000). Megakaryocytes ploidy is acquired by a process known as endomitosis,
19
megakaryocytes migrate close to the vasculature within the bone marrow in response to
Stromal-derived factor-1α (SDF-1α) (Avecilla et al., 2004). Here, megakaryocytes produce long
and branched cytoplasmic projections known as demarcation membrane system (DMS) (Junt
et al., 2007; Schulze et al., 2006). These projections are extended into the bone marrow
sinusoids lumen and become fragmented, releasing platelets into the circulatory system (Junt
et al., 2007) (Figure 1).
Cytokines are produced within the bone marrow microenvironment and these directly
support megakaryocyte terminal differentiation (Yu and Cantor, 2012). Thrombopoietin
(TPO) is known to be the most important cytokine during megakaryopoiesis. TPO and its
receptor myeloproliferative leukemia protein (MPL)are critical for megakaryopoiesis as seen
in mouse models where knock down of any of both genes leads to thrombocytopenia (Gurney
et al., 1994; Bunting et al., 1997).
Megakaryocyte proliferation and apoptosis are highly balanced during megakaryopoiesis to
reach a tight control of cell production. Nevertheless, when a genetic mutation occurs, this
balance might be altered leading to an uncontrolled production of megakaryocytes within the
bone marrow. Megakaryocyte hyperplasia can be described in benign diseases such as
Figure 1. Megakaryopoiesis.
20
idiopathic thrombocytopenia (Ganguly and Cunningham, 2004), however it is mostly
associated to malignant or clonal disorders such as chronic myelogenous leukaemia
(Carbonell et al., 1982), acute megakaryocytic leukemia (Hahn et al., 2016) or
myeloproliferative neoplasms (MPNs).
1.2. Myeloproliferative Neoplasms
Myeloid Neoplasms are a heterogeneous group of stem cell clonal diseases characterised by
an overproduction of myeloid cells. The 2016 World Health Organisation (WHO) classification
system for haematopoietic tumours establishes three main categories of neoplasms: Acute
myeloid leukemia (AML), Myelodysplastic syndromes (MDS) and MPNs (Arber et al., 2016)
(Table 1).
AML is a disease characterised by an uncontrolled neoplastic proliferation of myeloid blasts
cells in the bone marrow. This production of blast cells leads to a disruption of normal
haematopoiesis and consequently haematopoietic insufficiency and bone marrow failure (De
Kouchkovsky and Abdul-Hay, 2016). In contrast, MDS are clonal disorders characterised by an
ineffective haematopoietic process which could transform into AML. Additionally, cytopenias
and dysmorphogenesis of myeloid cells with dysplastic features are hallmarks of MDS (Gangat
et al., 2016). On the other hand, MPN display overproduction of functional mature myeloid
cells, such as erythrocytes or megakaryocytes, within the bone marrow. Additionally, MPN
patients display risk of AML transformation (Tefferi, 2016a).
Nevertheless, this classification is not entirely precise, as patients could display symptoms of
MDS and MPNs. This group of patients are assigned to a category of overlap of MDS/MPN.
Additionally, the 2016 WHO classification includes myeloid neoplasms associated with
eosinophilia and abnormalities of PDGFRA, PDGFRB, FGFR1 or PCM1-JAK2, mastocytosis and
21
Table 1. The 2016 WHO classification scheme for Myeloid Neoplasms and subcategorisation of Myeloproliferative Neoplasms (Arber et al., 2016).
MYELOID NEOPLASMS
1) Acute myeloid leukemia (AML) and related neoplasms
2)Myelodysplastic syndromes (MDS) 3) Myeloproliferative Neoplasms (MPN)
i. Chronic myeloid leukemia (CML), BCR-ABL1+
ii. Polycythemia vera (PV) iii. Essential thrombocythemia (ET) iv. Primary myelofibrosis (PMF) PMF, prefibrotic/early stage PMF, overt fibrotic stage
v. Chronic neutrophilic leukemia (CNL)
vi. Chronic eosinophilic leukemia, not otherwise specified (NOS) vii. MPNs, unclassifiable
4) MDS/MPN 5) Mastocytosis
5) Myeloid neoplasms associated with eosinophilia and abnormalities of PDGFRA, PDGFRB, or FGFR1, or
with PCM1-JAK2
6) Myeloid neoplasms with germ line predisposition
1.2.1. Myeloproliferative neoplasms, the emergence of key clonal markers
The first classification of MPN was registered in 1951 by William Dameshek as
myeloproliferative disorders (MPDs), which grouped polycythemia vera (PV), essential
thrombocythemia (ET), erythroleukemia, chronic myelogenous leukaemia (CML) and primary
myelofibrosis (PMF) based on their clinical and histologic characteristics (Dameshek, 1951).
Over the years important discoveries based on the molecular pathology of MPNs have led to
a better understanding of the molecular basis of this heterogeneous group of diseases. The
latest WHO classification includes seven subcategories in the group of MPNs: CML BCR-ABL1+, Chronic neutrophilic leukaemia (CNL), PV, PMF, ET, Chronic eosinophilic leukaemia (CEL) and
MPNs-unclassifiable. This classification is based on the molecular and cellular pathology of
the diseases (Table 1) (Arber et al., 2016).
The importance of using molecular markers in the classification of MPNs was firstly confirmed
with the discovery of Philadelphia chromosome (Ph), characteristic of CML. Ph is an aberrant
chromosomal translocation, t(9;22)(q34;q11), which results in the formation of BCR-ABL
22
characteristics, ET, PMF and PV are categorised as Ph-negative MPN. During recent years, the
understanding of the molecular basis of these three diseases has increased greatly.
The discovery in 2005 by four different research groups of a mutation in exon 14 of Janus
Kinase 2 (JAK2) gene present in a high proportion of PV, ET and PMF patients opened a new
molecular diagnostic approach of Ph-negative MPNs (Baxter et al., 2005; James et al., 2005;
Kralovics et al., 2005; Levine et al., 2005). The majority of PV patients (up to 95%) carry this
mutation, whereas in ET and PMF patients it is found in 50-60% of cases. Further research
described a gain-of-function mutation in c-MPL gene, which encodes for thrombopoietin
receptor, in ET and PMF JAK2negative patients (Pikman et al., 2006). These mutations were
described as MPN’s driver mutations and were included as clonal markers in the 2008 revision
of the WHO document for better classification and diagnosis of these diseases (Tefferi and
Vardiman, 2008).
Additional studies have described less common mutations including EZH2 or TET2 in MPN
patients (Delhommeau et al., 2009; Ernst et al., 2010). Although, these somatic mutations
affect only a small fraction of JAK2 and c-MPLnegative MPN patients and therefore they are
not valuable to use as molecular diagnostic markers of MPNs. However, in 2013 two research
groups identified a high incidence mutation in the Calreticulin (CALR) gene in MPN patients
with non-mutated JAK2 and c-MPL, greatly improving the diagnostic approach for these
pathologies (Klampfl et al., 2013; Nangalia et al., 2013). The 2016 WHO diagnostic criteria of
ET and PMF included the presence of CALR mutations as a major criterion for a correct
diagnosis of these diseases (Arber et al., 2016) (Table 2).
1.3. Classic Ph-negative MPNs
ET, PV and PMF are considered as stem cell-derived haematological diseases (Beer et al.,
2009; Tefferi, 2010). The presence of mutational pathogenic events in Ph-negative MPNs
occurs in early stages of the hematopoietic process. This has been demonstrated with the
identification of JAK2 and CALR somatic mutations in hematopoietic progenitor cells
(Kralovics et al., 2005, Nangalia et al., 2013). Interestingly, these two independent driver
23
However, CALR mutations have only been described in ET and PMF, the two MPNs
characterised by megakaryocyte neoplasia (Figure 2).
1.3.1. Essential thrombocythemia
ET is a disease characterised by a neoplastic proliferation of megakaryocytes and platelets
within the bone marrow and the blood stream. Platelets characteristic of this disease are
functionally and morphologically altered and therefore ET patients display a higher risk of
bleeding and thrombosis (Klco et al., 2010; Wilkins et al., 2008).
It is estimated that ET prevalence is about 38-57 per 100,000 individuals (Mehta et al., 2014).
[image:24.595.87.505.164.427.2]Approximately the median age range of ET patients at diagnosis is between 50-60 years old
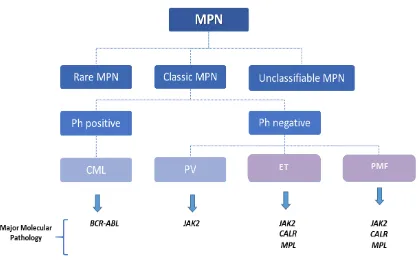
Figure 2. Schematic diagram of MPNs classification.
The 2016 WHO latest classification divides MPNs in three major categories: rare MPN, classic MPN and unclassifiable MPN. Classic MPN are classified as Philadelphia chromosome (Ph) positive or Ph negative. Ph negative includes
Polycythemia Vera (PV) which major molecular pathological feature is JAK2 mutations or Essential thrombocythemia
(ET) and primary myelofibrosis (PMF) characterised by JAK2, CALR of MPL mutations. Purple shades identify the MPNs
affected by CALR mutations.
24
and the incidence of ET has higher prevalence in females (Aruch and Mascarenhas, 2016).
Clinically, ET is characterised by thrombosis, erythromelalgia, transient ischemic attacks and
splenomegaly. However, some cases of ET are diagnosed in symptom-free patients during
routine blood tests (Sanchez and Ewton, 2006).
The major feature of ET is a platelet count greater than 450,000 x109/L, in addition to further diagnostic criteria as listed in Table 2. JAK2mutation is the major molecular pathological
feature, affecting about 50-60% of ET patients. CALR mutation is present in approximately
30%, followed by c-MPL mutation which affects 5% of patients (Klampfl et al., 2013).
Nevertheless, the molecular pathogeny of the remaining group of patients with non-mutated
JAK2, CALR or c-MPL remains elusive.
Evolution of ET to myelofibrosis varies in the disease duration from the onset of diagnosis. In
the first decade of diagnosis 3-10% of cases evolve to myelofibrosis and in the second decade
it increases greatly, to 6-30%. Additionally, ET could progress to AML in a small percentage of
patients, from 1-2.5% during the first decade of the disease, increasing to 5-8% in the next
decade (Beer et al., 2011; Sanchez and Ewton, 2006; Wolanskyj et al., 2006). ET patients are
considered to be at high risk of thrombotic events. However, it is important to note that
recent investigations have shown a differing risk of thrombosis dependent on the driver
mutation, as CALR mutated patients show a lower risk of thrombosis than JAK2 and c-MPL
25 Table 2. 2016 Who Diagnostic Criteria for PV, ET and PMF
PV ET prePMF Overt PMF
Major criteria
1. Hgb>16.5 g/dL
(men)
> 16.0 g/dL (women) Or Hematocrit >49% (men) Hematocrit >48% (women) Or
Increased in cell mass
1. Platelet count ≥ 450 x
109/L
1. Megakaryocytic
proliferation and atypia, without reticulin fibrosis grade 1, accompanied by increased age-adjusted BM cellularity,
granulocytic proliferation, and often
decreased erythropoiesis
1. Presence of
megakaryocytic proliferation and atypia, accompanied by either reticulin and/or collagen fibrosis grades 2 or 3
2. BM biopsy showing hypercellularity for age with trilineage growth including prominent erythroid, granulocytic, and megakaryocytic proliferation with pleomorphic, mature megakaryocytes (differences in size)
2. Megakaryocyte
proliferation with large and mature
morphology. No significant increase in neutrophil
granulopoiesis or erythropoiesis and minor increase in reticulin fibres
2. Not meeting WHO criteria for CML, PV,
MDS, or other myeloid neoplasm
3. Presence of
JAK2V617F or
JAK2 exon 12
mutation
3. Not meeting WHO
criteria for CML
BCR-ABL+, PV, PMF, MDS, or
other
myeloid neoplasm
3. Presence of JAK2, CALR or c-MPL mutation
or in the absence of these mutations,
presence of another clonal marker or absence of minor reactive BM reticulin fibrosis
4. Presence of JAK2,
CALR or c-MPL mutation
Minor criteria
1. BM
trilineage
myeloproliferation
1. Presence of a clonal
marker or absence of evidence for reactive thrombocytosis
1. Leukocytosis ≤11x 109/L
2. Subnormal serum
Epo level
2. Increased serum LDH level
3. EEC growth 3. Anemia
4. Palpable splenomegaly
26
1.3.2. Primary myelofibrosis
PMF is a myeloproliferative disorder associated with a neoplastic proliferation of
megakaryocytes, abnormal cytokine expression and reactive bone marrow fibrosis (Tefferi,
2016b). Increased bone marrow fibrosis leads to ineffective erythropoiesis and consequently
severe anemia. Additional clinical manifestations in PMF include hepatosplenomegaly,
thrombosis, bone pain and bleeding, among others (Tefferi and Nagorney, 2000).
The prevalence of PMF is lower than ET, being 4-6 per 100,000 individuals and prevalence of
MF post-ET and post-PV varies between 0.5-1.1 and 0.3-0.7 per 100,000 respectively (Mehta
et al., 2014). It is estimated that median age at PMF diagnosis is approximately 65 years old
and there are not significant differences between sex (Tefferi and Nagorney, 2000).
The revised 2016 WHO criteria distinguished two new subcategories within PMF, known as
prefibrotic (prePMF) and overtly fibrotic PMF (Arber et al., 2016). Pre and overt PMF
diagnostic criteria are listed in Table 2. Careful diagnosis must be done in prePMF, as it shares
a similar mutation profile with ET (60% JAK2 mutation, 35% CALR mutation, 10% c-MPL
mutation approximately) (Tefferi and Pardanani, 2014). Therefore, cautious analysis of
megakaryocyte characteristics is recommended to distinguish between the two diseases
(Tefferi, 2016b). PMF has the worst survival rates of Ph-negative MPNs and has the higher risk
to develop into AML (5-30%) (Mesa et al., 2005; Klco et al., 2010).
1.4. JAK-STAT signalling, a key cellular pathway in megakaryopoiesis and MPNs pathogenesis
The JAK/STAT pathway is a conserved cell signalling cascade involved in development and
present in a diverse range of species from flies to humans. This signalling pathway is an
important cellular mechanism to transduce cytokine and growth factor signals, being involved
in central cellular processes such as cell differentiation and proliferation, as well as playing
important roles in the haematopoietic and immune system development (Rawlings et al.,
27
JAK/STAT signal transduction is mediated by two main protein families: JAKs (JAK1-3 and Tyr)
and signal transducer and activator of transcription (STATs) (STAT1-4, STAT5a, STAT5b and STAT6). Intracellular JAK/STAT cascade activation occurs when cytokine ligands bind and
stimulate a conformational change of the receptor, inducing the multimerization of the
receptor subunits (Rawlings et al., 2004). Receptors involved in JAK/STAT signalling lack
intrinsic kinase activity. Receptor dimerization or oligomerization brings JAK kinases
associated to the receptor subunits into proximity. This allows the trans-phosphorylation of
JAK kinases and consequently an increase in their enzymatic activity (Ihle and Gilliland, 2007).
As a result, the active receptor complex recruits dormant cytoplasmic transcription factors,
known as STATS. Phosphorylated STAT proteins dimerize and translocate from the cytoplasm to the cellular nucleus. STAT dimers bind to specific DNA regions known as Gamma-interferon
activated sequences (GAS) and Interferon-Stimulated Response Element (ISRE), activating or
repressing gene transcription (Lim and Cao, 2006). JAK-STAT pathway displays a negative
feedback loop in order to control its own signalling. There are three major protein families
involved in the negative regulation of this pathway: protein inhibitor of activated stats (PIAS),
suppressors of cytokine signalling (SOCS) and protein tyrosine phosphatases (PTPs)
(Greenhalgh and Hilton, 2001) (Figure 3).
In theory, JAK/STAT signalling is a simple cellular pathway; however, this cascade cross-talks
with more complex signalling pathways such as the mitogen-activated protein kinase (MAPK)
pathway (Rawlings et al., 2004). For example, SOCS-3 binds and inhibits RasGAP, a negative
regulator of Ras protein, leading to Ras activation (Cacalano et al., 2001). Moreover, MAPK
pathway can promote the activation of JAK/STAT pathway by different mechanisms. It has
been shown that activation of epidermal growth factor receptor (EGFR) results in an
activation of STATs without the interaction of JAK proteins (Park et al., 1996). In addition to
MAPK, other signalling pathways have been shown to interact with JAK/STAT signalling, such
as phosphoinositide 3-kinase (PI3K) pathway (Abell and Watson, 2005).
The JAK/STAT pathway plays a key role during megakaryopoiesis by transducing signals from
TPO, an essential cytokine during this process (Geddis, 2010). Altered TPO signalling is
characteristic of PMF, ET and PV. Interestingly, two of the most common driver mutations
described in these diseases affect two key components of this pathway, MPL and JAK2,
28
development of therapies targeting the inhibition of JAK/STAT cascade for the treatment of
MPNs. For example, Ruxolitinib is a selective inhibitor of JAK1/2 approved for myelofibrosis
treatment (Quintas-Cardama et al., 2010) which shows reductions in myelofibrotic symptoms
and improved quality of life in ET and PMF patients (Harrison et al., 2012). Importantly, a
previous study revealed a high correlation between the mutation profile in PMF patients and
the response rate to Ruxolitinib (Patel et al., 2015). This highlights the importance of
enhancing our understanding of the pathology of MPN driver mutations (JAK2, CALR and
c-MPL) for a correct treatment of these neoplasms based on the molecular profile of MPN
29
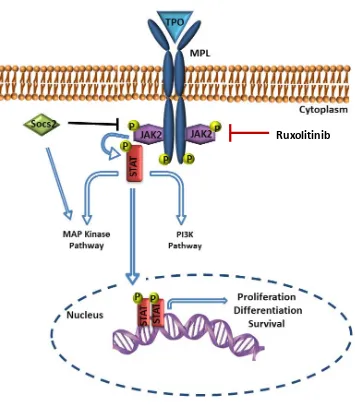
Figure 3. JAK-STAT signalling pathway.
Cytokines ligands bind to the hematopoietin receptors leading to the activation of JAK proteins. These proteins phosphorylate the intracellular domain of the receptor, leading to the formation of docking sites for downstream signalling proteins, such as STATS. Active STATS translocate into the nucleus and active the transcription of target genes. SOCS gene expression is dependent on this signalling pathway and act as a negative feedback loop of this cytokine dependent pathway.
30 1.5. Classic mutations in Ph-negative MPNs
1.5.1. JAK2 mutations
JAK2 protein, member of the JAK family proteins, is a known non-receptor tyrosine kinase
involved in signal transduction of JAK-STAT pathway. JAK2 gene is located in chromosome
9p24 and comprises 25 exons. Oncogenic JAK2V617F mutation is the most frequent mutation
in Ph-negative MPN patients (Baxter et al., 2005). Additionally, it has been detected in other
myeloproliferative diseases, such as CML and AML (Hussein et al., 2008; Kiladjian, 2012). The
JAK2V617F somatic mutation found in hematopoietic cells is characterised by a transversion of
guanine (G) for thymine (T) leading to a substitution of phenylalanine (F) for valine (V). This
mutation leads to a constitutively active JAK2 (Kralovics et al., 2005).
MPN patients carrying JAK2V617F mutations are older than patients negative for these
mutations. Additionally, JAK2V617F mutation shows a more aggressive clinical phenotype, with
a higher incidence of complications such as haemorrhage, thrombosis and secondary fibrosis
(Kralovics et al., 2005).
1.5.2. c-MPL mutations
After the identification of JAK2 mutations in PV, ET and PMF patients, research was focussed
on the identification of the molecular pathology of JAK2 negative patients. Shortly after the
discovery of JAK2V617F, the gain-of-function mutation cMPLW515Lwas described in ET and PMF
JAK2negative patients (Pikman et al., 2006). c-MPL mutation consists in a G to T transition in
exon 10, leading to a tryptophan to leucine substitution. This oncogenic event results in
constitutive active JAK/STAT, MAPK and PI3K pathways (Chaligne et al., 2008). Presence of
c-MPL mutation in ET patients is associated with the elderly, low haemoglobin levels,
31
1.6. Calreticulin, a novel driver mutation in MPNs
After the identification of JAK2 and c-MPL mutations a big subset of MPN patients were
considered as c-MPL and JAK2 negative and no driver mutation was known in this group of
patients. However, in 2013 two different investigations revealed by using whole-exome
sequencing that CALR was mutated in this group of MPNs patients (Klampfl et al., 201;
Nangalia et al., 2013). CALRmutations were described as “indels” within exon 9, generating a
+1 bp frameshift. Several types of CALR mutations have been identified; all leading to a
mutant protein with an altered C-terminal region. The amino acid sequence of CALR mutants
described in ET and PMF patients are shown in Table 3, of which two mutations are described
as the most common mutation variants: a 52-bp deletion, L367fs*46 (type 1), and a 5 bp
insertion, K385fs*47 (type 2) (Nangalia et al., 2013).
CALR mutations were identified in patients with ET and PMF and these mutations were
mutually exclusive with JAK2 and c-MPL mutations. CALR mutations have been described as
the second most common driver mutations after JAK2 in both diseases. In contrast, no CALR
mutations were identified in PV patients (Klampfl et al., 2013; Nangalia et al., 2013). However,
there is strong evidence supporting that CALR and JAK2 mutated disease phenotypes are
different, suggesting two different facets of these diseases based in the molecular pathology
(Rumi et al., 2014). JAK2 and CALR mutated ET and PMF are described as distinct disease
entities with different clinical outcomes (Rumi et al., 2014; Pietra et al., 2015). Moreover,
recent studies have characterised the link between CALR mutations subtypes and different
clinical phenotype in MPNs (Cabagnols et al., 2015; Pietra et al., 2015). CALR type 1 mutations
have been mainly associated with a myelofibrotic phenotype and this mutation has been
identified in ET with high risk of myelofibrotic progression (Pietra et al., 2015; Cabagnols et
al., 2015). In contrast, type 2 mutations are usually associated with ET phenotype.
Interestingly, patients with type 2 mutations display higher platelet counts and a lower risk of
thrombosis than JAK2 mutant (Cabagnols et al., 2015; Pietra et al., 2015). Therefore, the
studies presented thus far provide evidence that molecular profiling is essential for a correct
32
Table 3. Described CALR mutations in MPN patients.
Mutant sequences are highlighted in grey (Nangalia et al., 2013)
Name Amino acid sequence
Deletions
L367fs*46
E370fs*43
E370fs*48
L367fs*48
L367fs*44
K368fs*51
L367fs*52
R366fs*53
E371fs*49
K368fs*43
E370fs*37
D373fs*47
K374fs*53
E371fs*49
QDEEQRTRRMMRTKMRMRRMRRTRRKMRRKMSPARPRTSCREACLQGWTEA
QDEEQRLKEVMRTKMRMRRMRRTRRKMRRKMSPARPRTSCREACLQGWTEA
QDEEQRLKEQRTRMMRTKMRMRRMRRTRRKMRRKMSPARPRTSCREACLQGWTEA
QDEEQRQRTRRMMRTKMRMRRMRRTRRKMRRKMSPARPRTSCREACLQGWTEA
QDEERRMMRTKMRMRRMRRTRRKMRRKMSPARPRTSCREACLQGWTEA
QDEEQRLRRRQRTRRMMRTKMRMRRMRRTRRKMRRKMSPARPRTSCREACLQGWTEA
QDEEQRRRRRQRTRRMMRTKMRMRRMRRTRRKMRRKMSPARPRTSCREACLQGWTEA
QDEEQKRRRRQRTRRMMRTKMRMRRMRRTRRKMRRKMSPARPRTSCREACLQGWTEA
QDEEQRLKEERQRTRRMMRTKMRMRRMRRTRRKMRRKMSPARPRTSCREACLQGWTEA
QDEEQRLMMRTKMRMRRMRRTRRKMRRKMSPARPRTSCREACLQGWTEA
QDEEQRLKERMRRMRRTRRKMRRKMSPARPRTSCREACLQGWTEA
QDEEQRLKEEEERTRRMMRTKMRMRRMRRTRRKMRRKMSPARPRTSCREACLQGWTEA
QDEEQRLKEEEEDKRRRRQRTRRMMRTKMRMRRMRRTRRKMRRKMSPARPRTSCREACLQGWTEA
QDEEQRLKEERTRRMMRTKMRMRRMRRTRRKMRRKMSPARPRTSCREACLQGWTEA
Insertions
K385fs*47
K385fs*47
QDEEQRLKEEEEDKKRKEEEEAEDNCRRMMRTKMRMRRMRRTRRKMRRKMSPARPRTSCREACLQGWTEA
QDEEQRLKEEEEDKKRKEEEEAEDLCRRMMRTKMRMRRMRRTRRKMRRKMSPARPRTSCREACLQGWTEA
Complex
R376fs*55
K385fs*47
E381fs*48
QDEEQRLKEEEEDKKLCKRRRRQRTRRMMRTKMRMRRMRRTRRKMRRKMSPARPRTSCREACLQGWTEA
QDEEQRLKEEEEDKKRKEEEEAEDSCRRMMRTKMRMRRMRRTRRKMRRKMSPARPRTSCREACLQGWTEA
33
Major efforts have been undertaken to improve the molecular diagnosis of MPN patients.
Identification of CALR mutations in MPN patients is an important step towards a correct
categorisation of the disease. Recent investigations have been focussed on the development
of efficient techniques for the detection of CALR mutations. Importantly,
immunohistochemistry to detect the CALR mutant in MPNs patients’ samples is highly specific
for these mutations, showing that this technique could be very valuable for routine diagnostic
tests (Andrici et al., 2016). Furthermore, a novel technique using screening PCR has been
proved to be satisfactory when detecting CALR mutations in primary bone marrow samples
(Jeong et al., 2016). Additionally, recent publication revealed the development of a next
generation sequencing assay that could significantly improve the screening of MPN driver
mutations during the diagnostic process (Frawley et al., 2018).
In addition to an accurate diagnosis based on the characterisation of the molecular driver
mutations of the disease, a deep knowledge of the cellular and molecular basis of these
mutations is essential for a correct understanding of MPN’s biology. As such, analyses of the
CALR cellular functions and the mechanisms of CALR mutations oncogenicity are essential to
shed light on its contribution to the pathogenesis and prognosis of MPNs.
1.6. Calreticulin: a multifunctional cellular protein
CALR is a chaperone and a Ca2+ buffering protein that resides in the lumen of the endoplasmic reticulum (ER). CALR gene comprises 5891 bp and is localised on chromosome 19. The
obtained protein is formed by 417 amino acids and has three functional and structural
domains (Figure 4). The N-terminal domain includes carbohydrate and polypeptide binding
sites (Leach et al., 2002). In addition, Zn2+ binding sites have been described to be in this domain (Baksh et al., 1995). The proline rich domain also contains carbohydrate and
polypeptide binding sites and contains a specific binding region to interact with ER
chaperones, such as ERp57 (Frickel et al., 2002). In vitro analyses have shown that this region
34
The CALR C-terminal domain plays an important role in Ca2+ buffering as it binds to over 50% of ER Ca2+ due to the presence of a high number of negatively charge amino acids (Nakamura et al., 2001b). These residues have low Ca2+ binding affinity and high capacity. Finally, CALR C-terminal domain contains the ER retention/retrieval motif, known as KDEL
(Lys-Asp-Glu-Leu). This motif ensures the retrieval of this protein from the Golgi apparatus to the ER (Figure
4) (Sonnichsen et al., 1994).
1.6.1. CALR chaperone activity
ER is a key cellular organelle essential for protein synthesis and folding. CALR resides mostly
within the lumen of the ER where it functions as a chaperone of nascent glycoproteins,
ensuring appropriate protein folding (Figure 5). Once glycoprotein chains are synthesised
within the ER, two terminal glucose residues are removed in a sequential manner from the
oligosaccharide region of these proteins by glucosidase I and II. This ensures the exposure of
a Glc1Man9GlcNAc2 epitope that is recognised by CALR and calnexin (CNX) (Caramelo and Parodi, 2008). These two lectin chaperones work together to cover a broader range of
substrates depending on the topology of the nascent glycoproteins. CNX will bind to proteins
next to the ER membrane and CALR will bind to soluble glycans (Hebert et al., 1997).
Figure 4. Calreticulin protein and its functional domains.
CALR is formed by 417 amino acids and it comprises three domains: N-terminal domain, Proline-rich domain and C-terminal domain. Each domain is essential for CALR functions within the cell. Importantly, KDEL region (ER retention motif) is located at the end of the C-terminal domain.
N-domain Pro rich-domain C-domain
Chaperone activity
Zn2+ binding
Chaperone activity
Ca2+ binding
Proline rich ERP57 binding
ER retrieval signal
Ca2+ binding and buffering
activity
KDEL
35
Intermediated folded glycoproteins interact with CALR/CNX for final protein folding. Then,
folded proteins are rapidly deglucosylated and finally are secreted out of the ER. However,
glycoproteins for which folding is not complete enter into the “CNX/CALR cycle”. Once final
deglucosylation is completed they are returned to the cycle by glucosidase I, which adds a
glucose residue to the chain. Then, glycan interacts again with CALR/CNX upon correct protein
folding (Hebert and Molinari, 2007). CALR depletion leads to a decline of glycoprotein quality
control (Molinari et al., 2004).
1.6.2. CALR calciumbuffering activity
The ER is the main Ca2+ storing organelle within the cell. Reticular Ca2+ is essential for a variety of cellular processes, such as gene expression, cell signalling and protein synthesis (Sammels
et al., 2010). CALR is one of the most important Ca2+ chaperones within the ER, binding to 50% of total ER luminal Ca2+ stores (Figure 5). In its C-terminal acidic domain there are high capacity Ca2+ binding residues that bind to 25 mole of Ca2+ per mole of CALR with low Ca2+ binding affinity (Kd= 2 mM) (Baksh and Michalak, 1991, Nakamura et al., 2001b). Mutations affecting this protein domain decrease its Ca2+ buffering activity (Breier and Michalak, 1994). Additionally, CALR contains high affinity binding residues (Kd = 10 µM) with low Ca2+ binding capacity, equivalent to 1 mole of Ca2+ per mole of protein (Baksh and Michalak, 1991; Nakamura et al., 2001b). CALR overexpressing cells show an increase in intracellular Ca2+ storage and a reduced amount of Ca2+ influx within the ER lumen (Mery et al., 1996). In contrast, cells without CALR show a decrease in Ca2+ storage capacity, however, free luminal Ca2+ remains the same (Nakamura et al., 2001b).
CALR Ca2+ homeostatic activity could have a key role during cardiac development. CALR null mice are not viable due to altered cardiac development and CALR gene is highly expressed
during early stages of cardiac development (Mesaeli et al., 1999). Additionally, mice
transiently over-expressing CALR leads to arrhythmia and death induced by heart block
(Hattori et al., 2007; Nakamura et al., 2001a). These results suggest a critical role of CALR
during embryonic heart development and in the pathogenesis of cardiac cycle. Moreover,
36
et al., 2008) and osmotic stress in cells within the ascending limb of Henle’s loop (Bibi et al.,
2011).
Figure 5. Schematic representation of CALR cellular functions.
37
1.6.3. CALR functions out of the ER
CALR functions in the cytoplasm
CALR is also compartmentalised in the cytoplasm although the cytoplasmic levels of CALR are
minor compared with CALR population in the ER lumen (Shaffer et al., 2005). Here CALR has
been associated with several cellular processes, such as cell adhesion (Figure 5). CALR
specifically binds to the KXGFFKR sequence of the cytoplasmic tail of α-integrins mediating
integrin activation (Coppolino et al., 1997) and transducing Ca2+ signalling between integrins and Ca2+ channels such as IP
3R (Kwon et al., 2000).
Further studies suggested that CALR interacts with hormone receptors, such as glucocorticoid
receptors (GR)(Figure 5). Nuclear hormone receptors contain in their DNA binding domain a
homologous protein sequence of the cytoplasmic tail of integrins, KXFFKR. CALR interacts with
this sequence and inhibits the direct binding of nuclear hormone receptors to the DNA
hormone response elements (Dedhar et al., 1994). Additionally, CALR induces the nuclear
export of GR (Holaska et al., 2001). Therefore, CALR directly regulates the transcriptional
activity of these receptors.
CALR functions in the cell surface
CALR cell surface expression is a relevant process for immunogenic cell death (Figure 5). CALR
exposure on the plasma membrane is induced by anthracyclines, radiotherapy and Ca2+ depletion ER stores (Tufi et al., 2008; Wemeau et al., 2010). Apoptotic and cancer cells express
CALR within the cell surface and this is recognised by dendritic cells as an “eat me” signal
(Wijeyesakere et al., 2016). Inhibition of CALR cell surface expression in anthracycline treated
cells leads to depletion of immunogenic cell death (Obeid et al., 2007). Investigations
targeting CALR translocation to the cell surface are revealing important information for cancer
38
cell death in response to chemotherapy (Wemeau et al., 2010). However, the molecular
mechanisms of cell death driven by CALR cell surface expression remain to be clarified.
CALR functions in the extracellular matrix
Extracellular CALR is involved in wound healing and tissue remodelling (Figure 5). CALR
significantly increases wound repair by upregulating the expression of certain growth factors
such as transforming growth factor-β3, an important regulator of cutaneous repair (Nanney
et al., 2008). Additionally, in vitro analyses show that CALR in the extracellular matrix induces
cell proliferation and migration of fibroblasts, vascular endothelial cells and keratinocytes
(Nanney et al., 2008). The importance of CALR for tissue repair and healing is being
investigated for its potential use as a potent therapeutic agent to treat diabetic wound healing
and chronic wounds (Greives et al., 2012).
1.7. Oncogenicity of CALR mutations in MPNs
Since 2013, several major efforts have been made to increase the understanding of CALR
mutant cellular behaviour and its role as a MPN driver mutation. All the CALR mutations
described in ET and PMF affect a highly conserved amino acid sequence at the end of the
C-terminal domain of this protein (Klampfl et al., 2013; Nangalia et al., 2013) (Figure 6). As
previously mentioned, this domain plays an important role in the correct functioning of CALR,
as it contains the major Ca2+ binding sites within the protein. Additionally, CALR C-terminal domain is characteristic of its highly structural instability and it has been proposed that its
spatial conformation might be in close relationship with its Ca2+ buffering activity and its protein binding functions (Migliaccio and Uversky, 2017). CALR mutations are thought to
change the nature of this domain, by altering its chemical and physical characteristics
(Shivarov et al., 2014; Eder-Azanza et al., 2014), possibly leading to abnormal CALR behaviour
39
When CALR was described as a novel MPN driver mutation, there was an initial surprise
regarding the finding of an ER chaperone to be involved in the development of ET and PMF.
CALR mutations did not, apparently, have a direct link with a deregulated JAK/STAT signalling
pathway, as previously described in JAK2 and c-MPL mutations. Therefore, investigating the
link between CALR mutations, deregulated signalling network and MPNs progression has
been a continuous concern within the field.
Recent in vivo studies have been focused in elucidating the role of mutant CALR in the
development of MPN. Retroviral (Marty et al., 2015) and transgenic (Shide et al., 2017)
studies demonstrated that CALR mutations are sufficient to generate specific MPN phenotype
in mice. These studies showed that CALR type 1 mutant expressing mice developed high levels
of myelofibrosis accompanied with splenomegaly and thrombocytosis (Marty et al., 2015). In
contrast CALR type 2 mutation expressing mice showed ET-like phenotype. Both mutant mice
showed increased platelet counts and an amplified megakaryocyte lineage (Marty et al., 2015;
Shide et al., 2017). Moreover, CALR mutant mice harbouring a deleted CALR exon 9 did not
show any disease phenotype, demonstrating that the novel C-terminal domain of CALR
mutants is essential for disease induction (Marty et al., 2016).
Figure 6. Schematic representation of the CALR conserved sequence affected by mutations found in MPN.
CALR mutations affect a highly conserved sequence within CALR C-terminal domain, which includes high
capacity and low affinity Ca2+ binding sites and KDEL region. The amino acid conservation rate within the
affected C-terminal domain is represented by shading. Blue displaying highly conserved residues and light
grey indicates less conserved regions. Purple circles represent Ca2+ binding motifs.
N-domain Pro rich-domain C-domain KDEL
Human Mouse Zebrafish Drosophila
Low capacity and high affinity Ca2+ binding
High capacity and low affinity Ca2+ binding
40
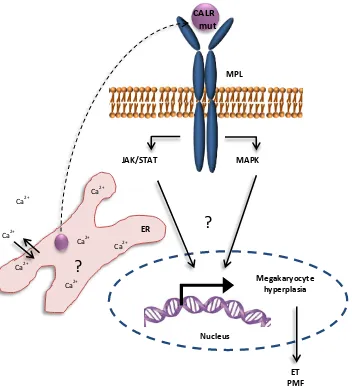
Further studies have been foccussed on elucidating the direct link between CALR mutation
and JAK/STAT signalling pathway. It is now known that MPL receptor is essential for CALR
mutant MPN progression, as CALR mutants directly interact with this receptor leading to its
activation (Chachoua et al., 2016; Elf et al., 2016; Araki et al., 2016). Activation of MPL
receptor by CALR mutant binding is dependent on the N-glycosylation residues located in the
extracellular domain of this receptor and the glycan binding site of the N-terminal domain of
CALR mutant (Chachoua et al., 2016; Araki et al., 2016). FLAG-tagged CALR mutants used for
immunoprecipitation studies showed that mutant CALR physically interacts with MPL
receptor and that the positively charged amino acids localised within the novel C-terminal
domain are essential for this direct interaction (Elf et al., 2016).
Despite the described interaction between CALR mutants and MPL receptor, the
understanding of the consecutive deregulated signalling cascade leading to CALR oncogenicity
remains an intense debate within the field. RNA sequencing of Ba/F3 murine cells
co-expressing CALR mutant and MPL receptor revealed an enrichment of STAT5/3 gene
signatures and additional western blot analysis corroborated the activation of JAK/STAT
signalling cascade in these cells (Elf et al., 2016; Marty et al., 2016). Moreover UT-7 cells
expressing CALR mutations displayed high levels of JAK2, ERK1/2 and STAT5 phosphorylation
in the absence of TPO within the media (Araki et al., 2016). Additionally, the CALR-MPL
downstream pathway was blocked by JAK2 inhibitors in these cells (Araki et al., 2016; Elf et
al., 2016). On the other hand, a novel study revealed that megakaryopoiesis in CALR driven
MPNs might be mediated by MAPK pathway, together with JAK/STAT signalling (Kollmann et
al., 2016). Moreover, analysis of ET primary megakaryocytes revealed that STAT5/3 target
genes are highly expressed in JAK2 ET patients, compared with the CALR mutant group (Lau
et al., 2015). Overall, these studies suggest further complexity in the cellular signalling of
CALR mutant MPNs and highlight the need for additional analyses to decipher the molecular
pathogenesis of these diseases (Figure 7).
CALR mutations have been described only in MPNs characterised by megakaryocyte
hyperplasia. Of note, previous research has linked the presence of CALR mutants with