Gene expression variation in African and European populations of
Drosophila melanogaster
Stephan Hutter
¤
, Sarah S Saminadin-Peter
¤
, Wolfgang Stephan and
John Parsch
Address: Section of Evolutionary Biology, Department of Biology, University of Munich, Grosshaderner Strasse, Planegg-Martinsried, 82152, Germany.
¤ These authors contributed equally to this work.
Correspondence: Stephan Hutter. Email: hutter@zi.biologie.uni-muenchen.de
© 2008 Hutter et al.; licensee BioMed Central Ltd.
This is an open access article distributed under the terms of the Creative Commons Attribution License (http://creativecommons.org/licenses/by/2.0), which permits unrestricted use, distribution, and reproduction in any medium, provided the original work is properly cited.
Expression variation in Drosophila
<p>A survey of gene expression variation in 16 <it>Drosophila melanogaster</it> strains from two natural populations reveals traits that were important for local adaptation to the European and African environments.</p>
Abstract
Background: Differences in levels of gene expression among individuals are an important source of phenotypic variation within populations. Recent microarray studies have revealed that expression variation is abundant in many species, including Drosophila melanogaster. However, previous expression surveys in this species generally focused on a small number of laboratory strains established from derived populations. Thus, these studies were not ideal for population genetic analyses.
Results: We surveyed gene expression variation in adult males of 16 D. melanogaster strains from two natural populations, including an ancestral African population and a derived European population. Levels of expression polymorphism were nearly equal in the two populations, but a higher number of differences was detected when comparing strains between populations. Expression variation was greatest for genes associated with few molecular functions or biological processes, as well as those expressed predominantly in males. Our analysis also identified genes that differed in expression level between the European and African populations, which may be candidates for adaptive regulatory evolution. Genes involved in flight musculature and fatty acid metabolism were over-represented in the list of candidates.
Conclusion: Overall, stabilizing selection appears to be the major force governing gene expression variation within populations. However, positive selection may be responsible for much of the between-population expression divergence. The nature of the genes identified to differ in expression between populations may reveal which traits were important for local adaptation to the European and African environments.
Published: 21 January 2008
Genome Biology 2008, 9:R12 (doi:10.1186/gb-2008-9-1-r12)
Received: 13 August 2007 Revised: 9 January 2008 Accepted: 21 January 2008 The electronic version of this article is the complete one and can be
Changes in levels of gene expression can have a large impact on the phenotype of an organism and, thus, provide a rich substrate upon which natural selection can act. Although the importance of gene regulatory changes in adaptive evolution has long been asserted [1], it is only recently that we have begun to uncover the pervasiveness of gene expression poly-morphism in natural populations and its role as a source of adaptive variation within species [2-4]. These advances are largely due to the advent of microarray technologies, which allow for the large-scale investigation of differences in tran-script abundance among individuals. To date, numerous studies have investigated variation in gene expression in nat-ural populations across a broad range of species, including yeast [5-7], fish [8-10] and hominids [11-14].
The fruit fly Drosophila melanogaster has long served as an important model for genetic studies, and is also an important model system for population genetics. Variation at the DNA level in natural populations has been surveyed extensively in microsatellite (for example, [15]) and single nucleotide poly-morphism studies (for example, [16,17]). These studies have confirmed that D. melanogaster originated from an ancestral population in sub-Saharan Africa and only relatively recently expanded to the rest of the world, a scenario suggested by ear-lier studies [18,19]. Current populations residing in the ances-tral species range show a signal of population size expansion [20,21], while derived populations show the signature of a population bottleneck [16,22]. Extensive theoretical studies have estimated the population genetic parameters associated with these demographic events [23,24].
Most surveys of gene expression variation in D. melanogaster
have focused on a small number of laboratory strains derived from non-African populations [25-27]. Thus, they do not offer a complete view of expression variation within the species. They are also of only limited value if one wants to detect the effects of demographic events, such as bottlenecks or range expansion, on levels of gene expression variation within nat-ural populations. An exception is the study of Meiklejohn et al. [28], which investigated gene expression polymorphism in adult males of eight strains of D. melanogaster, including four strains from an ancestral population from Zimbabwe and four non-African (cosmopolitan) lab strains. This study uncovered greater levels of variation than previous studies, presumably due to its inclusion of the ancestral African strains. There were, however, some limitations to this work. For example, the sample size was relatively small, with only four African and four non-African strains. Furthermore, the cosmopolitan sample was not from a single population, but instead was a mixture of North American and Asian labora-tory stocks. Finally, the Meiklejohn et al. study [28] used microarrays designed from an early expressed sequence tag screen of the D. melanogaster genome [29] that covered only 42% of the predicted genes.
expression variation in adult males of sixteen strains from two natural populations of D. melanogaster, including eight strains from Africa (Zimbabwe) and eight strains from Europe (the Netherlands). DNA sequence polymorphism has already been thoroughly characterized in these two popula-tions [16,20,30]. At the level of gene expression, we find nearly equal amounts of variation within the two populations, but higher amounts in between-population comparisons. Genes associated with a small number of biological processes or molecular functions tend to show higher levels of expres-sion polymorphism than those associated with many proc-esses or functions. These observations suggest that stabilizing selection limits the amount of expression variation within populations. We also find that genes with male-biased expression exhibit higher levels of variation than those with female-biased or unbiased expression, which has implica-tions for the chromosomal distribution of expression-variable genes. Finally, our experimental design allows us to detect genes that differ significantly in expression between the Euro-pean and African populations, and thus reveals candidates for genes that have undergone adaptive regulatory evolution accompanying the out-of-Africa range expansion of the species.
Results
Statistical power
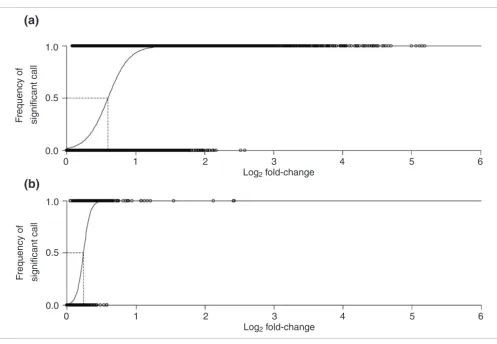
We performed a total of eighty microarray hybridizations, each of which was a head-to-head comparison of two D. mel-anogaster strains (Figure 1). After quality control, 5,048 probes representing 4,512 unique genes had sufficient signal quality to estimate their relative expression level in all 16 strains. This corresponds to approximately 40% of all genes on the array. The complete list of all probes examined in this study is provided as Additional data file 1. The relative expres-sion level of each gene in each strain was estimated using BAGEL (Bayesian Analysis of Gene Expression Levels) [31] and the statistical power of our experiment to detect expres-sion differences between strains was determined by calculat-ing the GEL50 statistic [32] (see Materials and methods). The corresponding plot for our data is shown in Figure 2a. The logistic regression reaches a value of 0.5 at a log2 fold-change of 0.596, which corresponds to a GEL50 of 1.51. In other words, given our experimental design and data quality, there is a 50% chance of detecting a 1.51-fold expression difference as significant at the 5% level. This value compares well with those of similar experiments in fish, yeast, flies, and plants [33], and is slightly better that that of the study of Meiklejohn
et al. [28] (GEL50 = 1.64), which also examined African and non-African Drosophila.
dif-ferences in any of these three comparison schemes is approx-imately equal. This confirms that our experimental design is well balanced and does not have any biases in detecting dif-ferential expression within or between populations.
Total number of differentially expressed genes
Since the number of tests for pairwise differences in expres-sion was extremely high (5,048 probes × 120 pairwise comparisons = 605,760 tests), we could not operate with the conventional 5% significance level due to the problem of mul-tiple testing. We therefore created randomized data sets to estimate the false discovery rate (FDR) at any given signifi-cance level (Table 1, 16-node experiment). For all further analyses, we use a P-value cut-off of 0.001, which corre-sponds to a FDR of 6.9% and is similar to the FDR of 5.2% used in the study of Meiklejohn et al. [28].
Using this cut-off, we found that 1,894 (37.5%) of the probes showed significant differences for at least one pairwise com-parison (Table 2), which was slightly lower than the propor-tion (46.7%) reported by Meiklejohn et al. [28]. Since 413 genes were represented by multiple probes in our data set, we checked how well the percentage of polymorphic genes corre-sponded to the number of polymorphic probes. If a gene was considered polymorphic when at least one of its probes showed a significant pairwise difference between strains, then 38.9% of all expressed genes were polymorphic. If a stricter criterion was applied and only genes for which all
probes showed a significant difference were considered poly-morphic, this dropped to 35.1%. The overall effect of includ-ing multiple probes per gene was rather small. Unless noted otherwise, we present the results on a 'per-probe' basis throughout this paper.
A total of 964 probes (19.1%) showed differences within the European population, 1,039 (20.6%) showed differences within the African population, and 1,600 (31.7%) showed dif-ferences when comparing European to African strains (inter-population comparisons). The higher number of differences for the inter-population comparisons was somewhat expected, since there were more pairwise tests than for the within-population comparisons (64 as opposed to 28).
Expression differences between individual strains
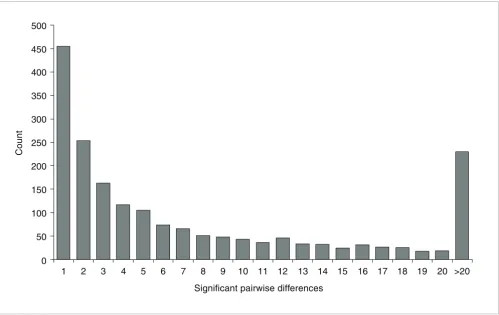
We also investigated the number of differentially expressed probes for each pairwise comparison. The complete pairwise comparison matrix is provided as Additional data file 2. On average, 138 probes showed differential expression for each individual pairwise comparison (Table 2). Given the overall number of 1,894 probes that showed differences, this number was surprisingly small, even more so when taking into account that the Meiklejohn et al. study [28] detected an average of 498 differentially expressed genes per pairwise comparison with a total number of 2,289 differentially expressed genes. This reveals that, in our data set, there is not much overlap in the lists of differentially expressed genes for the 120 pairwise comparisons. This effect is also visible when comparing the number of pairwise differences detected for each probe. The histogram (Figure 3) shows that a large frac-tion of probes show significant differences only for 1 or 2 out of the 120 pairwise comparisons.
Expanding this approach to investigate differences within and between populations, we see a pattern resembling that for the total number of differentially expressed probes. On average, comparisons between two European strains showed differences in 126.5 probes, comparisons between two Afri-can strains showed differences in 125.9 probes, and compari-sons between a European and an African strain showed differences in 148.4 probes (Table 2). Since these numbers are independent from the number of pairwise comparisons, we conclude that there is an excess of differentially expressed probes in the inter-population comparisons (Mann-Whitney
U test, P = 0.019).
To examine expression variation on a gene-by-gene basis, we determined the percentage of significant pairwise differences per probe. In general, this measure of variation followed the pattern seen for the number of differentially expressed genes within the European and African populations presented above (Table 2). The level of expression polymorphism was similar within the African (2.49%) and European (2.51%) populations and a Mann-Whitney U test of the two popula-tions was not significant (P = 0.086). The
[image:3.612.55.296.86.332.2]between-popula-Experimental design Figure 1
Experimental design. Each circle represents a different D. melanogaster strain, with 'E' indicating strains from Europe and 'A' strains from Africa. Gray arrows represent hybridizations performed within populations; black arrows represent hybridizations between populations. Arrows facing in opposite directions represent the dye-swap replicates.
E01
E12
E14
E15
E16
E17
E18
E20 A84
A186 A95
A82 A398
A384 A377
A131
E01
E12
E14
E15
E16
E17
E18
tion comparisons showed a larger proportion of significant tests (2.94%) and this was significantly larger than the within-population polymorphism (Mann-Whitney U test, P < 0.001).
The magnitude of expression differences and confirmation by quantitative real-time PCR
In addition to the number of probes that showed differential expression, we also investigated the magnitude of these dif-ferences. Of the 605,760 pairwise tests for expression differ-ences, a total of 16,564 were significant at the 0.001 level (Table 1). Figure 4 shows a histogram of the relative fold-changes of these differences. The median fold-change of sig-nificant differences was 1.74. The smallest difference that was detected as significant was a fold-change of 1.11, the largest was over 36-fold. As can be seen in Figure 4, the majority of changes were relatively small, falling between 1.2 and 2-fold. To validate the expression differences detected by microarray analysis, we performed quantitative real-time PCR (qPCR) on 12 genes across a total of 966 pairwise comparisons of strains (Additional data file 3). Overall, we observed a strong correla-tion between the microarray and qPCR results (Figure 5), indicating that the microarrays provide a reliable estimate of
the direction and magnitude of gene expression differences between strains.
Expression polymorphism of X-linked and autosomal genes
We compared the levels of polymorphism for genes residing on the X chromosome to those located on the autosomes and found a systematic difference between these two classes. Lev-els of expression polymorphism were consistently lower for X-linked genes, irrespective of whether they were measured within or between populations or in the complete data set. Variability on the X chromosome was only about 70% of that on the autosomes when measured as percentage of pairwise differences per probe, and this dearth of polymorphism was statistically significant for all four comparison schemes (Table 3). The same trend was found when using the percent-age of polymorphic probes as a statistic, yet the differences between chromosomal classes were not as pronounced (Table 3).
Expression polymorphism of sex-biased genes
To investigate the contribution of genes with sex-biased expression to overall levels of gene expression variation, we
Logistic regression of the probability of detecting significant gene expression differences at the P < 0.05 level using BAGEL for (a) the quality controlled
[image:4.612.57.554.80.423.2]16-node experiment and (b) the quality controlled 2-node experiment
Figure 2
Logistic regression of the probability of detecting significant gene expression differences at the P < 0.05 level using BAGEL for (a) the quality controlled 16-node experiment and (b) the quality controlled 2-node experiment. The dashed line defines the GEL50 value on a log2 scale.
(a)
(b)
1.0
0.5
0.0 0
significant call
F
requency of
Log2 fold-change
6 5
4 3
2 1
1.0
0.5
0.0 0
Log2 fold-change
6 5
4 3
2 1
significant call
F
used the consensus results of three independent experiments that directly compared male versus female gene expression in
D. melanogaster [27,34,35] and two different criteria for the classification of sex-biased genes, one based on fold-change and one based on statistical significance [36]. We detected the highest fraction of expressed genes within the male-biased class and the lowest fraction within the female-biased class (Table 4). This is expected, since adult male flies were used as the RNA source for all of our experiments. Meiklejohn et al. [28] reported that, when assayed in adult males, genes with male-biased expression were significantly more variable than genes with female-biased or unbiased expression. We observed the same pattern for the genes in our data set: male-biased genes were consistently more variable than genes of the other two classes, and this pattern held for both the Euro-pean and African populations (Table 4). Female-biased genes tended to have the least expression variation (Table 4). This low variation cannot be explained simply by the lack of expression of the female-biased genes in adult males, because only genes with detectable expression were used in the analysis.
The effect of gene function on expression polymorphism
For a sizable fraction of our data set, the biological processes and/or molecular functions of the genes were (at least par-tially) known. Of the 5,048 expressed probes, 3,217 were
assigned to biological processes, and 3,275 had at least one known molecular function. Some of the probes were associ-ated with more than one Gene Ontology (GO) term, with the extremes being Egrf (62 biological processes) and ninaC (11 molecular functions). To test whether the number of different processes or functions had an influence on gene expression diversity, we examined the number of GO terms associated with probes that were either polymorphic or monomorphic in expression (Figure 6). There was a relative excess of polymor-phic probes associated with a low number of biological proc-esses (three or less) and a paucity associated with four or more processes (Figure 6a). A Mann-Whitney U test con-firmed that polymorphic probes were associated with fewer GO terms than monomorphic probes (P < 0.001). A similar pattern was seen for molecular functions (Figure 6b), where polymorphic probes were associated with fewer molecular functions than monomorphic probes (Mann-Whitney U test,
P < 0.001).
Expression differences between populations
In order to find genes that differ in expression on a population scale (and are therefore candidates for local adaptation), we pooled all strains of each population into a single node and then used the software BAGEL to find differences between the African and the European nodes (see Materials and methods). With this approach, BAGEL estimates the average expression level for each population and tests for significant
Table 1
Number of significant tests and FDRs for different P-value cut-offs
16-node experiment Two-node experiment
P-value Significant tests FDR Significant tests FDR
0.05 110,285 (18.21%) 0.4906 991 (19.47%) 0.4834
0.02 63,636 (10.51%) 0.3285 562 (11.04%) 0.3292
0.01 44,081 (7.28%) 0.2337 380 (7.47%) 0.2237
0.005 31,670 (5.23%) 0.1657 269 (5.29%) 0.1710
0.002 21,480 (3.55%) 0.1024 161 (3.16%) 0.0870
0.001 16,564 (2.73%) 0.0692 109 (2.14%) 0.0550
Table 2
Expression polymorphism by population
Polymorphic probes Mean pairwise differences per
probe in %†
Total number (%) Mean per PW (SD)*
Overall 1,894 (37.5%) 138.0 (53.0) 2.73
Europe 964 (19.1%) 126.5 (43.7) 2.51
Africa 1,039 (20.6%) 125.9 (47.8) 2.49
Between 1,600 (31.7%) 148.4 (57.3) 2.94
*Average number and standard deviation (SD) of probes found to be differentially expressed for each pairwise (PW) comparison between all strains within the corresponding data set.
differences. Since the polymorphism within a population will affect the variance of this estimate, only those differences will be detected as significant where the within-population varia-tion is small compared to the between-populavaria-tion difference. This new comparison scheme should be much more powerful to detect differences since it has only two nodes to compare with 20 hybridizations. As an additional quality control step, we required that each probe be detected as 'expressed' (see Materials and methods) in at least 9 of the 20 hybridizations. A total of 5,089 probes representing 4,528 genes passed the quality control. The GEL50 for this design was 1.18 (Figure 2b), which, as expected, was lower (that is, better) than in the original 16-node analysis.
As with the first analysis, we used a randomized data set to calculate the FDR and adjust our P-value for differential expression (Table 1, two-node experiment). We chose a P -value cut-off of 0.002, which leads to an FDR of 8.7% and cor-responds well to the FDR of the 16-node experiment (6.9%). At this significance level, 161 probes representing 153 genes were differentially expressed between the European and Afri-can populations. A complete list of these probes is provided as Additional data file 4. Again, the magnitude of expression ferences was relatively low, with the median fold-change dif-ference being 1.32 and the maximum being 5.36. We used
qPCR to verify the between-population expression differ-ences for six genes, including two significantly expressed in the European population, two significantly over-expressed in the African population, and two with no signifi-cant difference between the populations (Table 5). The qPCR results confirmed those of our microarrays for the differen-tially expressed genes. One of the control genes was detected as having significantly higher expression (at the 5% level) in the African strains by qPCR (Table 5). This may be attributa-ble to increased sensitivity of the qPCR method. However, it should be noted that no multiple-test correction was applied in the qPCR analysis and that this gene is no longer significant after correction for multiple tests.
Of the 161 differentially expressed probes, 85 (52.8%) were expressed at a higher level in the African population and 76 (47.2%) were expressed at a higher level in the European population, but this difference was not significant (Fisher's exact test, P = 0.26). A comparison on a per-gene basis showed a similar pattern: 80 genes were over-expressed in the African population and 73 in the European population (Fisher's exact test, P = 0.25). The magnitude of the expres-sion difference was larger for probes over-expressed in the African population (median fold-change = 1.35) than for probes over-expressed in the European population (median
[image:6.612.56.555.86.401.2]Histogram of the number of significant pairwise differences (P < 0.001) for all expressed probes
Figure 3
Histogram of the number of significant pairwise differences (P < 0.001) for all expressed probes. 0
50 100 150 200 250 300 350 400 450 500
1 2 3 4 5 6 7 8 9 10 11 12 13 14 15 16 17 18 19 20 >20
Significant pairwise differences
fold-change = 1.27) and this difference was significant (Mann-Whitney U test, P = 0.044). Neither the X chromo-some nor the autochromo-somes were enriched for these probes (Fisher's exact test, P = 0.83). There was also no enrichment of sex-biased genes. If anything, sex-biased genes were under-represented among those showing expression differ-ences between the populations (Table 4).
Functional analysis of candidate genes
Some GO categories were significantly over-represented among the 153 genes with expression differences between populations (Table 6). Furthermore, for some categories the expression differences were biased towards a certain direction. For example, the genes associated with the actin cytoskeleton were all over-expressed in the African popula-tion. The GO categories 'actin filament' and 'structural constituent of cytoskeleton' were also exclusively composed of these genes. Interestingly, other genes involved in the for-mation of Drosophila muscles were also over-expressed in the African population, including those encoding myosins, troponins, tropomyosins, and the gene Zeelin1. In contrast, we saw the opposite pattern for genes involved in fatty acid metabolism. Here all genes had a higher level of expression in the European population. These genes also form the GO cate-gory 'monocarboxylic acid metabolic process' together with the gene Pgd, but this gene showed over-expression in the
African population. Information on which genes belong to one of the over-represented categories is provided in Addi-tional data file 4.
Discussion
Patterns of gene expression polymorphism
Our survey of gene expression variation is the largest per-formed to date in D. melanogaster and the first to include a truly natural, derived population. In combination with the ancestral African population, this provides a comprehensive picture of expression variability in the species. However, it should be noted that the amount of expression variation detected among inbred strains may differ from that in natural populations for several reasons. First, inbred strains are expected to be homozygous over a large proportion of the genome and, thus, the effects of dominance on gene expression will not be detected [27]. Second, the process of inbreeding itself may act like an environmental stress and lead to changes in the expression of genes involved in metab-olism and stress resistance [37]. Third, mutations that alter levels of gene expression may accumulate in inbred strains during the time that they are maintained in the laboratory [26]. Finally, since all strains were reared in a common labo-ratory environment, it is not possible to detect genotype-by-environment interactions that affect gene expression. While
Histogram of the fold-changes in expression for comparisons significant at the P < 0.001 level
Figure 4
Histogram of the fold-changes in expression for comparisons significant at the P < 0.001 level. 0
200 400 600 800 1,000 1,200 1,400 1,600 1,800 2,000
1.1 1.3 1.5 1.7 1.9 2.1 2.3 2.5 2.7 2.9 3.1 3.3 3.5 3.7 3.9 4.1 4.3 4.5 4.7 4.9 >5
Fold-change
Co
u
n
the above limitations are inherent to this type of microarray study, we expect the general patterns of gene expression pol-ymorphism observed among inbred strains to be robust to
populations.
One pattern we observed was that the amount of expression variation did not differ between the European and the African populations (Table 2). This might seem somewhat surprising, since large-scale genome scans have shown that the African population harbors much more variation (over twice as much) at the DNA level than the European population (for example, [20]), an observation that is consistent with the inferred demographic history of these populations and with the African population having a larger effective size [24,30]. However, the DNA polymorphism studied in such genome scans consists mainly of non-coding single nucleotide poly-morphisms, which are thought to evolve (nearly) neutrally. While some authors suggest that differences in gene expres-sion also reflect changes that are selectively neutral [38], more recent studies provide evidence that this is not the case (for example, [39]). Regulatory changes have a direct impact on the phenotype and might affect the fitness of the organism. Most of these changes will have a deleterious effect and the levels of gene expression should, therefore, be under stabiliz-ing selection. Thus, the patterns of expression polymorphism that we observe could be explained by a mutation-selection balance model, where mutations affecting expression level are mostly deleterious and are quickly purged from the popu-lation. In such a case, the observable variation depends on the mutation rate and the selection coefficient against deleterious mutations (which should be equal in both of our studied pop-ulations), and is independent of the population size [40]. Evi-dence that stabilizing selection is a key factor governing expression variation has already been found in several stud-ies. For example, mutation accumulation experiments in
Caenorhabditis elegans [41] and D. melanogaster [42] have shown that spontaneous mutations are able to create
[image:8.612.55.296.85.392.2]abun-Correlation between fold-change differences in expression measured by microarray and qPCR
Figure 5
Correlation between fold-change differences in expression measured by microarray and qPCR. Data are from 966 pairwise comparisons of lines across 12 different genes (Pearson's R = 0.7, P < 0.0001).
-8 -6 -4 -2 0 2 4 6 8
-6 -4 -2 0 2 4 6
Log2 array fold-change 2
fold-change
Table 3
Expression polymorphism on the X chromosome and autosomes
X chromosome Autosomes X/A ratio*
Number and percentage of polymorphic probes
Overall 335 (35.8%) 1,559 (37.9%) 0.945 (P = 0.22)
Europe 155 (16.5%) 809 (19.7%) 0.838 (P = 0.027)
Africa 168 (17.9%) 871 (21.2%) 0.844 (P = 0.025)
Between 277 (29.6%) 1,323 (32.2%) 0.919 (P = 0.12)
Average percentage of pairwise differences
Overall 2.02 2.90 0.697 (P = 0.040)
Europe 1.77 2.68 0.661 (P = 0.014)
Africa 1.86 2.64 0.705 (P = 0.017)
Between 2.20 3.11 0.708 (P = 0.035)
[image:8.612.53.563.540.705.2]dant variation in gene expression. However, when comparing the levels of expression variation in mutation accumulation lines to the levels found in natural isolates, it can be seen that variation in natural populations is significantly lower [41]. Additionally, expression divergence between closely related species was much lower than expected under a neutral model [42]. These results suggest that stabilizing selection plays a dominant role in shaping gene expression variation within species, as well as expression divergence between species.
We observed a higher number of expression differences between populations than within populations, and this result was consistent regardless of the statistic used to quantify expression polymorphism (Table 2). This increased inter-population expression divergence is likely a consequence of population differentiation since the colonization of Europe approximately 16,000 years ago [24,30]. Some of this expres-sion divergence may reflect adaptation to the temperate envi-ronment, which would result in genes that show relatively low expression polymorphism within populations, but high expression divergence between populations (discussed below). Nevertheless, the number of genes showing popula-tion-specific expression patterns was relatively low compared to overall levels of expression polymorphism. The two-node analysis revealed that only 161 probes had expression levels that were population specific (approximately 3% of all expressed probes). In contrast, 37.5% of all expressed probes showed expression differences between at least two strains in the 16-node experiment. Consequently, distance trees based on gene expression differences had less power to group the strains by population than those based on DNA sequence dif-ferences (Additional data file 5).
In both populations, X-linked genes showed consistently less expression polymorphism than autosomal genes (Table 3). This appears to be a result of the unequal genomic distribu-tion of sex-biased genes. Previous studies have shown that male-biased genes are significantly under-represented on the X chromosome [34,35] and also show the highest levels of expression polymorphism [28]. These results are confirmed in our data. Only 9% of the male-biased genes detected as expressed are X-linked; the corresponding proportions for female-biased and unbiased genes are 23% and 17%, respec-tively. Additionally, we find that male-biased genes show the highest levels of gene expression polymorphism (Table 4). Thus, the reduced expression polymorphism on the X chro-mosome could be explained by its paucity of male-biased genes. The slight over-abundance of female-biased genes, which show the least expression polymorphism, on the X chromosome may also contribute to this pattern. Indeed, when only genes with unbiased expression are examined, there is no reduction in X-linked expression diversity relative to the autosomes (Additional data file 6).
Effects of gene function
We examined if functional diversity had any influence on gene expression polymorphism by comparing the number of GO terms associated with monomorphic and polymorphic genes. There are some caveats to this approach. Since GO terms are organized in a hierarchical and network-like fashion, the GO counts do not necessarily correlate in a linear fashion with the functional diversity of a gene. Additionally, the characterization of the gene functions for all genes in the
[image:9.612.55.559.119.325.2]D. melanogaster genome is far from being complete. How-ever, these problems should affect both monomorphic and
Table 4
Expression variation in sex-biased genes
Two-fold FDR10%
Sex-bias classification* Male Female Unbiased Male Female Unbiased
Number of genes on array 669 768 3,891 1,228 857 1,534
Percentage of genes detected as expressed 61† 22 41 67† 33 41
Percentage of expressed genes
Variable in Europe 20‡ 12 16 22† 13 15
Variable in Africa 28† 15 16 27† 16 17
Variable overall 42† 32 31 45† 31 32
Differentially expressed between populations 1.21§ 2.86 3.54 2.46 1.75 3.10
Average percentage of pairwise differences
Within Europe 2.50† 1.14 2.07 2.93† 1.50 1.82
Within Africa 3.96† 1.08 1.75 3.57† 1.32 1.75
Overall 3.16† 1.09 2.21 3.35† 1.50 2.00
Histogram of the number of unique GO terms associated with monomorphic probes (white) and polymorphic probes (gray) Figure 6
Histogram of the number of unique GO terms associated with monomorphic probes (white) and polymorphic probes (gray). (a) GO terms related to biological processes; (b) GO terms related to molecular functions.
0 0.05 0.1 0.15 0.2 0.25 0.3 0.35 0.4 0.45
1 2 3 4 5 6 7 8 9 10 11
Unique molecular function GO terms
Frequency
M onom orph P olym orph 0
0.05 0.1 0.15 0.2 0.25 0.3 0.35 0.4 0.45
1 2 3 4 5 6 7 8 9 10 11 12 13 14 15 16 17 18 19 20 >20 Unique biological process GO terms
Frequency
M onom orph P olym orph
(a)
polymorphic genes equally. Thus, we expect any differences between these two groups to have biological relevance.
We find that genes varying in expression among strains tend to be associated with fewer GO terms than those that are monomorphic in expression. This pattern holds for both the number of biological processes and the number of molecular functions that are associated with a gene (Figure 6). A plausi-ble explanation for this is that genes involved in multiple processes or functions are under greater selective constraint to maintain an optimal level of gene expression, because mutations that alter their expression may have deleterious, pleiotropic effects in a greater number of biological pathways. In this respect, our findings mirror previous findings on the relationship between expression variation and number of protein-protein interactions [43,44], which further reinforces our view that stabilizing selection is the dominant force shap-ing levels of gene expression polymorphism in natural populations.
Candidate genes for adaptation
[image:11.612.54.553.119.220.2]To identify genes that are differentially expressed between the European and African populations, we employed a two-node analysis (see Materials and methods), in which all strains from each population were grouped into a single node. An interesting finding was that genes encoding proteins involved in muscle formation were consistently over-expressed in the African population. Two of these genes (Act88F and TpnC41C) encode proteins that are predomi-nately found in the indirect flight musculature [45,46]. This might be related to differences in the ratio of wing-size/body-size between African and European flies. It is known that D. melanogaster populations living close to the equator have smaller wings relative to their body-size than flies inhabiting higher latitudes [47]. It has also been shown that flies that have a small wing area relative to their body size have higher frequencies of wing-beat to overcome the small lift provided by their wings [48]. We therefore hypothesize that the higher expression levels of muscle genes enables African flies to
Table 5
Comparison of quantitative PCR and microarray measurements of gene expression differences between populations
Gene qPCR E/A Microarray E/A
Cyp6g1 3.26 (P = 0.0008) 2.12 (P < 0.0001)
CG9509 0.99 (P = 0.003) 1.21 (P < 0.0001)
CG7214 -2.61 (P = 0.002) -2.42 (P < 0.0001)
CG7203 -1.57 (P = 0.005) -2.41 (P < 0.0001)
Nap1 -0.46 (P = 0.02) 0.03 (P = 0.35)
CG15295 0.26 (P = 0.60) 0.14 (P = 0.17)
Values represent the log2 of the mean fold-change difference in expression between the European (E) and African (A) populations as determined by qPCR or microarray. P-values for the qPCR were determined by Mann-Whitney U tests, and P-values for the microarray experiment were determined by BAGEL.
Table 6
GO categories over-represented in the list of genes expressed differentially between populations
GO number GO term Genes in genome Genes in list P-value
Biological process
GO:0005975 Carbohydrate metabolic process 347 14 7.34E-05
GO:0032787 Monocarboxylic acid metabolic process 48 6 2.24E-05
GO:0006631 Fatty acid metabolic process 38 5 8.67E-05
Molecular function
GO:0016491 Oxidoreductase activity 523 20 4.07E-06
GO:0004448 Isocitrate dehydrogenase activity 4 3 6.83E-06
GO:0005200 Structural constituent of cytoskeleton 12 4 9.34E-06
Cellular component
GO:0015629 Actin cytoskeleton 47 8 7.68E-08
[image:11.612.53.557.307.505.2]muscle-related genes could be the result of direct selection on their expression, but could also be a downstream effect of selection for increased number or size of muscle cells in Afri-can flies. In this context, it is noteworthy that the gene
CG7214, which has the largest magnitude of over-expression in the African population (5.36-fold), is expressed during wing morphogenesis [49], although its exact function remains unknown. Direct measurements of relative wing sizes, wing-beat frequencies, and number and size of muscle cells in our surveyed populations will provide insight into the phenotypes associated with these gene expression differ-ences. The abundance of highly differentially expressed mus-cle-related genes in our list might also be the reason why there seems to be more extreme over-expression in the Afri-can population.
Genes associated with fatty acid metabolism showed consist-ent over-expression in the European population. The fat body of Drosophila plays an important role in the detoxification of xenobiotics and the defense response to microbial infections and can be viewed as the functional equivalent of the mammalian liver [50,51]. A study comparing the expression profile of dichloro-diphenyl-trichloroethane (DDT)-resistant and DDT-sensitive strains of D. melanogaster revealed dif-ferences in the expression levels of lipid metabolism genes between these strains [52]. The malic enzyme gene (Men), which shows 1.76-fold over-expression in the European pop-ulation, is of particular interest in this context. This enzyme oxidizes malate to pyruvate and concurrently reduces NADP to NADPH, which is a major reductant in lipid biosynthesis [53]. A study of DNA polymorphism and enzymatic activity of naturally occurring alleles of Men revealed clear differences between African and non-African populations [54]. The allelic state of this gene influences not only the abundance of triglycerides in flies, but also the activity of isocitrate dehy-drogenase (Idh). We find that expression levels of Idh also differ between European and African flies (represented by two probes, showing 1.24-fold and 1.18-fold over-expression in European flies), indicating that not only DNA polymorphism, but also variation in expression plays a role in the interaction of these two genes. A classic example of expression differences leading to adaptive phenotypes is the cytochrome P450 gene Cyp6g1. It has been shown that over-expression of this gene leads to increased DDT resistance [55]. In our microarray data set, this gene shows the largest magnitude of over-expression in the European population (4.35-fold). We confirmed this pattern by qPCR and found that the actual level of over-expression might even be as high as ten-fold (Table 5). The consistent pattern of higher expres-sion levels in European flies for the above genes provides evi-dence that the acquisition of resistance against insecticides, such as DDT, is an important adaptive trait for flies living in the European habitat.
Experimental design
Flies were from the European (the Netherlands) and African (Zimbabwe) populations described in Glinka et al. [20]. The eight highly inbred strains per population used for the study were randomly chosen. The flies were reared on standard cornmeal-molasses medium at 22°C and a 15 h-9 h light-dark cycle.
The platform used was a genome-wide D. melanogaster
microarray obtained from the Drosophila Genomics Resource Center (DGRC; Bloomington, IN, USA) known as DGRC-1. This microarray consists of 13,921 exonic PCR amplicons (100-600 bp in length) representing 11,895 unique genes, which is equivalent to 88% of the genome (based on genome annotation 4.1). Since these probes were designed to an earlier annotation of the genome (namely 3.1), some genes are not represented on the array according to updated anno-tations, while others are represented by more than one probe.
To assess the amount of expression differentiation between any given pair of strains, we developed a hybridization scheme that allowed us to compare all strains while keeping the total number of hybridizations practical (Figure 1). The starting point was a loop design with cross connections that joined strains within each of the two populations (gray arrows in Figure 1). To connect the two loops and allow for compari-sons between populations, inter-population hybridizations were performed (black arrows in Figure 1). Each pairwise comparison included a dye swap. This culminated in a total of 30 hybridizations within each population and 20 hybridiza-tions between populahybridiza-tions.
RNA extraction and hybridization
RNA was extracted from 70-75 adult males that were 4-6 days of age using the DGRC protocol [56]. Reverse transcription and labeling were performed with the SuperScript Plus Indi-rect cDNA Labeling System and Alexa Fluor 555 and 647 dyes (Invitrogen, Carlsbad, CA, USA). RNA from the same extrac-tion was used for the dye-swap replicates. Otherwise, RNA was extracted from a new cohort of flies for each pairwise comparison of strains. Hybridizations were performed fol-lowing DGRC protocols and arrays were scanned using an aQuire microarray scanner (Genetix, New Milton, UK). All array data have been submitted to the Gene Expression Omnibus database [57] under accession numbers GSM219761-GSM219840 (platform GPL3830, series GSE8843).
Normalization of raw data
we used the 'minimum', 'printtiploess', and 'quantile' options, respectively. Between-array normalization was performed using the dye-swap replicates for each pairwise comparison of strains.
Data analysis, quality control and statistical power
The normalized expression ratios for each slide were used as input for BAGEL [31]. This program uses a Markov Chain Monte Carlo algorithm to estimate the relative expression lev-els of all strains for any given gene. Furthermore, the proba-bility of a gene being differentially expressed between any two strains in the data set is computed.
As a means of quality control, we removed spots that did not show a significant signal of expression, which was determined on a per-slide basis using negative control probes included on the DGRC-1 arrays. Negative controls were defined as the 182 spots on the array consisting of exogenic DNA (for example, genes amplified from yeast or Escherichia coli). For each array, the distribution of the signals above background for these negative controls was determined separately for each channel. Subsequently, the signal intensity in each channel for each spot representing a gene was compared to the nega-tive distribution. If the signal of a spot fell within the upper 5% of the negative distribution in each channel, the gene was considered 'expressed'. If a spot presented a signal that was lower than this threshold in either of the two channels, then it was considered 'non-expressed' and was excluded from fur-ther analysis.
To determine the experiment-wide FDR, we repeated the BAGEL analysis on a randomized version of our final data set. Randomization was performed on the input file by sampling with replacement within each hybridization (that is, rand-omizing within a column), thereby maintaining the underly-ing data structure (for example, missunderly-ing data) within each hybridization. Random sampling was carried out until a total of 5,048 randomized probes were generated, which corre-sponds to the total number of expressed probes in the original data set. This allowed for an easy and direct comparison of observed and randomized data.
To estimate the power of our experiment to detect expression differences between strains, we calculated the GEL50 statistic, which has been proposed as a standard measure to compare studies of expression variation across different experiments and platforms [32]. The GEL50 is defined as the expression difference at which there is a 50% chance of detecting signifi-cance at the 5% level. To obtain this statistic, all pairwise com-parisons of differential gene expression are assigned a value of one if they are significant or zero if they are non-significant. These zeros and ones are then plotted on a graph as a function of the expression difference (that is, the fold-change) between the two samples (on a log2 scale). Afterwards, a logistic func-tion is fitted through the data points and the GEL50 is defined as the fold-change at which the logistic function reaches 0.5.
Detection of differentially expressed genes between populations
To identify genes that differ in expression between the Afri-can and the European populations, we repeated the BAGEL analysis using only hybridizations in which an African strain was compared directly to a European strain. This resulted in a total of 20 hybridizations (black arrows in Figure 1). All Afri-can strains were combined into a single node named 'Africa' and all European strains where combined into a node named 'Europe'. With this approach, the different strains used within each population can be considered as biological replicates. To determine the FDR, a randomized data set was created by permuting the expression ratios of the replicate hybridiza-tions within each gene (that is, randomizing within a row). This has the effect of randomly assigning the ratio of each hybridization as either Europe/Africa or Africa/Europe. It ensures that the proportion of missing data remains constant in the overall data set as well as within each gene, leading to equal distributions of missing data per gene in the observed and the randomized data sets. Furthermore, the randomized data set automatically contained 5,089 randomized probes that could be directly compared to the observed data. Addi-tionally, we created a randomized data set using the approach of the 16-node experiment (see above) for comparison. Both methods produced very similar results (data not shown) and the first approach was used for our analysis.
Quantitative real-time PCR
To validate the gene expression differences between strains and populations detected by our microarray analyses, we per-formed quantitative real-time PCR on a subset of genes. This included genes that showed a high number of significant expression differences within Europe (CG18180 and
CG8997), within Africa (CG15281 and CG5791), or in the combined sample (Cyp6a2 and CG18179). In addition, we included genes showing significant expression differences between the two populations, including two with higher expression in Europe (Cyp6g1 and CG9509) and two with higher expression in Africa (CG7214 and CG7203). Finally, we included two control genes that did not show any signifi-cant expression differences within or between populations (Nap1 and CG15295).
(Dm02151827_g1) as an endogenous control. For this, a ΔCt value was calculated by subtracting the control Ct value from the target Ct value. The fold-change, which represents the difference in expression between two samples (ΔCt1 and
ΔCt2), was calculated as 2-(ΔCt1-ΔCt2). For comparisons between
the European and African populations, ΔCt values were aver-aged within each population and the African value was used as ΔCt2 for fold-change calculation.
Gene ontology
A list of all GO terms describing molecular functions and bio-logical processes associated with the probes on the microar-rays was downloaded directly from the DGRC website [56]. Of the 13,921 probes representing a gene, at least one biological process was known for 8,251 and at least one molecular func-tion was annotated for 8,523. We calculated the number of unique GO terms describing molecular functions and biological processes associated with each probe to get an esti-mate of its 'functional diversity'.
To test if a functional category was over-represented in our list of differentially expressed genes, we used the web-based tool g:Profiler [60]. This tool introduces a new correction for multiple testing (called g:SCS) that takes the hierarchical nature of GO terms into account.
Abbreviations
BAGEL, Bayesian Analysis of Gene Expression Levels; DDT, dichloro-diphenyl-trichloroethane; DGRC, Drosophila Genomics Resource Center; FDR, false discovery rate; GO, gene ontology; qPCR, quantitative real-time PCR.
Authors' contributions
The study was conceived and designed by SH, SSS, WS and JP. The microarray experiments were performed by SH and SSS, and the quantitative real-time PCR experiments were carried out by SSS. The microarray data were analyzed by SH and JP, and the quantitative real-time PCR data were ana-lyzed by SSS. The manuscript was written by SH, SSS and JP with input from WS. All authors have read and approved the final manuscript.
Additional data files
The following additional data are available. Additional data file 1 is a table listing all probes that were found to be expressed in the 16-node experiment along with the relative expression levels for each strain and the P-values for each pairwise comparison as calculated by BAGEL. Additional data file 2 is a table showing the number of differentially expressed probes for each of the 120 pairwise comparisons between strains at the P < 0.001 significance level, as well as the random expectations. Additional data file 3 is a table
surveyed. Additional data file 4 is a table listing all probes showing differential expression between Europe and Africa on a population level as detected by the two-node experiment, including relative expression levels, P-values and over-repre-sented GO categories. Additional data file 5 is a figure com-paring neighbor-joining trees of the 16 strains created using DNA polymorphism data and the gene expression distance matrix. Additional data file 6 is a table comparing the variability of non sex-biased genes between the X chromo-some and the autochromo-somes.
Additional data file 1
Probes expressed in the 16-node experiment and the relative expression levels for each strain and the P-values for each pairwise comparison as calculated by BAGEL
Probes expressed in the 16-node experiment and the relative expression levels for each strain and the P-values for each pairwise comparison as calculated by BAGEL.
Click here for file Additional data file 2
Number of differentially expressed probes for each of the 120 pair-wise comparisons between strains at the P < 0.001 significance level, as well as the random expectations
Number of differentially expressed probes for each of the 120 pair-wise comparisons between strains at the P < 0.001 significance level, as well as the random expectations.
Click here for file Additional data file 3
ΔCt values obtained by qPCR for the 12 genes surveyed
ΔCt values obtained by qPCR for the 12 genes surveyed. Click here for file
Additional data file 4
Probes showing differential expression between Europe and Africa on a population level as detected by the two-node experiment The table includes relative expression levels, P-values and over-represented GO categories.
Click here for file Additional data file 5
Comparison of the neighbor-joining trees of the 16 strains created using DNA polymorphism data and the gene expression distance matrix
Comparison of the neighbor-joining trees of the 16 strains created using DNA polymorphism data and the gene expression distance matrix.
Click here for file Additional data file 6
Comparison of the variability of non sex-biased genes between the X chromosome and the autosomes
Comparison of the variability of non sex-biased genes between the X chromosome and the autosomes.
Click here for file
Acknowledgements
We thank Jeff Townsend for helpful comments on how to conceive the experiment and interpret the data, and John Baines and Nicolas Svetec for lively discussions throughout the course of the study. We also thank Bea Stiening for her excellent technical assistance. Special thanks go out to Anna Bauer-Mehren and Annahita Oswald for their help with normalizing and processing our microarray data and Robert Piskol for helping out with the spot finding. This work was supported by grants from the Deutsche Forsc-hungsgemeinschaft and the Volkswagen-Foundation.
References
1. King MC, Wilson AC: Evolution at two levels in humans and chimpanzees. Science 1975, 188:107-116.
2. Wray GA, Hahn MW, Abouheif E, Balhoff JP, Pizer M, Rockman MV, Romano LA: The evolution of transcriptional regulation in eukaryotes. Mol Biol Evol 2003, 20:1377-1419.
3. Whitehead A, Crawford DL: Variation within and among spe-cies in gene expression: raw material for evolution. Mol Ecol 2006, 15:1197-1211.
4. Wray GA: The evolutionary significance of cis-regulatory mutations. Nat Rev Genet 2007, 8:206-216.
5. Cavalieri D, Townsend JP, Hartl DL: Manifold anomalies in gene expression in a vineyard isolate of Saccharomyces cerevisiae revealed by DNA microarray analysis. Proc Natl Acad Sci USA 2000, 97:12369-12374.
6. Townsend JP, Cavalieri D, Hartl DL: Population genetic variation in genome-wide gene expression. Mol Biol Evol 2003, 20:955-963.
7. Fay JC, McCullough HL, Sniegowski PD, Eisen MB: Population genetic variation in gene expression is associated with phe-notypic variation in Saccharomyces cerevisiae. Genome Biol 2004, 5:R26.
8. Oleksiak MF, Churchill GA, Crawford DL: Variation in gene expression within and among natural populations. Nat Genet 2002, 32:261-266.
9. Aubin-Horth N, Landry CR, Letcher BH, Hofmann HA: Alternative life histories shape brain gene expression profiles in males of the same population. Proc Biol Sci 2005, 272:1655-1662. 10. Whitehead A, Crawford DL: Neutral and adaptive variation in
gene expression. Proc Natl Acad Sci USA 2006, 103:5425-5430. 11. Enard W, Khaitovich P, Klose J, Zöllner S, Heissig F, Giavalisco P,
Nieselt-Struwe K, Muchmore E, Varki A, Ravid R, Doxiadis GM, Bon-trop RE, Pääbo S: Intra- and interspecific variation in primate gene expression patterns. Science 2002, 296:340-343.
12. Stranger BE, Forrest MS, Clark AG, Minichiello MJ, Deutsch S, Lyle R, Hunt S, Kahl B, Antonarakis SE, Tavare S, Deloukas P, Dermitzakis ET: Genome-wide associations of gene expression variation in humans. PLoS Genet 2005, 1:e78.
13. Spielman RS, Bastone LA, Burdick JT, Morley M, Ewens WJ, Cheung VG: Common genetic variants account for differences in gene expression among ethnic groups. Nat Genet 2007, 39:226-231.
14. Storey JD, Madeoy J, Strout JL, Wurfel M, Ronald J, Akey JM: Gene-expression variation within and among human populations. Am J Hum Genet 2007, 80:502-509.
Afri-can and non-AfriAfri-can populations of Drosophila melanogaster. Genetics 2002, 160:247-256.
16. Ometto L, Glinka S, De Lorenzo D, Stephan W: Inferring the effects of demography and selection on Drosophila mela-nogaster populations from a chromosome-wide scan of DNA variation. MolBiolEvol 2005, 22:2119-2130.
17. Shapiro JA, Huang W, Zhang C, Hubisz MJ, Lu J, Turissini DA, Fang S, Wang HY, Hudson RR, Nielsen R, Chen Z, Wu CI: Adaptive genic evolution in the Drosophila genomes. ProcNatlAcadSci USA 2007, 104:2271-2276.
18. David JR, Capy P: Genetic variation of Drosophila melanogaster natural populations. TrendsGenet 1988, 4:106-111.
19. Lachaise D, Cariou ML, David JR, Lemeunier F, Tsacas L, Ashburner M: Historical biogeography of the Drosophila melanogaster species subgroup. EvolBiol 1988, 22:159-225.
20. Glinka S, Ometto L, Mousset S, Stephan W, De Lorenzo D: Demog-raphy and natural selection have shaped genetic variation in Drosophila melanogaster: a multi-locus approach. Genetics 2003, 165:1269-1278.
21. Pool JE, Aquadro CF: History and structure of sub-Saharan populations of Drosophila melanogaster. Genetics 2006, 174:915-929.
22. Orengo DJ, Aguadé M: Detecting the footprint of positive selec-tion in a European populaselec-tion of Drosophila melanogaster: multilocus pattern of variation and distance to coding regions. Genetics 2004, 167:1759-1766.
23. Haddrill PR, Thornton KR, Charlesworth B, Andolfatto P: Multilo-cus patterns of nucleotide variability and the demographic and selection history of Drosophila melanogaster populations. GenomeRes 2005, 15:790-799.
24. Li H, Stephan W: Inferring the demographic history and rate of adaptive substitution in Drosophila. PLoSGenet 2006, 2:e166. 25. Jin W, Riley RM, Wolfinger RD, White KP, Passador-Gurgel G,
Gib-son G: The contributions of sex, genotype and age to tran-scriptional variance in Drosophila melanogaster. Nat Genet 2001, 29:389-395.
26. Rifkin SA, Kim J, White KP: Evolution of gene expression in the Drosophila melanogaster subgroup. NatGenet 2003, 33:138-144. 27. Gibson G, Riley-Berger R, Harshman L, Kopp A, Vacha S, Nuzhdin S, Wayne M: Extensive sex-specific nonadditivity of gene expres-sion in Drosophila melanogaster. Genetics 2004, 167:1791-1799. 28. Meiklejohn CD, Parsch J, Ranz JM, Hartl DL: Rapid evolution of
male-biased gene expression in Drosophila. ProcNatlAcadSci USA 2003, 100:9894-9899.
29. Rubin GM, Hong L, Brokstein P, Evans-Holm M, Frise E, Stapleton M, Harvey DA: A Drosophila complementary DNA resource. Science 2000, 287:2222-2224.
30. Hutter S, Li H, Beisswanger S, De Lorenzo D, Stephan W: Distinctly different sex ratios in African and European populations of Drosophila melanogaster inferred from chromosomewide sin-gle nucleotide polymorphism data. Genetics 2007, 177:469-480. 31. Townsend JP, Hartl DL: Bayesian analysis of gene expression levels: statistical quantification of relative mRNA level across multiple strains or treatments. Genome Biol 2002, 3:RESEARCH0071.
32. Townsend JP: Resolution of large and small differences in gene expression using models for the Bayesian analysis of gene expression levels and spotted DNA microarrays. BMC Bioinformatics 2004, 5:54.
33. Clark TA, Townsend JP: Quantifying variation in gene expres-sion. MolEcol 2007, 16:2613-2616.
34. Parisi M, Nuttall R, Naiman D, Bouffard G, Malley J, Andrews J, East-man S, Oliver B: Paucity of genes on the Drosophila X chromo-some showing male-biased expression. Science 2003, 299:697-700.
35. Ranz JM, Castillo-Davis CI, Meiklejohn CD, Hartl DL: Sex-depend-ent gene expression and evolution of the Drosophila tran-scriptome. Science 2003, 300:1742-1745.
36. Gnad F, Parsch J: Sebida: a database for the functional and evo-lutionary analysis of genes with sex-biased expression. Bioinformatics 2006, 22:2577-2579.
37. Kristensen TN, Sorensen P, Kruhoffer M, Pedersen KS, Loeschcke V: Genome-wide analysis on inbreeding effects on gene expres-sion in Drosophila melanogaster. Genetics 2005, 171:157-167. 38. Khaitovich P, Weiss G, Lachmann M, Hellmann I, Enard W, Muetzel
B, Wirkner U, Ansorge W, Pääbo S: A neutral model of transcrip-tome evolution. PLoSBiol 2004, 2:e132.
39. Lemos B, Meiklejohn CD, Caceres M, Hartl DL: Rates of
diver-gence in gene expression profiles of primates, mice, and flies: stabilizing selection and variability among functional categories. EvolutionIntJOrgEvolution 2005, 59:126-137. 40. Gillespie JH: PopulationGenetics:aConciseGuide. Baltimore, MD: The
Johns Hopkins University Press; 1998.
41. Denver DR, Morris K, Streelman JT, Kim SK, Lynch M, Thomas WK: The transcriptional consequences of mutation and natural selection in Caenorhabditis elegans. NatGenet 2005, 37:544-548. 42. Rifkin SA, Houle D, Kim J, White KP: A mutation accumulation assay reveals a broad capacity for rapid evolution of gene expression. Nature 2005, 438:220-223.
43. Lemos B, Meiklejohn CD, Hartl DL: Regulatory evolution across the protein interaction network. NatGenet 2004, 36:1059-1060. 44. Lemos B, Bettencourt BR, Meiklejohn CD, Hartl DL: Evolution of proteins and gene expression levels are coupled in Dro-sophila and are independently associated with mRNA abun-dance, protein length, and number of protein-protein interactions. MolBiolEvol 2005, 22:1345-1354.
45. Karlik CC, Coutu MD, Fyrberg EA: A nonsense mutation within the act88F actin gene disrupts myofibril formation in Dro-sophila indirect flight muscles. Cell 1984, 38:711-719.
46. Qiu F, Lakey A, Agianian B, Hutchings A, Butcher GW, Labeit S, Leon-ard K, BullLeon-ard B: Troponin C in different insect muscle types: identification of two isoforms in Lethocerus, Drosophila and Anopheles that are specific to asynchronous flight muscle in the adult insect. BiochemJ 2003, 371:811-821.
47. Azevedo RBR, James AC, McCabe J, Partridge L: Latitudinal varia-tion of wing: thorax size ratio and wing-aspect ratio in Dro-sophila melanogaster. Evolution 1998, 52:1353-1362.
48. Reed SC, Williams CM, Chadwick LE: Frequency of wing-beat as a character for separating species races and geographic vari-eties of Drosophila. Genetics 1942, 27:349-361.
49. Ren N, Zhu C, Lee H, Adler PN: Gene expression during Dro-sophila wing morphogenesis and differentiation. Genetics 2005, 171:625-638.
50. Lemaitre B, Hoffmann J: The host defense of Drosophila melanogaster. AnnuRevImmunol 2007, 25:697-743.
51. Yang J, McCart C, Woods DJ, Terhzaz S, Greenwood KG, ffrench-Constant RH, Dow JA: A Drosophila systems approach to xeno-biotic metabolism. PhysiolGenomics 2007, 30:223-231.
52. Pedra JH, McIntyre LM, Scharf ME, Pittendrigh BR: Genome-wide transcription profile of field- and laboratory-selected dichlo-rodiphenyltrichloroethane (DDT)-resistant Drosophila. Proc NatlAcadSciUSA 2004, 101:7034-7039.
53. Wise EM Jr, Ball EG: Malic enzyme and lipogenesis. ProcNatl AcadSciUSA 1964, 52:1255-1263.
54. Merritt TJ, Duvernell D, Eanes WF: Natural and synthetic alleles provide complementary insights into the nature of selection acting on the Men polymorphism of Drosophila melanogaster. Genetics 2005, 171:1707-1718.
55. Daborn PJ, Yen JL, Bogwitz MR, Le Goff G, Feil E, Jeffers S, Tijet N, Perry T, Heckel D, Batterham P, Feyereisen R, Wilson TG, ffrench-Constant RH: A single p450 allele associated with insecticide resistance in Drosophila. Science 2002, 297:2253-2256.
56. Drosophila Genomics Resource Center Microarray Website [https://dgrc.cgb.indiana.edu/microarrays]
57. NCBI Gene Expression Omnibus (GEO) [http://www.ncbi.nlm.nih.gov/geo]
58. Rainer J, Sanchez-Cabo F, Stocker G, Sturn A, Trajanoski Z: CAR-MAweb: comprehensive R- and bioconductor-based web service for microarray data analysis. NucleicAcidsRes 2006, 34(Web Server issue):W498-W503.
59. Gentleman RC, Carey VJ, Bates DM, Bolstad B, Dettling M, Dudoit S, Ellis B, Gautier L, Ge Y, Gentry J, Hornik K, Hothorn T, Huber W, Iacus S, Irizarry R, Leisch F, Li C, Maechler M, Rossini AJ, Sawitzki G, Smith C, Smyth G, Tierney L, Yang JY, Zhang J: Bioconductor: open software development for computational biology and bioin-formatics. GenomeBiol 2004, 5:R80.
60. Reimand J, Kull M, Peterson H, Hansen J, Vilo J: g:Profiler - a web-based toolset for functional profiling of gene lists from large-scale experiments. Nucleic Acids Res 2007, 35(Web Server issue):W193-W200.