https://doi.org/10.5194/hess-21-4573-2017 © Author(s) 2017. This work is distributed under the Creative Commons Attribution 3.0 License.
Characterizing the spatial variations and correlations of large
rainstorms for landslide study
Liang Gao, Limin Zhang, and Mengqian Lu
Department of Civil and Environmental Engineering, The Hong Kong University of Science and Technology, Clear Water Bay, Hong Kong
Correspondence to:Limin Zhang ([email protected])
Received: 1 March 2017 – Discussion started: 30 March 2017
Revised: 20 July 2017 – Accepted: 1 August 2017 – Published: 13 September 2017
Abstract. Rainfall is the primary trigger of landslides in Hong Kong; hence, rainstorm spatial distribution is an im-portant piece of information in landslide hazard analysis. The primary objective of this paper is to quantify spatial correla-tion characteristics of three landslide-triggering large storms in Hong Kong. The spatial maximum rolling rainfall is repre-sented by a rotated ellipsoid trend surface and a random field of residuals. The maximum rolling 4, 12, 24, and 36 h rain-fall amounts of these storms are assessed via surface trend fitting, and the spatial correlation of the detrended residu-als is determined through studying the scales of fluctuation along eight directions. The principal directions of the surface trend are between 19 and 43◦, and the major and minor axis lengths are 83–386 and 55–79 km, respectively. The scales of fluctuation of the residuals are found between 5 and 30 km. The spatial distribution parameters for the three large storms are found to be similar to those for four ordinary rain-fall events. The proposed rainrain-fall spatial distribution model and parameters help define the impact area, rainfall intensity and local topographic effects for landslide hazard evaluation in the future.
1 Introduction
Severe rainstorms are one of the most dangerous meteorolog-ical phenomena which pose risks to human lives and prop-erties. A large rainstorm may cause serious damage to in-frastructure and threaten public safety. For instance, a large storm hit Lantau Island, Hong Kong, on 5–7 June 2008 and caused about 2400 natural terrain landslides and 622 flooding spots (CEDD, 2009). Historical records show that the spatial
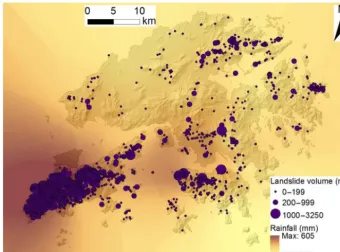
rainstorm variation and the potential for triggering landslides are closely correlated. The Geotechnical Engineering Of-fice (GEO) maintains a Natural Terrain Landslide Inventory (NTLI; King, 1999; Maunsell-Fugro Joint Venture, 2007), which has records of 19 763 natural terrain landslides and debris flows up to 2013 as well as 89 571 relict natural ter-rain landslides. The data of natural terter-rain landslides that oc-curred on 5–7 June 2008 are extracted and the distributions of the landslide volume and the maximum 24 h rolling rainfall are plotted in Fig. 1. There is a close correspondence between the observed landslide volume and the maximum 24 h rolling rainfall in space. Characterizing the spatial characteristics of storms is therefore essential for assessing rain-induced land-slide hazards.
Numerical analyses have also been conducted to establish the relation between rainfall characteristics and landslides (e.g., Gao et al., 2016, 2017). Geotechnical and environmen-tal factors, such as slope gradient, rock and soil formations, groundwater conditions, vegetation, and the presence of civil infrastructure, are believed to ultimately affect the trigger-ing of landslides in addition to rainfall intensity. The main factors that affect triggering of natural terrain landslides are summarized in Fig. 2.
rel-4574 L. Gao et al.: Characterizing the spatial variations and correlations of large rainstorms
Figure 1.Spatial distributions of the maximum 24 h rolling rainfall and the landslides triggered in Hong Kong on 5–7 June 2008.
evant spatial variation factors of rainfall must be character-ized, such as the geometry of spatial form (agglomerate and local gradient) and the spatial correlation.
A storm is difficult to model due to its intermittence (i.e., no rainfall at a particular position during a particular short period) and strong spatial and temporal heterogeneity (e.g., Barancourt et al., 1992; Bacchi and Kottegoda, 1995; Mas-caro, 2013). However, the rainfall amount, which is in the form of regionalized variables, is spatially correlated over a certain distance (Panthou et al., 2014; de Luca, 2014). A re-gionalized variable is any variable distributed in space. Ran-dom field theory is recognized as a suitable theory for de-scribing regionalized variables (Vanmarcke, 1977) and has been proven effective for the regionalized variables (e.g., Dasaka and Zhang, 2012; Li et al., 2015). The random field theory has also been used in spatial storm analysis (e.g., Rodríguez-Iturbe et al., 1986; Bouvier, 2003) and adopted to describe storm spatial structures (e.g., Zawadzki, 1973; Lebel et al., 1987; Gyasi-Agyei and Pegram, 2014).
Research on spatial rainfall distribution using statistical models has been performed in Hong Kong for different en-gineering purposes (Leung and Law, 2002; Jiang and Tung, 2014; AECOM and Lin, 2015). Leung and Law (2002) con-ducted kriging analysis on Hong Kong hourly rainfall data in 1997 and 1998. Rainfall contours were interpolated to quali-tatively estimate possible flooding locations. Jiang and Tung (2014) derived rainfall depth–duration–frequency relations at ungauged sites in Hong Kong using an ordinary kriging ap-proach based on annual maximum daily rainfall data. The
extreme rainfall estimates are sensitive to assumed statistical parameters and uncertainties of the interpolation method.
The storm characteristics such as distribution form and spatial correlation are not sufficiently analyzed when study-ing the hydrological response of a target system such as a slope safety system. In particular, limited attention has been paid to event-based spatial characteristics of large rainstorms in Hong Kong, whose patterns and structures are as useful as the statistical trend based on historic rainfall records, es-pecially when one needs to select large rainstorms for land-slide risk assessment. Sufficient information should be pro-vided, including both spatial variation and correlation. How-ever, several key questions have not been answered. Can the spatial precipitation distribution of a large storm be repre-sented using a particular spatial form? How does the spatial correlation of rainfall change with the rainstorm magnitude? What are the key factors that influence the spatial structure of rainfall distribution? Such questions motivate the present study on the spatial characteristics of large rainstorms over hilly terrains in Hong Kong.
Figure 2.Geotechnical and environmental factors that affect the triggering of natural terrain landslides.
2 Topography and general rainfall distribution in Hong Kong
Hong Kong is located at the southeast coast of China. The subtropical climate in Hong Kong is characterized by no-table dry and wet seasons. About 85 % of the annual rain-fall is recorded during the wet season from April to Septem-ber. Storms with high intensity and short duration in Hong Kong are typically associated with southwest monsoon or tropical cyclones. The ground surface elevation on the GIS platform is shown in Fig. 3. The two highest mountain peaks in Hong Kong are Tai Mo Shan (near rain gauge N14) and Lantau Peak (near rain gauge N21), with peak elevations of 957 and 934 m a.s.l., respectively. Both the moisture move-ments and the topography determine the distribution charac-teristics (e.g., agglomerate and local gradient) of rainfall in the spatial domain.
AECOM and Lin (2015) studied the orographic factors of rainfall spatial distribution based on historical records. A spatial distribution of orographic intensification factors has
been developed based on historical hourly data. The 24 h oro-graphic intensification factors at a resolution of 5 km×5 km are shown in Fig. 4. The factors for the land area are in gen-eral larger than those for the sea area. The higher the eleva-tion is, the larger the orographic intensificaeleva-tion factor. Two of the highest intensity regions are located at Tai Mo Shan in New Territories and Lantau Peak on Lantau Island. The trend of the factors coincides with the mountain range alignment, i.e., around N 45◦E.
4576 L. Gao et al.: Characterizing the spatial variations and correlations of large rainstorms
[image:4.612.126.459.372.616.2]Figure 3.The GEO rain-gauge network in Hong Kong.
Figure 4.The 24 h orographic intensification factors in Hong Kong (modified from AECOM and Lin, 2015).
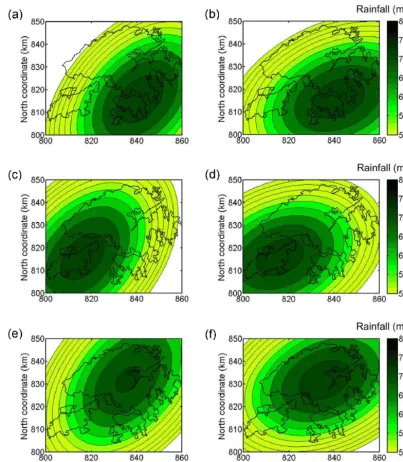
and the typical trends are shown in Fig. 5. The trend surfaces are derived based on the historical hourly rainfall. According to the 24 h PMP updating study, an elliptical isohyet is rec-ommended as a generalized convergence pattern. For storms
Figure 5.Trend surfaces of 24 h PMP with(a)NE–SW orientation 45◦;(b)ENE–WSW orientation 22.5◦centered at Hong Kong Island; (c)NE–SW orientation 45◦;(d)ENE–WSW orientation 22.5◦centred at Lantau Island;(e)NE–SW orientation 45◦; and(f)ENE–WSW orientation 22.5◦centred at Tai Mo Shan (modified from AECOM and Lin, 2015).
3 Progression and precipitation data of three large storms
The most traditional way to describe the rainstorm severity is by return period, which is recognized as a combination of intensity and duration. Another measure of the severity of a storm is the consequence of the storm, such as rain-induced landslides or flooding. An index measuring the potential to trigger landslides, named “Landslide Potential Index (LPI)”, is used in Hong Kong (CEDD, 2009). The LPI is based on the historic records of landslide events since 1984. For instance,
a storm in late July 1994 caused five fatalities and its LPI was 10. The value of LPI can be greater than 10 if a storm is more damaging than the July 1994 storm. According to the LPI, the top three largest storms in the past 20 years were the 5–7 June 2008 storm, the 17–21 August 2005 storm, and the 23 July 1994 storm. Each of these three storms had an LPI around 10 and led to fatalities. Thus, the three storm events are selected as indicative large storms to conduct spatial cor-relation analysis in this paper.
Obser-4578 L. Gao et al.: Characterizing the spatial variations and correlations of large rainstorms
Figure 6.Hyetographs of three storms:(a)5–7 June 2008 storm, Station N19;(b)17–21 August 2005 storm, Station N01;(c)22– 24 July 1994 storm, Station N14.
vatory in Hong Kong. The GEO and Hong Kong Observa-tory rain gauge networks comprise 88 and 46 stations, re-spectively (Fig. 3). The rain gauges are more concentrated in the northern Hong Kong Island and Kowloon, where the population density is high. The raw digital data at 5 min in-terval from the high-quality network ensure the reliability of this study. The data cover the period from 00:00 LT on 5 June to 24:00 LT on 7 June 2008, from 00:00 LT on 17 Au-gust to 24:00 LT on 21 AuAu-gust 2005, and from 00:00 LT on 22 July to 24:00 LT on 24 July 1994. Some of the rain gauges had not been installed in July 1994. The numbers of effec-tive rain gauges for the three events are 105, 112, and 56, respectively. The three storm hyetographs corresponding to the maximum local precipitation depth are shown in Fig. 6. The 17–21 August 2005 storm is more moderate in short
du-Figure 7.Spatial distribution of the total rainfall amount:(a)the 5–7 June 2008 storm;(b)the 17–21 August 2005 storm; (c)the 22–24 July 1994 storm.
rations compared with the 5–7 August 2008 storm and the 22–24 July 1994 storm.
3.1 The 5–7 June 2008 storm
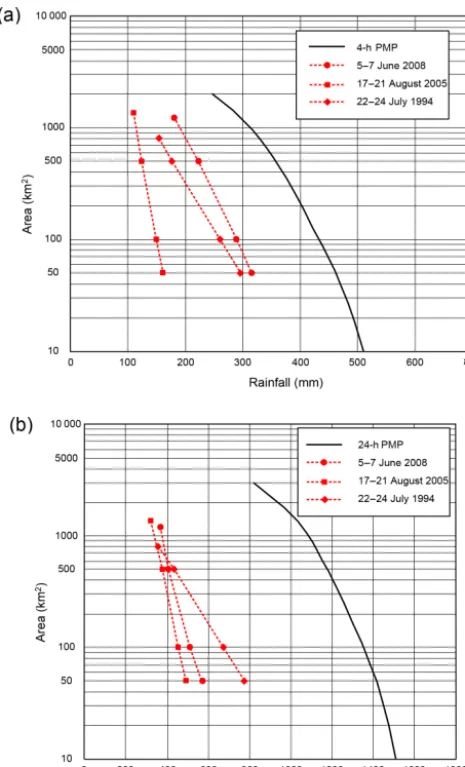
[image:6.612.308.545.68.515.2]Figure 8.Magnitudes of the three storms characterized by(a)4 h PMP and(b)24 h PMP (modified from AECOM and Lin, 2015).
the storm characterized by 4 and 24 h PMP (AECOM and Lin, 2015) are shown in Fig. 8. From the depth–area rela-tionships, when the area is in the range of 50–1100 km2, the maximum rolling 4 h rainfall of the 5–7 June 2008 storm has a return period of 1100 years, corresponding to 60–67 % of the 4 h PMP, while the return period for the 24 h rainfall is 200 years, corresponding to 33–41 % of the 24 h PMP. The 4 h maximum rolling rainfall value is calculated as the max-imum values of rainfall in 4 consecutive hours on a hyeto-graph. The storm caused 2400 natural terrain landslides (Li et al., 2009), including many debris flows that affected de-veloped regions, leading to two fatalities (CEDD, 2008). The LPI value was recognized as 12.
The maximum rolling rainfall values at different locations may not be in the same period, though most of them tend to be in the same period. Hazard consequences are more related to the maximum rolling rainfall values than instantaneous consequences are (Dai and Lee, 2001). In formulations for
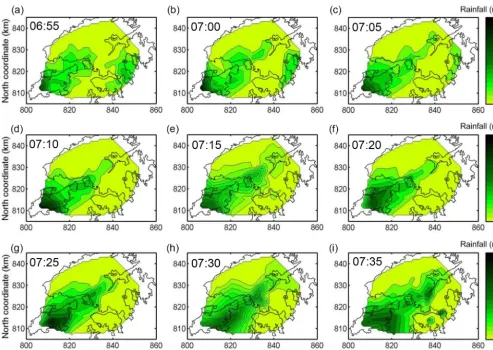
a hydrological model, the effect of the timescale of aggre-gation of the rainfall data and the hydrological response of catchments of different sizes should be investigated in order to identify the critical scale on which the resulting discharge will be the largest and could potentially generate flash floods. The most concentrating periods of precipitation are se-lected. Figure 9 shows the instantaneous rainfall process from 06:55 to 07:35 LT on 7 June 2008. During this period, the vapour was concentrated on the southwest of Lantau Is-land and transported northeast across the mountains on Lan-tau Island. A large amount of precipitation was retained on the island.
3.2 The 17–22 August 2005 storm
August 2005 was much wetter than normal. A very active southwest monsoon during 17–22 August brought in plenty of moisture. Figure 7b shows contours of the total amount of rainfall. The maximum total rainfall amount was 890 mm. The storm center was at the middle of the territory, Sha Tin. From Fig. 8, both the maximum rolling 4 h rainfall and 24 h rainfall of the 17–22 August 2005 storm are least critical among the three storms investigated in this paper. The storm caused 229 reported landslides, resulting in one fatality. The LPI value is 10 (Kong and Ng, 2006).
Figure 10 shows the instantaneous rainfall process from 10:35 to 11:15 LT on 20 August 2005, which is recognized as the heaviest rainfall period in this storm event. The prevailing moisture inflow mainly came southerly during this period. The rainfall center concentrated on the south of Tai Mo Shan. 3.3 The 21–24 July 1994 storm
The total precipitation amount in the storm event from 21 to 24 July 1994 was recorded as the highest for any consec-utive days in July. The weather was related to a trough of low pressure (Tam et al., 1995). Figure 7c shows contours of the total amount of rainfall of this storm concentrating in the middle of the New Territories, at Tai Mo Shan. The maximum total rainfall amount was 1450 mm. In Fig. 8, the maximum rolling 24 h rainfall is the most critical, especially for a smaller area. The storm caused 820 natural terrain land-slides and 451 man-made slope failures, resulting in five fa-talities and four injuries. The LPI value is 10 (Chan, 1995).
4580 L. Gao et al.: Characterizing the spatial variations and correlations of large rainstorms
Figure 9.Instantaneous rainfall process from 06:55 to 07:35 LT on 7 June 2008.
3.4 Summary of the three large storms
All the aforementioned three storms are related to monsoons other than typhoons. The meteorological factors for these storms are beyond the scope of this paper. This research fo-cuses on the areal distribution of precipitation, which is be-lieved to be more relevant to the evaluation of the perfor-mance of the slope safety system. Thus the maximum rolling rainfall values are estimated in different durations. Accord-ing to the records from the automatic rain gauges, the max-imum rolling rainfall among all the rain-gauge stations in each of the three events can be calculated. The correspond-ing peak values and stations are summarized in Table 1. The 22–24 July 1994 storm is the largest among the three storms with regard to the amounts of the maximum rolling 1 h and 24 h rainfall. However, in terms of the maximum rolling 4 h rainfall, the 5–7 June 2008 storm is the most critical.
The contours of the total rainfall for the three storms, in-terpolated using a triangular method, are shown in Fig. 7. The total precipitation amount of the 5–7 June 2008 storm is the smallest among the three events, while that of the 21– 24 July 1994 storm is the largest due to its longer duration.
However, the LPI value for the 5–7 June 2008 storm is 12, larger than those of the other two storms; that is, the 5– 7 June 2008 storm is the largest one in terms of damage. One of the reasons is that the variability of spatial and temporal distributions of the storm affects both the infiltration dynam-ics of the surface soil and the water levels above and below the ground surface. The entire hydrological system is gov-erned by the spatial and temporal distribution of rainfall.
4 Methodology of spatial analysis
Figure 10.Instantaneous rainfall process from 10:35 to 11:15 LT on 20 August 2005.
4.1 Determination of the expected precipitation trend surface
A storm is a phenomenon with gradual geographical changes in space; the rainfall amount can be simulated as a spa-tially correlated random field superimposed on a trend sur-face (Grimes and Pardo-Igúzquiza, 2010). Such an artificial rainfall trend surface can be used to represent design storms. One could comprehend that the rainfall is correlated with the local terrain and the design storm centers are likely to be around the mountain peaks. Hong Kong has a relatively small area, and an individual storm is usually designed to have one or two centers for engineering design purposes (AECOM and Lin, 2015). Distinguishing two peaks is not necessary, as the distance between any two peaks will be small with regard to the scale of a typical rainstorm.
Based on random field theory (Vanmarcke, 1977), the trend surface is the expected value of the precipitation dis-tributed over the rainfall domain, while the residuals are sta-tionary and not affected by any shift in the coordinate system. Thus, the first step is to divide the spatial distribution into a trend surface and residuals by finding a trend surface fitting
function. Though most natural processes such as storms ex-hibit spatial variability with complex trends, this paper uses a polynomial function for simplicity, with observations of a storm denoted aszi(xi,yi)(i=1,2, . . ., n). The fitted val-ues arezˆi=(xi, yi):
zi(xi, yi)= ˆzi(xi, yi)+εi, (1)
wherexandy define the location, andεi are residuals. The second-order polynomial trend surface is as follows:
ˆ
zi =a0+a1xi+a2yi+a3xi2+a4xiyi+a5yi2. (2) The coefficients,a0,a1,. . . ,a5, are determined by minimiz-ing the sum of the squares of the error term usminimiz-ing the ordinary least-squares (OLS) analysis (Journel and Huijbergts, 1978):
Q=min
n
X
i=1
εi2=min n
X
i=1
zi(xi, yi)− ˆzi(xi, yi) 2
. (3)
4582 L. Gao et al.: Characterizing the spatial variations and correlations of large rainstorms
[image:10.612.144.454.470.577.2]Figure 11.Instantaneous rainfall process from 15:00 to 15:40 LT on 23 July 1994.
Table 1.Values of maximum rolling rainfall of three landslide-triggering storms in Hong Kong.
Duration 5–7 Jun 2008 storm 17–21 Aug 2005 storm 22–24 Jul 1994 storm
Amount Station Amount Station Amount Station
(mm) (mm) (mm)
1 h 154 N21 82 N25 212 N14
4 h 384 N19 174 N18 365 N14
24 h 623 N19 570 N01 956 N14
2 day 672 N19 768 N01 1216 N14
4 day 768 N19 890 N01 1450 N14
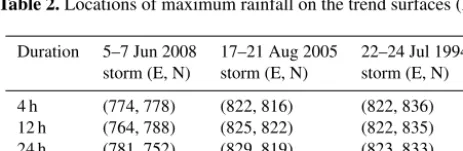
Table 2.Locations of maximum rainfall on the trend surfaces (km)
Duration 5–7 Jun 2008 17–21 Aug 2005 22–24 Jul 1994 storm (E, N) storm (E, N) storm (E, N)
4 h (774, 778) (822, 816) (822, 836) 12 h (764, 788) (825, 822) (822, 835) 24 h (781, 752) (829, 819) (823, 833) 36 h (769, 747) (830, 820) (825, 826)
durations are often assumed to be stationary. Taking the max-imum 4 h rolling rainfall as an example, the trend surface is
ˆ
z= −45 984−0.0337x+0.1527y
[image:10.612.49.281.620.696.2]mi-Figure 12.Trend surfaces and residuals of the total rainfall amounts:(a)and (b)show the 5–7 June 2008 storm;(c)and(d) show the 17–21 August 2005 storm;(e)and(f)show the 22–24 July 1994 storm.
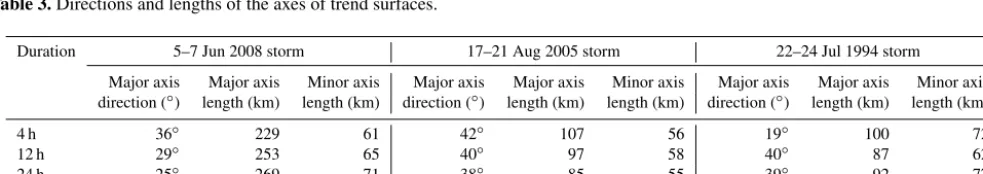
Table 3.Directions and lengths of the axes of trend surfaces.
Duration 5–7 Jun 2008 storm 17–21 Aug 2005 storm 22–24 Jul 1994 storm
Major axis Major axis Minor axis Major axis Major axis Minor axis Major axis Major axis Minor axis direction (◦) length (km) length (km) direction (◦) length (km) length (km) direction (◦) length (km) length (km)
4 h 36◦ 229 61 42◦ 107 56 19◦ 100 72
12 h 29◦ 253 65 40◦ 97 58 40◦ 87 62
24 h 25◦ 269 71 38◦ 85 55 39◦ 92 77
[image:11.612.53.545.615.702.2]4584 L. Gao et al.: Characterizing the spatial variations and correlations of large rainstorms
Table 4.Directions and semilengths of the axes of scale of fluctuation (SoF).
Duration 5–7 Jun 2008 storm 17–21 Aug 2005 storm 22–24 Jul 1994 storm
Major axis Semilengths Semilengths Major axis Semilengths Semilengths Major axis Semilengths Semilengths direction (◦) of the major of the minor direction (◦) of the major of the minor direction (◦) of the major of the minor
axes (km) axes (km) axes (km) axes (km) axes (km) axes (km)
4 h −18◦ 31 9 −3◦ 14 5 8◦ 10 7
12 h −7◦ 17 7 38◦ 37 7 21◦ 9 6
24 h −36◦ 12 8 33◦ 23 7 4◦ 9 6
36 h −79◦ 18 6 36◦ 24 7 9◦ 7 6
Figure 13.Scale of fluctuation values and ellipse-fitting curves for the 5–7 June 2008 storm:(a)maximum rolling 4 h rainfall,(b)maximum rolling 12 h rainfall,(c)maximum rolling 24 h rainfall, and(d)maximum rolling 36 h rainfall.
nor axes can be calculated as those of the ellipse with rain-fall value approaching zero. The directions and lengths of the trend surfaces are summarized in Table 3. The major and mi-nor axes of the trend surfaces are determined by least-squares fitting of the original rainfall data. For an individual storm event, the maximum points of the trend surfaces are inside a relatively small range of 40 km. The storm center of each event on the trend surface agrees with the reality. The storm centers of the 7 June 2008 storm, the 17–21 August 2005
storm and the 23 July 1994 storm are at west Lantau Island, Sha Tin, and Tai Mo Shan, respectively. The major directions of the spatial forms are between 19 and 43◦in the anticlock-wise direction.
4.2 Determination of the scale of fluctuation of precipitation residuals
Figure 14.Scale of fluctuation values and ellipse-fitting curves for the 17–21 August 2005 storm:(a)maximum rolling 4 h rainfall,(b) max-imum rolling 12 h rainfall,(c)maximum rolling 24 h rainfall, and(d)maximum rolling 36 h rainfall.
Griffiths, 2008; Foresti and Seed, 2014). The autocorrelation describes the correlation between values of a same series. The autocorrelationr(k)for lagsk=0,1, . . ., m, wheremis the maximum number of lags, is evaluated by the following equation:
rk= 1 (N−k−1)
N−k
P
i=1
(zi−z) (zi+k−z)
1 (N−1)
N−k
P
i=1
(zi−z)2
, (5)
where zi andzi+k are the detrended storm depths at loca-tionsi andi+k, respectively;N is the total number of the residuals; andzis the mean value of the residuals.
In order to assess the autocorrelation structure of the de-trended storm amounts, it is necessary to perform regression analysis to fit the ACF. Among many correlation structures, the single exponential structure is the most common:
ρ(h)=exp(−2h/θ ), (6)
wherehis the separation distance or lag; θ is the scale of fluctuation (SoF). The correlationρ(h)decays exponentially with separation distanceh. The negative autocorrelation co-efficient will not be evaluated. The values ofθ can be ob-tained accordingly. Within the scale of fluctuation, the rain-fall property is strongly correlated. A smaller scale of fluctu-ation indicates more rapid fluctufluctu-ations of the mean.
The scale of fluctuation is evaluated in the directions of N 0, N 45, N 90, and N 135◦E for each storm. The values of SoF are fitted by an ellipse using least-squares fitting. The values of SoF and the fitting curves are shown in Figs. 13– 15. Greater SoF values indicate smaller variability. The ma-jor direction can be recognized as the direction of maximum continuity.
4586 L. Gao et al.: Characterizing the spatial variations and correlations of large rainstorms
Figure 15.Scale of fluctuation values and ellipse-fitting curves for the 22–24 July 1994 storm:(a)maximum rolling 4 h rainfall,(b)maximum rolling 12 h rainfall,(c)maximum rolling 24 h rainfall, and(d)maximum rolling 36 h rainfall.
5 Spatial description of rainstorms
5.1 Geometric spatial form and correlation structure Though rainfall varies over space, the rainfall amount of a particular storm in terms of maximum rolling rainfall can be fitted by a polynomial function. The spatial form of the rainfall amount can be represented by a rotated ellipsoid with only one center. Such an artificial spatial form may exhibit geometrical regularity. For each storm, the trend surfaces in different durations show good consistency in the shape pa-rameters in terms of the peak point, long-axis direction and axis length. The peak points on the trend surfaces of the three storms are located in a relatively small range. The long-axis directions of the spatial forms of each event in different du-rations almost remain unchanged between 19 and 43◦. The lengths of the major and minor axes for an individual storm show consistency. The 5–7 June 2008 storm has the largest impact area, as indicated by larger axis lengths among the three rainstorms according to the results in Table 3.
With respect to the instantaneous rainfall processes shown in Figs. 9–11, the rainfall distributions in terms of maximum rolling rainfall are quite consistent to the heaviest rainfall process in each storm event. The rainfall distributions are strongly affected by the storm humidity transportation and are so uneven that the entire area should not be described as a single site. The locations of the storm centers determine the general trend of the areal rainfall distribution. The polyno-mial trend surfaces are effective for representing large rain-storm distributions in terms of maximum rolling rainfall.
Figure 16.Range values for(a)the 18 May 2007 storm (16:30 LT),(b)the 19 May 2007 storm (16:00 LT),(c)the 19 April 2008 storm (20:00 LT), and(d)the 15 September 2009 storm (15:00 LT; modified from Liu, 2013).
Figure 17.Normalized semivariances of the maximum rolling 24 h rainfall of the three storms and the mean annual maximum daily rainfall in Hong Kong.
spatially correlated within 5 km, whose spatial continuity is smaller than 30 km.
5.2 Comparison with the spatial structures of ordinary rainfall events
[image:15.612.49.286.475.652.2]4588 L. Gao et al.: Characterizing the spatial variations and correlations of large rainstorms
rain events indicated by variogram ranges corresponding to the peak rainfall intensity (6 min resolution) are plotted in Fig. 16. According to the results from ellipse fitting, the ma-jor principal directions of all the tropical depression storms (i.e., on 18 and 19 May 2007 and 15 September 2009) are around N 45◦E. The lengths of the principal axis of the trop-ical depression storms are within 30 km, while that of the 19 April 2008 storm is 40.8 km. The correlation structures of the instantaneous rain processes are consistent with those of the three large storms as illustrated in Sect. 5.1.
The spatial structure of annual maximum daily rainfall us-ing the variogram model provides additional information for generating design storms from another point of view. Ac-cording to the study conducted by Jiang and Tung (2014), the spatial variability represented by a variogram is used to establish the rainfall depth–duration–frequency relation-ships. By normalizing the indicator semivariogram by the variance of the indicator data, the normalized semivariances of the mean annual maximum daily rainfall and the maxi-mum rolling 24 h rainfall of the three storms are shown in Fig. 17. Based on the samples and the fitted exponential var-iogram model, the range of the mean of annual maximum daily rainfall is 7.1 km, which is close to the omnidirectional range values of the maximum rolling 24 h rainfall for the storms, particularly those for the 2008 storm and the 2005 storm. Thus, given a large storm whose spatial distribution is relatively smooth, the range value will be close to that of the annual maximum daily rainfall. The spatial structures of the three severe storms and the four ordinary rainfall events do not differ significantly.
With aspect to the local terrain impacts, the major direc-tions of both the three large rainstorms and the ordinary rain-fall events are all consistent with the mountain range align-ment in Hong Kong (Fig. 3). However, the severe storms are highly uncertain and it is difficult to ascertain and predict the future precipitation and extreme rainfall. Lu et al. (2013), Lu and Lall (2016), and Najibi et al. (2017) suggest a po-tential direction to further study the associated atmospheric circulation with moisture transport that has improved the pre-dictability of extreme rainfall and flooding in various regions, including western Europe and the Midwest and northeast of the United States. The spatial structure found in this study also indicates that there might be a link between the distribu-tion and the convergence of the moist air into the Hong Kong region.
6 Conclusions
A random rain-field model has been proposed to study the spatial characteristics of three large landslide-triggering rain-storms in Hong Kong. The cumulative rainfall depths in terms of maximum rolling rainfall in different durations are of particular importance for landslide studies and are taken
as random variables in this study. Based on the study, the fol-lowing conclusions can be drawn:
1. The amounts of maximum rolling rainfall in different durations share a dominating spatial structure that can be represented by a rotated ellipsoid surface established using the ordinary least-squares method. The shapes change slightly in different durations for a particular storm.
2. The major principal directions of the surface trends of the three rain storms are between 19◦ (N 71◦E) and
43◦(N 47◦E), and the principal major and minor axis
lengths are 83–386 and 55–79 km, respectively. 3. The spatial connectivity of large storms in Hong Kong
is estimated to be between 5 and 30 km. The rainfall amounts in the three large storms are observed to be strongly correlated within 5 km and likely to be con-nected within 30 km.
4. To verify the rationality and reliability of the spatial structures of large rainstorms, the spatial characteristics of four ordinary rainfall events are also studied. The spa-tial structures of the three large rainstorms are similar with those of the ordinary rainfall events and consistent with the mountain range alignment in Hong Kong.
Data availability. The key rainfall data for this research are avail-able at http://cezhangl.people.ust.hk/Totalrainfall.xlsx.
Competing interests. The authors declare that they have no conflict of interest.
Acknowledgements. The authors would like to thank the Geotech-nical Engineering Office (GEO) of the Civil Engineering and Development Department (CEDD) for providing the rainfall data described in this paper. This research is supported by the Research Grants Council of the Hong Kong SAR (nos. C6012–15G and 16202716).
Edited by: Thomas Kjeldsen
Reviewed by: two anonymous referees
References
AECOM and Lin, B.: 24 h Probable Maximum Precipitation Up-dating Study. GEO Report No. 314, Geotechnical Engineering Office, Hong Kong, 2015.
Barancourt, C., Creutin, J. D., and Rivoirard, J.: A method for de-lineating and estimating rainfall fields, Water Resour. Res., 28, 1133–1144, 1992.
Bouvier, C., Cisneros, L., Dominguez, R., Laborde, J. P., and Lebel, T.: Generating rainfall fields using principal components (PC) decomposition of the covariance matrix: a case study in Mexico City, J. Hydrol., 278, 107–120, 2003.
CEDD: Management of Natural Terrain Landslide Risk, Informa-tion Note 03/2008, Geotechnical Engineering Office, Civil Engi-neering and Development Department, Hong Kong, 2008. CEDD: Landslide Potential Index. Information Note 03/2009,
Geotechnical Engineering Office, Civil Engineering and Devel-opment Department, Hong Kong, 2009.
Chan, W. L.: Hong Kong Rainfall and Landslides in 1994, GEO re-port No. 54, Geotechnical Engineering Office, Hong Kong, 1995. Chang, W. L. and Hui, T. W.: Probable Maximum Precipitation for Hong Kong, Reprint 482, Hong Kong Observatory, Hong Kong, 2001.
Dai, F. C. and Lee, C. F.: Frequency–volume relation and prediction of rainfall-induced landslides, Eng. Geol., 59, 253–266, 2001. Dasaka, S. M. and Zhang, L. M.: Spatial variability of in situ
weath-ered soil, Géotechnique, 62, 375–384, 2012.
de Luca, D. L.: Analysis and modelling of rainfall fields at different resolutions in southern Italy, Hydrolog. Sci. J., 59, 1536–1558, 2014.
Fenton, G. A. and Griffiths, D. V.: Risk Assessment in Geotechnical Engineering, John Wiley and Sons, Inc., Hoboken, New Jersey, 2008.
Foresti, L. and Seed, A.: The effect of flow and orography on the spatial distribution of the very short-term predictability of rainfall from composite radar images, Hydrol. Earth Syst. Sci., 18, 4671– 4686, https://doi.org/10.5194/hess-18-4671-2014, 2014. Gao, L., Zhang, L. M., Chen, H. X., Shen, P.: Simulating debris flow
mobility in urban settings, Eng. Geol., 214, 67–78, 2016. Gao, L., Zhang, L. M., and Chen, H. X.: Likely scenarios
of natural terrain shallow slope failures on Hong Kong Is-land under extreme storms, Nat. Hazards Rev.,18, B4015001, https://doi.org/10.1061/(ASCE)NH.1527-6996.0000207, 2017. Grimes, D. I. F. and Pardo-Igúzquiza, E.: Geostatistical analysis of
rainfall geographical analysis, Geogr. Anal., 42, 136–160, 2010. Gyasi-Agyei, Y. and Pegram, G.: Interpolation of daily rainfall net-works using simulated radar fields for realistic hydrological mod-elling of spatial rain field ensembles, J. Hydrol., 519, 777–791, 2014.
Jiang, P. and Tung, Y. K.: Incorporating daily rainfalls to derive rainfall DDF relationships at ungauged sites in Hong Kong and quantifying their uncertainty, Stoch. Env. Res. Risk A., 29, 45– 62, 2014.
Journel, A. G. and Huijbergts, C. J.: Mining Geostatistics, Aca-demic Press, London, 1978.
King, J. P.: Natural Terrain Landslide Study: Natural Terrain Land-slide Inventory, GEO Report No. 74, Geotechnical Engineering Office, Hong Kong, 1999.
Kong, H. S. W. and Ng, A. F. H.: Factual Report on Hong Kong Rainfall and Landslides in 2005, GEO Report No. 223, Geotech-nical Engineering Office, Hong Kong, 2006.
Lebel, T., Bastin, G., Obled, C., Creutin, J. D.: On the accuracy of areal rainfall estimation: a case study, Water Resour. Res., 23, 2123–2134, 1987.
Leung, J. K. Y. and Law, T. C.: Kriging analysis on Hong Kong rainfall data, HKIE Transactions, 9, 26–31, 2002.
Li, A. C. O., Lau, J. W. C., Cheung, L. L. K., and Lam, C. L. H.: Re-view of Landslides in 2008, GEO Report No. 274, Geotechnical Engineering Office, Hong Kong, 2009.
Li, X. Y., Zhang, L. M., and Li, J. H.: Using condi-tioned random field to characterize the variability of ge-ologic profiles, J. Geotech. Geoenviron., 142, 04015096, https://doi.org/10.1061/(ASCE)GT.1943-5606.0001428, 2015. Liu, P.: Framework for Analysing Dynamic Time-Space Evolution
of Rain-Field, MPhil thesis, The Hong Kong University of Sci-ence and Technology, 2013.
Lu, M. and Lall, U.: Tropical Moisture Exports, Extreme Precipi-tation and Floods in Northeast US, Hydrol. Earth Syst. Sci. Dis-cuss., https://doi.org/10.5194/hess-2016-403, 2016.
Lu, M., Lall, U., Schwartz, A., and Kwon, H.: Precipitation pre-dictability associated with tropical moisture exports and circula-tion patterns for a major flood in France in 1995, Water Resour. Res., 49, 6381–6392, 2013.
Mascaro, G., Deidda, R., and Hellies, M.: On the nature of rainfall intermittency as revealed by different metrics and sampling approaches, Hydrol. Earth Syst. Sci., 17, 355–369, https://doi.org/10.5194/hess-17-355-2013, 2013.
Maunsell-Fugro Joint Venture: Final Report on Compilation of the Enhanced Natural Terrain Landslide Inventory (ENTLI), Maunsell-Fugro Joint Venture and Geotechnical Engineering Of-fice, Hong Kong, 2007.
Najibi, N., Devineni, N., and Lu, M.: Hydroclimate drivers and at-mospheric teleconnections of long duration floods: An applica-tion to large reservoirs in the Missouri River Basin, Adv. Water Resour., 100, 153–167, 2017.
Panthou, G., Vischel, T., Lebel, T., Quantin, G., and Molinié, G.: Characterising the space–time structure of rainfall in the Sa-hel with a view to estimating IDAF curves, Hydrol. Earth Syst. Sci., 18, 5093–5107, https://doi.org/10.5194/hess-18-5093-2014, 2014.
Rodríguez-Iturbe, I., Cox, D. R., and Eagleson, P. S.: January. Spa-tial modelling of total storm rainfall, P. Roy. Soc. A-Math. Phys., 403, 27–50, 1986.
Tam, K. H. Au, C. H., and Chang, W. L.: The Severe Rainstorms on 22–24 July 1994 in Hong Kong, Reprint 256, Hong Kong Observatory, Hong Kong, 1995.
Vanmarcke, E. H.: Probability modelling of soil profiles, J. Geotech. Eng.-ASCE, 103, 1227–1246, 1977.
World Meteorological Organization: Manual on Estimation of Prob-able Maximum Precipitation (PMP), WMO-No.1045, Geneva, 2009.