Hydrol. Earth Syst. Sci., 10, 829–847, 2006 www.hydrol-earth-syst-sci.net/10/829/2006/ © Author(s) 2006. This work is licensed under a Creative Commons License.
Hydrology and
Earth System
Sciences
Physically-based modelling of hydrological processes in a tropical
headwater catchment (West Africa) – process representation and
multi-criteria validation
S. Giertz, B. Diekkr ¨uger, and G. Steup
Institute of Geography, University of Bonn, Bonn, Germany
Received: 30 January 2006 – Published in Hydrol. Earth Syst. Sci. Discuss.: 28 April 2006 Revised: 7 September 2006 – Accepted: 30 October 2006 – Published: 10 November 2006
Abstract. The aim of the study was to test the applicabil-ity of a physically-based model to simulate the hydrologi-cal processes in a headwater catchment in Benin. Field in-vestigations in the catchment have shown that lateral pro-cesses such as surface runoff and interflow are most impor-tant. Therefore, the 1-D SVAT-model SIMULAT was mod-ified to a semi-distributed hillslope version (SIMULAT-H). Based on a good database, the model was evaluated in a multi-criteria validation using discharge, discharge compo-nents and soil moisture data. For the validation of discharge, good results were achieved for dry and wet years. The main differences were observable in the beginning of the rainy season. A comparison of the discharge components deter-mined by hydro-chemical measurements with the simulation revealed that the model simulated the ratio of groundwater fluxes and fast runoff components correctly. For the vali-dation of the discharge components of single events, larger differences were observable, which was partly caused by un-certainties in the precipitation data. The representation of the soil moisture dynamics by the model was good for the top soil layer. For deeper soil horizons, which are characterized by higher gravel content, the differences between simulated and measured soil moisture were larger.
A good agreement of simulation results and field investi-gations was achieved for the runoff generation processes. In-terflow is the predominant process on the upper and the mid-dle slopes, while at the bottom of the hillslope groundwater recharge and – during the rainy season – saturated overland flow are important processes.
Correspondence to: S. Giertz
1 Introduction
In the past decades significant progress has been achieved in understanding and modelling hydrological processes. The bulk of hydrological process research was carried out in tem-perate climate zones while only a few field investigations concerning hydrological processes were effected in tropi-cal zones. Bonell and Bruijnzeel (2005) summarize the re-search activities concerning hydrology in the humid tropics with special regard to human activities. Their publication show that most investigations concerning runoff generation processes in tropical forests were carried out in South and Central America, Australia and South-East Asia. Particu-larly in the Amazon catchment in Brazil intensive process studies were performed by Elsenbeer et al. (1992), Elsen-beer and Lack (1996), Sobieraj et al. (2002) and ElsenElsen-beer and Vertessy (2000). Most studies in the humid tropics re-vealed that lateral processes – mainly subsurface stormflow (interflow) – are predominant in tropical forest ecosystems. In West Africa, only a few studies concerning hydrological processes – particularly in Nigeria and the Ivory Coast- were carried out (Jeje et al., 1986; Ogunkoya and Jenkins, 1993; Chevallier and Planchon, 1993; van de Giesen et al., 2000).
830 S. Giertz et al.: Physically-based hydrological modelling in Benin
Figure 1. Location of the Aguima catchment, a sub-catchment of the Ouémé river in Benin,
West Africa.
Fig. 1. Location of the Aguima catchment, a sub-catchment of theOu´em´e river in Benin, West Africa.
finished. In other humid tropical regions such as South America, physically-based hydrological models have been successfully applied by Vertessy and Elsenbeer (1999) and Vertessy et al. (2000). This study is part of the IMPETUS-project (Speth et al., 2002), which analyses the impact of Global Change on the water cycle in Benin and Morocco.
The aim of this study was to test the applicability of the physically-based model SIMULAT-H in simulating the hy-drological processes in the sub-humid tropical environment of West Africa with special regard to the process descrip-tion. The process knowledge obtained by field studies was used to enhance the model which was intensely tested using field data. The objective was to thoroughly understand the hydrological processes and the influencing factors in the tar-get region so as to be able to forecast the effect of Global
Change on the water cycle. For this purpose the model must be able to consider the spatial distribution of soils and veg-etation and their temporal dynamic. The runoff generation processes have to be studied carefully to be able to predict the ratio of slow and fast runoff components in Global Change scenarios, which imply land use and climate change.
Based on field studies of the hydrological processes, the model results were evaluated with special regard to the pro-cess description. In order to analyse the effects of land cover on the runoff generation processes two sub-cachments with different land cover were investigated in detail (Upper Niaou: agricultural land use, Upper Aguima: natural vegetation).
2 Study site
In this study different sub-catchments of the Aguima catch-ment (30 km2), which is located in central Benin (Fig. 1), were investigated. The Aguima catchment was intensively investigated in terms of hydrology (Giertz, 2004), hydro-geology (Fass, 2004), soil properties and soil degradation (Junge, 2004), vegetation (Orthmann, 2005) and agricul-ture (Mulindabigwi, 2005; Dagbenonbakin, 2005) within the IMPETUS-project (Speth et al., 2002). Therefore a suffi-cient database for model parameterization and validation was available.
The catchment is located in the sub-humid Sudan-Guinea-Zone, which is characterized by a unimodal rainy season from May to October. The mean annual precipitation of the region is 1100 mm while the mean temperature is 26.4◦C. Typically monsoonal rainfall with a long duration and low intensities are of minor importance in the study area. Most of the precipitation comes from squall lines which results in a short period of high intensive rainfall followed by a longer tail with low intensities. Because the origin of the rainfall is the Jos plateau in Nigeria, the severe rainfall arrives at night when the measurement of the discharge is dangerous. There-fore, for peak flows, only water level measurements are avail-able.
River discharge occurs periodically during the rainy sea-son, while from December to May the rivers dry out. In small rivers, the time between the peak of rainfall and the peak of discharge is extremely short. Riverbank overflow discharge is common, resulting in problems concerning the stage-discharge relationship. Because the actual evapotran-spiration is about 800 mm/yr, the total discharge is only about 20% of the precipitation.
S. Giertz et al.: Physically-based hydrological modelling in Benin 831
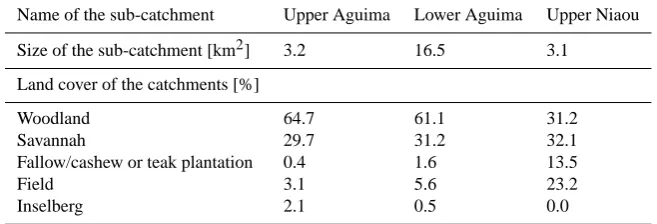
Table 1. Size and vegetation of the investigated sub-catchments.
Name of the sub-catchment Upper Aguima Lower Aguima Upper Niaou
Size of the sub-catchment [km2] 3.2 16.5 3.1
Land cover of the catchments [%]
Woodland 64.7 61.1 31.2
Savannah 29.7 31.2 32.1
Fallow/cashew or teak plantation 0.4 1.6 13.5
Field 3.1 5.6 23.2
Inselberg 2.1 0.5 0.0
are the primary drainage system of the African Precambrian basement complex and can often be found on deeply weath-ered granite and metamorphic rocks. As is often seen in West Africa, two aquifers do exist. A fractured rock aquifer is found in depths below 20 m. Near the surface a shallow saprolite aquifer is observed with a fluctuating groundwa-ter level depending to the rainfall patgroundwa-tern. The latgroundwa-ter aquifer is often used for water supply and is replenished during the rainy season.
The vegetation is mainly composed of woodland and sa-vannah. The land use in the southern part of the catchment is predominantly agricultural.
To analyse the processes as well as to develop and to validate the hydrological model, three sub-catchments were taken into account. These sub-catchments are characterized by different land cover types (Table 1). Due to its location close to a small village, the Niaou catchment is more inten-sively used for agriculture. The pedological investigations of Giertz and Diekkr¨uger (2003), Junge (2004), Giertz (2004) and Giertz et al. (2005) revealed that the human impact has a strong influence on soil properties and hydrology of the catchment.
The instrumentation and the available data-sets of the catchment are described in Sect. 5.
3 Hydrological processes
The runoff generation processes are mainly determined by soil properties and land cover. In the following section the soil properties of a typical soil catena of the Upper Aguima and the Upper Niaou catchment are described.
According to Junge (2004) Lixisols and Acrisols are the prevailing soils in both catchments. They mainly occur on the middle part of the hillslope. These soils are characterized by loamy sand in the ochric horizon, by clay accumulation in an argic horizon and by plinthitic gravel as evidence of the accumulation of iron compounds. The shallow Plinthosol occurs near the drainage divide and at the bottom of the hill-slope. They are defined by a subsurface layer containing an iron-rich mixture of clay minerals (chiefly kaolinite) and
sil-Figure 2. Flow paths on representive hillslopes in the a) Upper Aguima catchment (natural vegetation) and b) in the Upper Niaou catchment (agriculture).
The size of the arrows determines the importance of the flow paths.
Saprolite
Migmatitic Basement Hillwash
Plinthite
Saprolite
Migmatitic Basement Hillwash Plinthite Upper Aguima catchment
Upper Niaou catchment
(a)
(b)
Fig. 2. Flow paths on representive hillslopes in the (a) Upper Aguima catchment (natural vegetation) and (b) in the Upper Niaou catchment (agriculture). The size of the arrows determines the im-portance of the flow paths.
ica that hardens on exposure into in impermeable ironstone crust. This crust occurs mostly at 30 to 60 cm depth, which depends on erosion and accumulation processes. The texture of the topsoil layer is loamy sand.
[image:3.595.312.542.237.528.2]Table 2. Runoff generation processes in the Upper Aguima and Upper Niaou catchments.
Hillslope, soil type Prevailing runoff generation processes Upper Aguima, natural vegetation
Prevailing runoff generation processes Upper Niaou,
agricultural land use
Upper hillslope, Plinthosol Interflow –
Upper/middle hillslope, Lixisol Groundwater flow (saprolite), interflow Surface runoff (dependent on land use), groundwater flow (saprolite), interflow
Lower hillslope, Plinthosol Interflow Surface runoff, interflow
Inland valley fringe, sandy Gleysol Groundwater flow Infiltration of surface runoff from hillslope ->high groundwater recharge (saprolite) Inland valley center, clayey Gleysol Saturated surface runoff, groundwater flow Saturated surface runoff, groundwater flow
Pathways Surface runoff Surface runoff
Table 3. Water balance of the investigated catchments of the years 2000 to 2003.
Upper Aguima Lower Aguima Upper Niaou 2001 (18 June 2001–31 Dec 2001)
Precipitation [mm] 609 609 609
Discharge volume [m3] 74 145 752 415 483 054
Discharge height [mm] 23.0 45.5 155.8
Discharge coefficient [%] 3.8 7.5 25.6
2002
Precipitation [mm] 1145 1145 1157
Discharge volume [m3] 351 633 2 323 637 568 804
Discharge height [mm] 109.2 139.6 183.5
Discharge coefficient [%] 9.5 12.2 15.8
2003
Precipitation [mm] 1216 1216 1230
Discharge volume [m3] 631 473 3 033 868 714 710
Discharge height [mm] 196.1 183.3 230.6
Discharge coefficient [%] 16.1 15.2 18.7
In the riparian zone the Fluvisol, composed of alluvial sands, is the predominating soil type.
Although the texture of the top-soil of the different soil types is relatively uniform (mostly loamy sand), the in-situ measurements of the saturated conductivity revealed a high variability. The differences are mainly caused by different land use, which strongly influences the soil physical proper-ties (e.g. macroporosity due to biological activity), as was shown by Giertz (2004), Giertz et al. (2005) and Junge (2004). These investigations revealed that on savannah plots a mean density of 219 macropores/m2was observable, and only 5 (cotton), 8 (yam) and 60 (maize) macropores/m2 ex-isted on agricultural fields (Giertz et al., 2005). The impact of the macroporosity on the infiltration process was shown by in-situ measurements of the saturated conductivity. On agricultural fields the Ksat-value was two to five times
(de-pending on soil type) lower than on savannah/woodland veg-etation. Therefore for the surface runoff generation process the land use is one of the most important factors.
The runoff generation processes in the subsoil is more re-lated to the soil types, as the soil physical properties vary strongly between them. The permeability of the subsoil is relatively low for Lixisols/Acrisols (mean: 21.1 cm/d) and especially for Plinthosols with the nearly impermeable iron-pan crust (Giertz, 2004).
[image:4.595.134.461.273.495.2]S. Giertz et al.: Physically-based hydrological modelling in Benin 833
(a) (b)
Figure 3a. Model concept of SIMULAT
Figure 3b. Modification of SIMULAT to the hillslope version SIMULAT-H
Figure 4. Instrumentation of the Aguima catchment
Horizon 1
Horizon 2
Horizon 3
Interzeption Transpiration
Infiltration
Evaporation
Surface runoff
Interflow Soil water flux
Baseflow
Water uptake
surface runoff
baseflow
i
nterflow
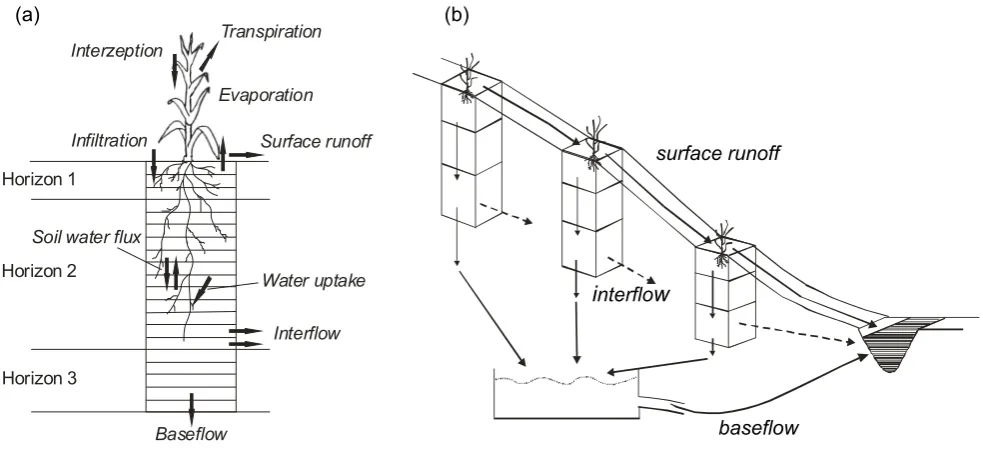
Fig. 3. (a) Model concept of SIMULAT. (b) Modification of SIMULAT to the hillslope version SIMULAT-H.
catchment surface runoff occurs only on pathways (Horto-nian overland flow) or at the bottom of the hillslope (sat-urated overland flow), when the inland valley is sat(sat-urated during the rainy season. But as inland valleys only occur at 1/3 of the channel length of the Upper Aguima, this pro-cess is not as important as in the Upper Niaou, where the whole river is characterized by inland valleys (Giertz and Diekkr¨uger, 2003). Due to the high macroporosity in soils of natural savannah and woodland vegetation, the infiltration rates are very high. The low permeability of the subsoil of Lixisols and Plinthosols results in subsurface flow processes, which can be considered as the prevailing processes on the hillslopes. In the Upper Niaou catchment the amount of sur-face runoff is higher due to low infiltration rates on fields. The generated surface runoff turns into concentrated flow on pathways and infiltrates at the bottom of the hillslope in the sandy Gleysol at the border of the inland valley. This process contributes to the saturation of the inland valley during the rainy season. After saturation of this area, saturated overland flow occurs.
Due to higher surface runoff amounts and lower evapotran-spiration (Giertz et al., 2005) the discharge amount is higher in the agricultural catchment, which is shown in Table 3. Mainly in dry years like the year 2001 the differences be-tween the catchments with natural vegetation and with agri-cultural land use is high.
4 Model approach
The analysis of the hydrological processes revealed that lat-eral processes as interflow and surface runoff are the major runoff generation processes in the catchment. Consequently the incorporation of lateral flow processes into the modelling approach is essential for an adequate process description.
To simulate the hydrological processes, the physically-based 1-D SVAT-model SIMULAT (Diekkr¨uger and Arning, 1995) was modified to a hillslope version SIMULAT-H. The model structure of the 1-D-model and the modified model is shown in Figs. 3a and b.
In SIMULAT-H, hillslope processes are taken into ac-count. The hillslope is subdivided in a number of subunits. The simulated surface runoff of the upslope unit is con-sidered as additional water input at the soil surface on the downslope subunit.
The algorithms to calculate the evapotranspiration, soil water fluxes and the lower boundary condition are taken from the 1-D-model SIMULAT. In the following sections the al-gorithms of the major processes are described. The complete model description can be found in Giertz (2004).
[image:5.595.53.545.69.294.2]4.1 Evapotranspiration
In this section the following terms are used:
ETpot = potential evapotranspiration [kg (m2s)−1] 1 = slope of the saturation vapour
pressure temperature relationship [–]
λ = latent heat of vaporisation [J kg−1] cp = specific heat of the air [1005 J (kg K )−1]
(es-ea) = vapour pressure deficit of the air [hPa] γ = psychrometric constant [0.68 hPa K−1] rs = bulk-stomata resistance [s m−1]
ra = aerodynamical resistance [s m−1]
Rn = radiation balance [W m−2]
G = soil heat flux [W m−2] LAI = leaf area index [–]
Epot = potential evaporation [kg (m2s)−1]
Eact = actual evaporation [kg (m2s)−1]
Emax = maximum evaporation [kg (m2s)−1] ξ = soil factor [–]
i = days since a defined minimal precipitation [d] Tpot = potential transpiration [kg (m2s)−1]
τ (ψ,z) = reduction factor [–]
ψ1 = minimal matrix potential, where water uptake
of the roots occurs [hPa]
ψ2 = matrix potential, where a reduction of the
water uptake of the roots starts [hPa]
ψ3 = wilting point [hPa]
The potential evapotranspiration is calculated with the Penman-Monteith equation:
λETpot=
1 (Rn−G)+cρes−ea ra
1+γ1+ rs
ra
(1)
In order to calculate the actual evapotranspiration the po-tential evapotranspiration is primarily separated in evapora-tion (Epot)and transpiration (Tpot)based on the leaf-area
in-dex (Ritchie, 1972):
Epot=ETpote−0.4LAI Tpot=ETpot(1−e−0.4LAI)
(2) The actual evaporation is computed with the empirical ap-proach of Ritchie (1972). Two cases are distinguished:
1. Until the maximum of evaporation (Emax)is achieved
the actual evaporation is equal to the potential evaporation 2. After the attainment of Emaxthe actual evaporation
de-clines continuously with time. The soil factorξ, which de-pends on the clay content of the soil, determines the decrease rate of the actual evaporation.
Eact =
Epot forEpot< Emax
EmaxforEpot≥Emax
Emax=
ξ(
√
i−
√
i−1 ifP
E >9(ξ−3)0.42
∞ ifP
E≤9(ξ−3)0.42 (3)
To determine the actual transpiration the approach of Fed-des et al. (1978) is implemented in SIMULAT. The potential
transpiration Tpotis reduced by the factorτ, which is
calcu-lated depending on the matrix potential.
τ (ψ, z)=
0 forψ > ψ1∨ψ≤ψ3
1 forψ≤ψ1∧ψ≥ψ2 ψ−ψ3
ψ2−ψ3 forψ < ψ2∧ψ > ψ3
(4)
4.2 Infiltration and surface runoff
The infiltration rate is computed with a semi-analytical solu-tion of the Richard’s equasolu-tion based on Smith and Parlange (1978):
f =Ksat
eF /B
eF /B−1 (5)
WithBdefinded as:
B=G(θs−θi) (6)
with
f = infiltration rate [cm d−1] F = cumulative infiltration [cm] G = capillary drive [hPa]
θs = saturated water content [cm3cm−3] θi = initial soil water content [cm3cm−3]
Ksat = effective saturated hydraulic conductivity
[cm d−1]
In order to take into account the high variability of the sat-urated conductivity, a log-normal distribution of the Ksat –
values is considered. A certain number of Ksat-values are
chosen using the Latin-Hypercube method (MacKay et al., 1979). For the determined values the Smith-Parlange equa-tion (Eq. 5) is calculated. The mean of all calculaequa-tions is considered as infiltration rate of the soil matrix.
4.3 Soil water fluxes
In this section the following terms are used:
θ = volumetric water content [cm3cm−3] ψ = matrix potential [hPa]
Q = Q(z,t) = sources and sinks [cm3cm−3d−1] z = depth under soil surface [cm]
K(θ ) = Kr Ksat= hydraulic water conductivity
[cm d−1]
Kr = relative hydraulic water conductivity [–]
Ksat = saturated hydraulic water conductivity
[cm d−1]
C(ψ ) = specific water capacity [cm3cm−3hPa−1] The soil water fluxes are calculated based on Richards’s equation:
C (ψ )∂ψ
∂t =
∂ ∂z
K (θ ) ∂
∂z(ψ−z)
+Q (7)
S. Giertz et al.: Physically-based hydrological modelling in Benin 835
(a) (b)
Figure 3a. Model concept of SIMULAT
[image:7.595.102.498.63.288.2]Figure 3b. Modification of SIMULAT to the hillslope version SIMULAT-H
Figure 4. Instrumentation of the Aguima catchment
Horizon 1
Horizon 2
Horizon 3
Interzeption Transpiration
Infiltration
Evaporation
Surface runoff
Interflow Soil water flux
Baseflow
Water uptake
surface runoff
baseflow interflow
Fig. 4. Instrumentation of the Aguima catchment.
Interflow
The interflow is considered as a sink in the Richard’s equa-tion. The lateral flow is the product of the lateral conductivity Ksat,latand the slopeα:
ql =Ksat,lat·sin(α) for ψ >0 (8)
with
ql = interflow [cm3cm−3d−1]
Ksat,lat = lateral saturated hydraulic water
conductivity [cm d−1]
α = slope [–]
5 Data base and model parameterization
As mentioned in Sect. 2, intensive field studies were carried out in the Aguima catchment, therefore a reliable database to parameterize and validate the physically-based model was available. In Fig. 4 the measuring sites relevant for this study are shown.
5.1 Model parameterization 5.1.1 Spatial discretization
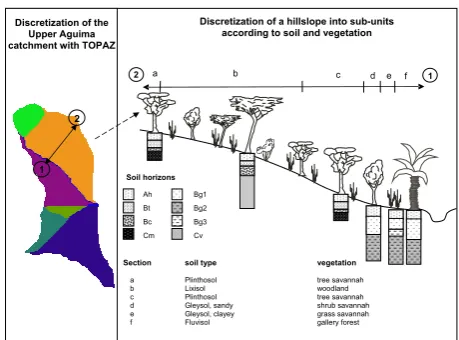
In order to apply SIMULAT-H according to the hillslope con-cept the catchment was discretized into hillslopes. This was performed with TOPAZ (Topographic Parametrization Tool) (Garbrecht and Martz, 1997), a tool for terrain analysis. The determination of sub-catchments and hillslopes were based on the calculated flow direction which is determined with the D8-Method (Fairchild and Leymarie, 1991). The discretized
Figure 5. Discretization of a representative hillslope of the Upper Aguima catchment
Figure 6. Comparison of the simulated and measured hydrograph of the Upper Aguima catchment, year 2002 (3.2 km2, calibration result)
Discretization of the Upper Aguima catchment with TOPAZ
b
a c d e f
Section soil type vegetation
a Plinthosol tree savannah
b Lixisol woodland
c Plinthosol tree savannah d Gleysol, sandy shrub savannah e Gleysol, clayey grass savannah f Fluvisol gallery forest
Ah Bt Bc Cm
Bg1 Bg2 Bg3 Cv
Soil horizons
2 1
Discretization of a hillslope into sub-units according to soil and vegetation
1 2
0 2 4 6 8 10 12
01
.01.02
01
.02.02
01
.03.02
01
.04.02
01
.05.02
01
.06.02
01
.07.02
01
.08.02
01
.09.02
01
.10.02
01
.11.02
01
.12.02
di
sc
ha
rge [mm/d]
0 20 40 60 80 100 120 140 160 180 200
pr
ec
ip
itat
io
n [
m
m
]
simulated measured
Fig. 5. Discretization of a representative hillslope of the Upper
Aguima catchment.
[image:7.595.313.543.341.511.2]Field observations revealed that during extreme precipitation events a high quantity of surface runoff concentrates on small tracks and flows rapidly into the river. To simulate this process, the percentage of tracks in the catchment, which was mapped using a GPS, was considered as separate subunit with a low permeability. The surface runoff occurring on this subunit was added directly to the river discharge during the simulation process.
5.1.2 Soil parameterization
For each soil unit classified in the soil map of Junge (2004) two representative soil profiles (one in natural savannah, one in agricultural area) were chosen for the determination of soil physical properties. As SIMULAT-H enables a variable hor-izontal discretization of the soil columns the determination of the physical properties was carried out for each horizon of the representative soil profiles. In each horizon two soil cores were taken for the measurement of the soil-water-retention curve and four samples for the determination of the saturated conductivity. In addition in-situ measurements of saturated conductivity were carried out on plots close to the represen-tative soil profiles. With the in-situ measurements a better representation of the soil surface characteristics was feasi-ble. In order to take into account the spatial variability of the saturated conductivity at least eight measurements were conducted on each plot. Depended on soil unit and vege-tation type the mean of the measured saturated conductivity was used for the parameterization of the soil of each hillslope unit.
5.1.3 Vegetation parameters
For each hillslope-unit several vegetation types can be de-fined. For each vegetation type interception, evapotranspi-ration and infiltevapotranspi-ration is calculated separately in the model. The water balance of the entire hillslope-unit is then calcu-lated depending on the ratio of the vegetation type on the hillslope-unit.
Based on the classification of the Landsat 7 ETM+ image (Judex, 2003) the different vegetation types were allocated to the hillslope-units with GIS.
The vegetation parameters (LAI, vegetation height, root depth etc.) were mainly taken from measurements in the Aguima catchment in the framework of the IMPETUS project (Orthmann, 2005; Mulindabigwi, 2005). The mea-surements were conducted at different times during the years 2001 and 2002. Therefore the variation of these parame-ters during the year was also taken into account. In case of missing or implausible measuring data literature data from Cournac et al. (2002), de Wasseige et al. (2003) and Scour-lock et al. (2001) were used for parameterization.
5.1.4 Climatic data
To obtain the required climate data for the model (temper-ature, relative humidity, wind velocity, global radiation and precipitation) the data of three climatic stations were avail-able in the Aguima catchment (Fig. 4). Additionally data from two rain gauges outside the catchment were obtained. This data was used to fill up gaps in the precipitation data during periods where the climatic stations had failed. 5.2 Validation data
To validate the model, measurement data of discharge, dis-charge components and soil moisture were used. As the wa-ter level gauges were installed in June 2001 the discharge data were obtainable from 2001 to 2003.
The discharge components for single events were deter-mined by measurements of electric conductivity at the river gauging station Upper Aguima and Upper Niaou. The mea-surements were performed during the rainy season of 2002 in a 10 min interval. Additionally, independent water anal-ysis data of Fass (2004) was used to validate the discharge components. Fass (2004) analysed the hydrochemistry of water samples from different sources (rain water, river wa-ter, groundwawa-ter, soil wawa-ter, saprolitic water) to determine the fraction of the different water types on the river dis-charge. The mixing-ratio of the river water was calculated with PHEREEQC-2 (Parkhurst and Appello, 1999) based on water samples taken during the rainy season of the years 2001 and 2002.
The soil moisture was measured with TDR-probes in four different depths (0–20, 30–50, 80–100, 120–140 cm) with an automatic data logger system with a temporal resolution of 10 min. Due to a failure of the measuring system, the soil moisture data was only available for 2001 and 2002.
6 Sensitivity analysis
The investigation concerning parameter sensitivity was per-formed for one representative slope of the Upper Aguima catchment. Mainly soil and vegetation parameters were taken into account.
To evaluate the sensitivity the sensitivity index SI10 was
calculated according to de Roo (1993):
SI10=
|OP10−OM10|
Oo
(9) with
OP10 = model output with a 10% increase
of the parameter value
OM10 = model output with a 10% reduction
of the parameter value
S. Giertz et al.: Physically-based hydrological modelling in Benin 837
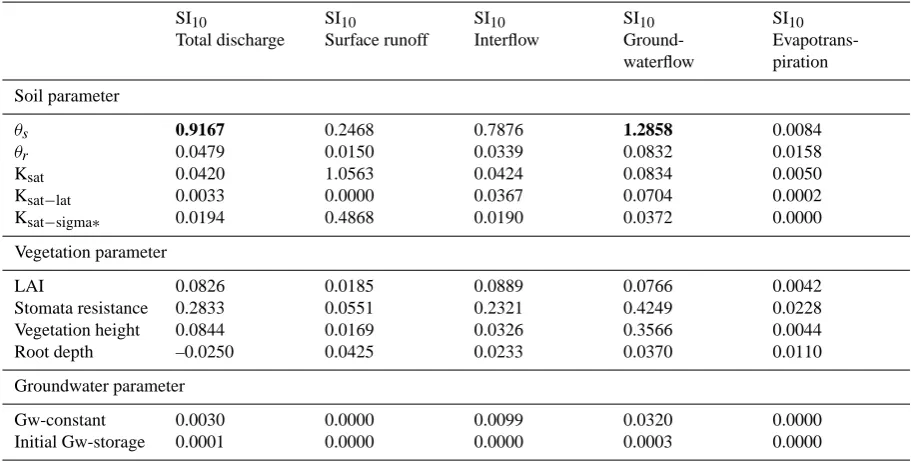
Table 4. Sensitivity indices SI10for different model parameters calculated for a representative hillslope (in bold the most sensitive
parame-ters).
SI10
Total discharge
SI10
Surface runoff
SI10 Interflow
SI10 Ground-waterflow
SI10 Evapotrans-piration Soil parameter
θs 0.9167 0.2468 0.7876 1.2858 0.0084
θr 0.0479 0.0150 0.0339 0.0832 0.0158
Ksat 0.0420 1.0563 0.0424 0.0834 0.0050
Ksat−lat 0.0033 0.0000 0.0367 0.0704 0.0002
Ksat−sigma∗ 0.0194 0.4868 0.0190 0.0372 0.0000
Vegetation parameter
LAI 0.0826 0.0185 0.0889 0.0766 0.0042
Stomata resistance 0.2833 0.0551 0.2321 0.4249 0.0228
Vegetation height 0.0844 0.0169 0.0326 0.3566 0.0044
Root depth –0.0250 0.0425 0.0233 0.0370 0.0110
Groundwater parameter
Gw-constant 0.0030 0.0000 0.0099 0.0320 0.0000
Initial Gw-storage 0.0001 0.0000 0.0000 0.0003 0.0000
[image:9.595.308.463.622.675.2]* Ksat−sigma: standard deviation of log-normal distribution of Ksat-values.
Table 4 shows the sensitivities for the chosen soil, vege-tation and groundwater parameters with regard to discharge, discharge components and evapotranspiration.
The sensitivity analysis reveals that among the soil eters the saturated water content is the most sensitive param-eter concerning the total discharge and the groundwater flow. Regarding the vegetation parameters the stomata resistance is the most sensitive parameter.
7 Calibration and validation of the model SIMULAT-H
7.1 Model performance criteria
In order to evaluate the model performance for the calibra-tion and the validacalibra-tion the following criteria were taken into account:
1. the coefficient of determination r2
2. the coefficient of model efficiency (Nash and Sutcliff, 1970)
3. the index of agreement (Willmott, 1981)
4. for the discharge validation: the difference between the simulated and measured annual discharge amount
The model efficiency according to Nash and Sutcliff (1970) is defined as:
ME=
n P
i=1
(xi− ¯x)2− n P
i=1
x10−xi
2
n P
i=1
(x1− ¯x)2
(10)
xi = measured variable
¯
x = arithmetic mean of xifor all events, i = 1 to n xi0 = simulated variable
The model efficiency can attain values from -∞to 1. The value of 1 indicates the total agreement of measured and sim-ulated values.
In addition to r2and the model efficiency, which are usu-ally used as objective functions for model validation, the in-dex of agreement according to Willmott (1981) is applied. This index is a good indicator to evaluate the temporal repre-sentation of the discharge by the model. It is calculated with the following equation:
I A=1−
n P
i−1
(xi−xi0)2
n P
i=1
|xi − ¯x0| +
xi0− ¯x0
2
(11)
838Figure 5. Discretization of a representative hillslope of the Upper Aguima catchment S. Giertz et al.: Physically-based hydrological modelling in Benin
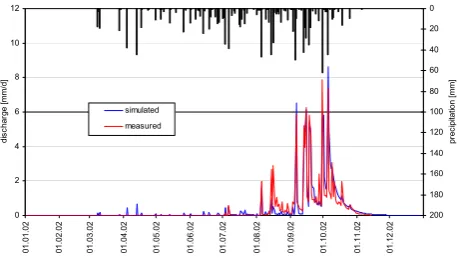
Figure 6. Comparison of the simulated and measured hydrograph of the Upper Aguima catchment, year 2002 (3.2 km2, calibration result)
Upper Aguima catchment with TOPAZ
b
a c d e f
Section soil type vegetation
a Plinthosol tree savannah
b Lixisol woodland
c Plinthosol tree savannah d Gleysol, sandy shrub savannah e Gleysol, clayey grass savannah f Fluvisol gallery forest
Ah Bt Bc Cm
Bg1 Bg2 Bg3 Cv
Soil horizons
2 1
according to soil and vegetation
1 2
0 2 4 6 8 10 12
01
.01.02
01
.02.02
01
.03.02
01
.04.02
01
.05.02
01
.06.02
01
.07.02
01
.08.02
01
.09.02
01
.10.02
01
.11.02
01
.12.02
di
sc
ha
rge [mm/d]
0
20
40
60
80
100
120
140
160
180
200
pr
ec
ip
itat
io
n [
m
m
]
simulated measured
Fig. 6. Comparison of the simulated and measured hydrograph of
the Upper Aguima catchment, year 2002 (3.2 km2, calibration re-sult).
7.2 Calibration of the model
The model was manually calibrated for the year 2002 for the Upper Aguima catchment for the river discharge. As nearly all input parameters were determined by field measurements only the parameters of the conceptual groundwater model and the lateral Ksat-value were calibrated. The lateral
satu-rated conductivity was not calibsatu-rated for each soil separately. Instead an overall reduction factor was determined in relation to the measured vertical Ksat-value. The optimal factor was
identified by comparing the measured and simulated hydro-graphs.
Figure 6 shows the result of the simulated hydrograph compared with the measured discharge. Only in the begin-ning of the discharge period major differences between mea-sured and simulated discharge are observable. This is due to the fact that the runoff at the beginning of the rainy season in-filtrates in the river bed and fills up the groundwater storage. Because the conceptual groundwater model is not spatially distributed, the infiltration of river discharge into groundwa-ter can not be computed correctly. In the remaining period the agreement of the simulated and measured hydrographs is good. The discharge peaks as well as the recession period fit to the measured values. The model efficiency and the r2 attain 0.82, while the index of agreement has a value of 0.95. The total discharge is slightly overestimated by the model (109 mm measured, 117 mm simulated).
7.3 Model validation
Due to a good database, a multicriteria validation of the model was feasible. In addition to discharge data, discharge components and soil moisture data, which were not used for calibration, were available to validate the model results. 7.3.1 Validation of discharge
The validation of the model was performed with the split sample and the proxy basin test according to Refsgaard and Storm (1996).
Table 5. Model validation Lower Aguima catchment.
Q measured Q simulated ME r2 IA
[mm] [mm]
2001* 45.5 47.4 0.82 0.82 0.95
2002 139.6 132.5 0.86 0.87 0.96
2003 183.3 254.7 0.64 0.67 0.87
* Simulated period: 20 June 2001–31 December 2001.
For the proxy basin test the model was applied in the 16 km2 sized Lower Aguima catchment without further ad-justing of parameters for 2002. For the split sample test the simulation was applied for the years 2001 and 2003 in the Upper and Lower Aguima and the Upper Niaou catchments. Proxy basin test
The scatter plot in Fig. 7 shows the comparison of measured and simulated discharge on daily basis for the years 2001, 2002 and 2003. The criteria for the model performance of the simulated years are shown in Table 5. For the year 2002 the correspondence of the simulated and measured discharge is given in Fig. 8. There is a slight underestimation of the discharge amount for the whole year but the model efficiency and the r2are even higher than for the calibration period (Ta-ble 5). Compara(Ta-ble to the calibration period the major differ-ences between the measured and modelled hydrograph can be observed in the beginning of the discharge period where the baseflow is underestimated, while discharge peaks are of-ten overestimated. In the middle of the rainy season the peaks as well as the baseflow are modelled well and also the reces-sion of the discharge is simulated accurately.
Split sample test
The model was applied with the same parameter set for the years 2001 and 2003 to perform the split sample test for all considered catchments.
The diagram of the model validation in the Lower Aguima catchment for the year 2001 in Fig. 9 shows that the agree-ment of simulated and measured discharge is good. The dis-charge peak at the end of September and also the baseflow are simulated well in 2001. Due to the reason explained be-fore, in the beginning of the rainy season small discharge peaks are simulated, although no discharge was measured at all. The model efficiency and the r2are 0.82, while an index of agreement of 0.95 is achieved. The measured discharge amount is slightly underestimated by the model (2 mm).
[image:10.595.312.542.89.157.2]S. Giertz et al.: Physically-based hydrological modelling in Benin 839
Table 6. Model validation for the Upper Aguima and Upper Niaou
catchments.
Upper Aguima
Q measured Q simulated ME r2 IA
[mm] [mm]
2001* 23.0 40.2 0.67 0.78 0.87
2002 C 109.2 117.2 0.82 0.82 0.95
2003 196.1 225.1 0.42 0.53 0.84
Upper Niaou
Q measured Q simulated ME r2 IA
[mm] [mm]
2001* 155.8 187.5 0.42 0.49 0.84
2002 183.5 202.1 0.67 0.71 0.91
2003 230.6 265 0.58 0.66 0.89
* Simulated period: 20 June 2001–31 December 2001. C = Cali-bration period.
Figure 7. Scatter plot of simulated and measured discharge for the Lower Aguima catchment
(16.5 km
2, validation results)
Figure 8. Comparison of the simulated and measured hydrograph of the Lower Aguima
catchment, year 2002 (16.5 km
2, validation result, proxi-basin test)
0 2 4 6 8 10
0 2 4 6 8 10
measured [mm] si m ul at ed [m m ] 2001 2002 2003 0 2 4 6 8 10 12 01 .0 1. 02 01 .0 2. 02 01 .0 3. 02 01 .0 4. 02 01 .0 5. 02 01 .0 6. 02 01 .0 7. 02 01 .0 8. 02 01 .0 9. 02 01 .1 0. 02 01 .1 1. 02 01 .1 2. 02 di sc har ge [mm/ d] 0 20 40 60 80 100 120 140 160 180 200 pr ec ip itati on [mm] simulated measured
Fig. 7. Scatter plot of simulated and measured discharge for the
Lower Aguima catchment (16.5 km2, validation results).
Due to a failure of the measuring system, the precipita-tion data for the climatic staprecipita-tion within the Aguima catch-ment were not available for part of the year of 2003. There-fore measurements from the pluviometers outside the catch-ment were used as input-data. The high spatial variability of rainfall events caused poor simulation of certain events. This is documented by the rainfall event of 15 August 2003, where the highest discharge peak of the year was measured while nearly no precipitation was recorded by the pluviome-ters. Consequently the model underestimates the discharge for this event. Concerning the representation of the
base-Figure 7. Scatter plot of simulated and measured discharge for the Lower Aguima catchment (16.5 km2, validation results)
Figure 8. Comparison of the simulated and measured hydrograph of the Lower Aguima catchment, year 2002 (16.5 km2, validation result, proxi-basin test)
0 2 4 6 8 10
0 2 4 6 8 10
measured [mm] si m ul at ed [m m ] 2001 2002 2003 0 2 4 6 8 10 12 01 .0 1. 02 01 .0 2. 02 01 .0 3. 02 01 .0 4. 02 01 .0 5. 02 01 .0 6. 02 01 .0 7. 02 01 .0 8. 02 01 .0 9. 02 01 .1 0. 02 01 .1 1. 02 01 .1 2. 02 di sc har ge [mm/ d] 0 20 40 60 80 100 120 140 160 180 200 pr ec ip itati on [mm] simulated measured
Fig. 8. Comparison of the simulated and measured hydrograph of
the Lower Aguima catchment, year 2002 (16.5 km2, validation re-sult, proxi-basin test).
Figure 9. Comparison of the simulated and measured hydrograph of the Lower Aguima catchment, year 2001 (16.5 km2, validation result, proxy-basin and split-sample test)
Figure 10. Comparison of the simulated and measured hydrograph of the Lower Aguima catchment, year 2003 (16.5 km2, validation result, proxi-basin and split-sample test)
0 1 2 3 4 5 6 7 20 .0 6. 01 04 .0 7. 01 18 .0 7. 01 01 .0 8. 01 15 .0 8. 01 29 .0 8. 01 12 .0 9. 01 26 .0 9. 01 10 .1 0. 01 24 .1 0. 01 07 .1 1. 01 21 .1 1. 01 05 .1 2. 01 19 .1 2. 01 di sc ha rg e [ m m/ d] 0 20 40 60 80 100 120 140 160 180 pr ec ip ita tio n [ m m ] simulated measured 0 2 4 6 8 10 12 14 01. 01 .0 3 01. 02 .0 3 01. 03 .0 3 01. 04 .0 3 01. 05 .0 3 01. 06 .0 3 01. 07 .0 3 01. 08 .0 3 01. 09 .0 3 01. 10 .0 3 01. 11 .0 3 01. 12 .0 3 di sc har ge [ m m /d] 0 20 40 60 80 100 120 140 160 180 200 pr ec ip itat ion [ m m ] simulated measured
Fig. 9. Comparison of the simulated and measured hydrograph of
the Lower Aguima catchment, year 2001 (16.5 km2, validation re-sult, proxy-basin and split-sample test).
flow the simulation shows good results. The model efficiency (0.64) and the r2(0.67) are lower than for the years 2001 and 2002.
Further validation of discharge was performed for the per Aguima catchment (2001 and 2003) and for the Up-per Niaou catchment (2001–2003). The results are summa-rized in Table 6. Comparable to the validation in the Lower Aguima catchment best results were obtained for the year 2002. Due to the uncertainties of the precipitation data the model performance is lower in 2003.
7.3.2 Validation of discharge components
As explained in Sect. 5.2 the water analysis data of Fass (2004) were used to validate the discharge components.
The following mixing-ratio was determined by Fass (2004):
– 73% surface water and soil water
– 25% groundwater of the saprolitic zone
– 2% deep groundwater
This ratio is an average value for all rivers of the catchment. Due to the low sampling number, a determination of the ratio for each river was not feasible.
Table 7. Simulated discharge components [%].
Upper Aguima Lower Aguima Upper Niaou Mean
2001 2002 2001 2002 2001 2002 2001+2002
Surface runoff 14 15 8 10 24 13 14
Interflow 64 59 43 39 58 67 55
Groundwater 22 26 48 51 18 20 31
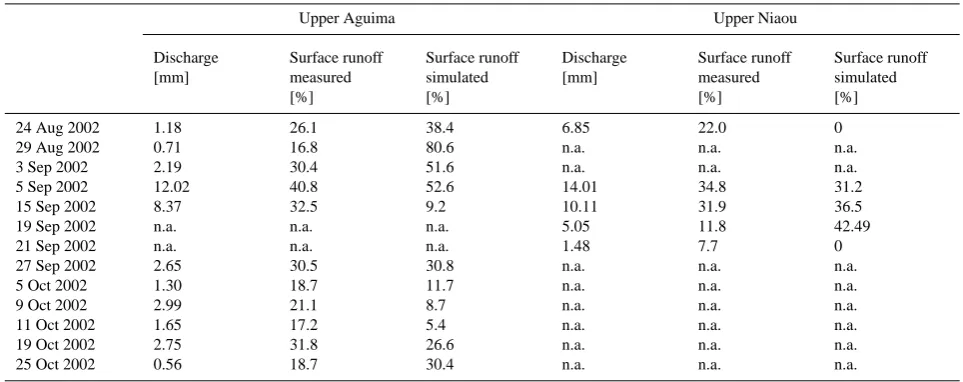
Table 8. Measured (= determined with Eq. 12) and simulated surface runoff for the Upper Aguima and the Upper Niaou catchments for
runoff events in the rainy season 2002.
Upper Aguima Upper Niaou
Discharge [mm] Surface runoff measured [%] Surface runoff simulated [%] Discharge [mm] Surface runoff measured [%] Surface runoff simulated [%]
24 Aug 2002 1.18 26.1 38.4 6.85 22.0 0
29 Aug 2002 0.71 16.8 80.6 n.a. n.a. n.a.
3 Sep 2002 2.19 30.4 51.6 n.a. n.a. n.a.
5 Sep 2002 12.02 40.8 52.6 14.01 34.8 31.2
15 Sep 2002 8.37 32.5 9.2 10.11 31.9 36.5
19 Sep 2002 n.a. n.a. n.a. 5.05 11.8 42.49
21 Sep 2002 n.a. n.a. n.a. 1.48 7.7 0
27 Sep 2002 2.65 30.5 30.8 n.a. n.a. n.a.
5 Oct 2002 1.30 18.7 11.7 n.a. n.a. n.a.
9 Oct 2002 2.99 21.1 8.7 n.a. n.a. n.a.
11 Oct 2002 1.65 17.2 5.4 n.a. n.a. n.a.
19 Oct 2002 2.75 31.8 26.6 n.a. n.a. n.a.
25 Oct 2002 0.56 18.7 30.4 n.a. n.a. n.a.
[image:12.595.57.539.228.419.2]n.a.: no data available
Figure 9. Comparison of the simulated and measured hydrograph of the Lower Aguima catchment, year 2001 (16.5 km2, validation result, proxy-basin and split-sample test)
Figure 10. Comparison of the simulated and measured hydrograph of the Lower Aguima catchment, year 2003 (16.5 km2, validation result, proxi-basin and split-sample test)
0 1 2 3 4 5 6 7 20 .0 6. 01 04 .0 7. 01 18 .0 7. 01 01 .0 8. 01 15 .0 8. 01 29 .0 8. 01 12 .0 9. 01 26 .0 9. 01 10 .1 0. 01 24 .1 0. 01 07 .1 1. 01 21 .1 1. 01 05 .1 2. 01 19 .1 2. 01 di sc ha rg e [ m m/ d] 0 20 40 60 80 100 120 140 160 180 pr ec ip ita tio n [ m m ] simulated measured 0 2 4 6 8 10 12 14 01. 01 .0 3 01. 02 .0 3 01. 03 .0 3 01. 04 .0 3 01. 05 .0 3 01. 06 .0 3 01. 07 .0 3 01. 08 .0 3 01. 09 .0 3 01. 10 .0 3 01. 11 .0 3 01. 12 .0 3 di sc har ge [ m m /d] 0 20 40 60 80 100 120 140 160 180 200 pr ec ip itat ion [ m m ] simulated measured
Fig. 10. Comparison of the simulated and measured hydrograph
of the Lower Aguima catchment, year 2003 (16.5 km2, validation result, proxi-basin and split-sample test).
The simulated discharge components of SIMULAT-H for the different river gauges are shown in Table 7 for the years 2001 and 2002. The simulated groundwater ratio for all con-sidered gauges of 31% is very close to the ratio determined by the hydrochemical measurements (27%). Consequently the correspondence of the modelled and measured surface and soil water fraction is also good.
Additionally a validation of the discharge components was performed for single events based on continuous measure-ments of electric conductivity of the river water during the rainy season 2002. The separation of surface runoff from the baseflow was calculated with the following equation:
qr =(cd−cb)· qd
(cp−cb) (12)
with
qr = surface runoff [l/sec]
qd = river discharge [l/sec]
cd = electric conductivity of the river discharge [µs/cm]
cb = electric conductivity of the baseflow [µs/cm]
cp = electric conductivity of the precipitation [µs/cm]
[image:12.595.54.283.466.572.2] [image:12.595.306.534.528.656.2]S. Giertz et al.: Physically-based hydrological modelling in Benin 841
Figure 11. Scatter plot of simulated and measured (= determined with Eq. (12)) surface runoff
for the Upper Aguima (3.2 km
2) and the Upper Niaou (3.1 km²) for runoff events in the rainy
season 2002 (in % of the total discharge)
010 20 30 40 50 60 70 80 90
0 10 20 30 40 50 60 70 80 90
measured surface runoff
si
mul
ated s
ur
fa
ce
runo
ff
_
Upper Aguima
Upper Niaou
Fig. 11. Scatter plot of simulated and measured (= determined with
[image:13.595.94.240.374.527.2]Eq. 12) surface runoff for the Upper Aguima (3.2 km2)and the Up-per Niaou (3.1 km2)for runoff events in the rainy season 2002 (in % of the total discharge).
Table 9. Validation of soil moisture at different depths for a Lixisol
with woodland vegetation in the Upper Aguima catchment.
ME r2 IA
2001
0–20 cm 0.86 0.95 0.97
30–50 cm 0.55 0.86 0.91
80–100 cm –0.25 0.57 0.45 120–140 cm 0.51 0.79 0.88 2002
0–20 cm 0.72 0.94 0.95
30–50 cm 0.71 0.94 0.94
80–100 cm 0.57 0.81 0.85
120–140 cm 0.19 0.54 0.76
Figure 11 shows the scatterplot of simulated and “mea-sured” (=calculated with Eq. 12) surface runoff for recorded discharge peaks during the rainy season 2002. Considering all the above mentioned uncertainties, the correspondence between the simulated and “measured” surface runoff is rel-atively good for the Upper Aguima catchment. Only for one event the surface runoff is strongly overestimated. For the other events under- and overestimation is observable. As shown in Table 8 no dependency of the over-/underestimation on discharge amount is obvious. Due to a failure of the conductivity probes only measurements of a few peaks were available for the surface runoff validation in the Upper Niaou catchment. For the discharge events in the beginning and
Figure 12. Comparison of simulated and measured soil moisture at different depths for a Lixisol with woodland vegetation in the Upper Aguima catchment, year 2001 (missing data: failure of measuring system)
0 - 20 cm
0 5 10 15 20 25 30 35
[V
ol
-%
]
measured simulated
30 - 50 cm
0 5 10 15 20 25 30
[V
ol
-%
]
80 - 100 cm
0 5 10 15 20 25 30 35
[V
ol
-%
]
120 - 140 cm
0 5 10 15 20 25 30 35 40
20.06.01 26.06.01 02.07.01 08.07.01 15.07.01 21.07.01 27.07.01 02.08.01 09.08.01 15.08.01 21.08.01 27.08.01 02.09.01 09.09.01 15.09.01 21.09.01 28.09.01 04.10.01 10.10.01 16.10.01 23.10.01 29.10.01 04.11.01 10.11.01 17.11.01
[V
ol
-%
]
0 5 10 15 20 25
pr
ec
ip
itati
on [
m
m/h]
Fig. 12. Comparison of simulated and measured soil moisture at
different depths for a Lixisol with woodland vegetation in the Upper Aguima catchment, year 2001 (missing data: failure of measuring system).
the middle of September the agreement is good, but for the events of the 24 August 2002 and the 21 September 2002 no surface runoff was simulated by the model, while the mea-surements determined surface runoff. The poor model per-formance for the event of the 24 August 2002 could be ex-plained with high amount of runoff on the pathways. Al-though the pathways were taken into account in the simu-lation, the process of surface runoff flowing from fields to pathways was not considered in the model. Consequently the direct runoff from pathways to the river was underesti-mated. In general the model performance for the discharge is relatively poor in August (see Figs. 6 and 8).
80 - 100 cm
0 5 10 15 20 25 30 35
[V
ol
-%
]
30 - 50 cm
0 5 10 15 20 25 30
[V
ol
-%
]
0 - 30 cm
0 5 10 15 20 25 30 35
[Vo
l-%
]
measured simulated 0
20 40 60 80
pr
ec
ip
itati
on [m
m/h]
120 - 140 cm
0 5 10 15 20 25 30 35 40
01.01
.02
17.01
.02
03.02
.02
20.02
.02
08.03
.02
25.03
.02
11.04
.02
27.04
.02
14.05
.02
31.05
.02
16.06
.02
03.07
.02
20.07
.02
05.08
.02
22.08
.02
07.09
.02
24.09
.02
11.10
.02
28.10
.02
13.11
.02
30.11
.02
17.12
.02
[V
ol
-%
[image:14.595.55.283.66.410.2]]
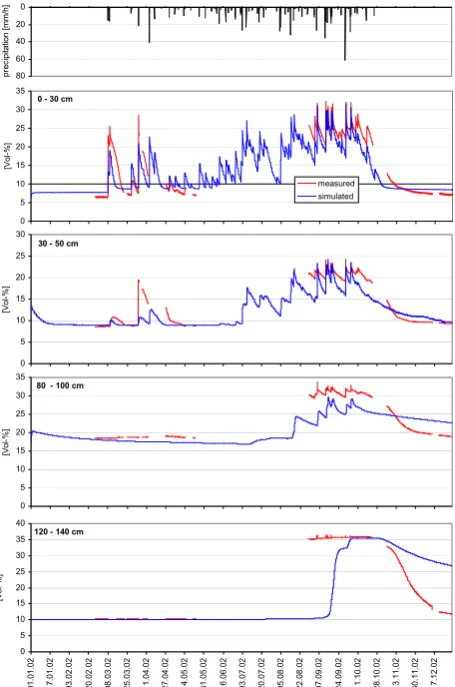
Figure 13. Comparison of simulated and measured soil moisture at different depths for a Lixisol with woodland vegetation in the Upper Aguima catchment, year 2002 (missing data: failure of measuring system)
Fig. 13. Comparison of simulated and measured soil moisture at
different depths for a Lixisol with woodland vegetation in the Upper Aguima catchment, year 2002 (missing data: failure of measuring system).
7.3.3 Validation of soil moisture
The validation of the soil moisture was carried out for the Upper Aguima catchment by comparing the simulated soil moisture of different depth with the soil moisture measure-ments with TDR-probes of the same depth. The validation was performed for a Lixisol with woodland vegetation for the years 2001 and 2002 as nearly no measurement values were available for 2003 due to a failure of the measuring system.
The soil hydrological parameters Ksat,θs,θr and Brooks
and Corey parameters used for the simulation were taken from measurements without additional calibration. Because the soil moisture data were not used for the calibration of the model also the data from 2002 can be used for validation. The comparison of measured and simulated soil moisture is shown in Figs. 12 and 13.
In both years the agreement between simulated and mea-sured soil water dynamic in the depth of 0–30 cm is good.
The peaks as well as the drying of the soil at the end of the rainy season are simulated well. For both years the r2 and the index of agreement are larger than 0.94 (Table 9), while a model efficiency of 0.86 for the year 2001 and of 0.72 for the year 2002 was achieved. For the layer 30–50 cm the model performance is lower. While the dynamic of the soil mois-ture is well reproduced by the model, the agreement of the simulated and measured soil moisture peaks are poorer than in the first layer. Overall the results are reasonable for this layer. As shown in Figs. 12 and 13 and in Table 9 the sim-ulation result of the Btc-horizon (80–100 cm) is poor. This could be explained by the high gravel content of this layer, which causes inaccuracies in the TDR-measurements and for the determination of the soil-water-retention curve.
In the saprolitic layer (120–140 cm) the constant soil wa-ter content of 10% in the beginning of the rainy season is well simulated in 2002. In 2001 the saturation of the sub-soil is a very rapid process, which is not simulated accu-rately by the model. According to the measurements the soil moisture increases from 10 to 35% during one day in 2001, which is caused by preferential flow in continuous macrop-ores. Calculating the amount of water required for saturating the soil in this depth it became clear that this is a local scale phenomenon. As there is no macropore-model available in SIMULAT-H the model is not able to simulate this process.
8 Representation of the runoff generation processes
The characterization of the major soil types with regard to the runoff generation processes in Sect. 3 has shown that the soil physical properties differs strongly for the subsoil of the dominant soil types (Plinthosol, Lixisol/Acrisol, Gleysol). The runoff generation processes based on the soil investiga-tions and field observainvestiga-tions are explained in Sect. 3. The model concept of SIMULAT-H allows the quantification of the runoff generation processes for each soil unit of the hillslope. Figure 14 shows the runoff generation for 2002 for one representative slope of the Upper Aguima and Fig. 15 for the Upper Niaou catchment.
S. Giertz et al.: Physically-based hydrological modelling in Benin 843
Figure 14. Simulated runoff generation processes [%] for a representative hillslope of the Upper Aguima catchment (natural vegetation)
Figure 15. Simulated runoff generation processes [%] for a representative hillslope of the Upper Niaou catchment (agriculture)
Explanation of the substrate types in Fig. 14. 0 %
2.4 %
97.6 %
24.9 % 27.4 %
47.6 %
0 % 6.5 %
93.5 %
87.8 % 0.3 %
11.9 %
80.0 % 0.3 %
19.7 %
0.6 % 4.1 %
95.3 %
main process sub-process negligible process
Plinthosol Lixisol/
Acrisol Plinthosol Gleysol, sandy Gleysol,
clayey Fluvisol
main process sub-process negligible process
13.5 % 16.2 %
70.2 %
12.6 84.3 %
3.1 %
52.4 % 12.7 %
34.8 %
40.6 % 59.4 %
0 % Lixisol/
Acrisol Plinthosol Gleysol, sandy Gleysol, clayey Hillwash
Colluvium Alluvium
Plinthtitic gravel Hardened Plinthite Saprolite Substrate type
Fig. 14. Simulated runoff generation processes [%] for a
representa-tive hillslope of the Upper Aguima catchment (natural vegetation).
This is caused by the extremely high saturated conductivity which was determined for a cashew plantation in the Upper Niaou on this soil type (Giertz and Diekkr¨uger, 2003).
Concerning the runoff generation processes the simulation results confirm the findings of the field measurements pre-sented in perceptual model in Sect. 3. The major runoff gen-eration process on the upper and middle hillslope of the Up-per Aguima catchment is interflow, which was determined by the simulation and the perceptual model. Dependent on the land cover, surface runoff or interflow are predominant for Plinthosols and Lixisols/Acrisols for the same slope section. At the bottom of the slope groundwater recharge is an impor-tant process, due to high permeability of the Gleysols. In the Upper Niaou also surface runoff occurs due to a high amount of surface runoff from the upper slope soil units.
9 Discussion of uncertainties
Generally three sources of uncertainties in the modelling pro-cess can be distinguished:
1. Input parameter
2. Model assumptions and algorithms for process descrip-tion
3. Measuring data for model validation 9.1 Input parameter
Due to the interdisciplinary research in the Aguima catch-ment, the database to parameterize the model was very good for West African conditions. Consequently the uncertainties related to the input parameters are relatively low.
Concerning vegetation parameters measurement data of LAI and vegetation height were available from studies of Orthmann (2005) and Mulindabigwi (2005). The LAI mea-surements of the natural vegetation of Orthmann (2005) were carried out with hemispherical photographs. With this tech-nique only the LAI of the canopy can be estimated. Therefore
Figure 14. Simulated runoff generation processes [%] for a representative hillslope of the Upper Aguima catchment (natural vegetation)
Figure 15. Simulated runoff generation processes [%] for a representative hillslope of the Upper Niaou catchment (agriculture)
Explanation of the substrate types in Fig. 14.
0 % 2.4 %
97.6 %
24.9 % 27.4 %
47.6 %
0 % 6.5 %
93.5 %
87.8 % 0.3 %
11.9 %
80.0 % 0.3 %
19.7 %
0.6 % 4.1 %
95.3 % main process
sub-process negligible process
Plinthosol Lixisol/
Acrisol Plinthosol Gleysol, sandy
Gleysol,
clayey Fluvisol
main process sub-process negligible process 13.5 %
16.2 %
70.2 %
12.6 84.3 %
3.1 %
52.4 % 12.7 %
34.8 %
40.6 % 59.4 %
0 %
Lixisol/
Acrisol Plinthosol Gleysol, sandy
Gleysol, clayey Hillwash
Colluvium Alluvium
Plinthtitic gravel Hardened Plinthite Saprolite
Substrate type
Fig. 15. Simulated runoff generation processes [%] for a
represen-tative hillslope of the Upper Niaou catchment (agriculture). Expla-nation of the substrate types in Fig. 14.
a correction was necessary for vegetation types with a dense herb layer using mainly data from Scourlock et al. (2001). In general the estimation of the LAI for vegetation units is prob-lematic in hydrologic modelling. But the sensitivity analysis showed that the impact of this parameter on the output of the model is relatively low.
The stomata resistance was taken from literature data. As the sensitivity for this parameter is relatively high (see Tab. 4), the uncertainty caused by these parameters is relatively high compared to the other parameters.
The spatial distribution of the land cover types was taken from the land cover classification of Landsat ETM scenes by Judex (2003). Due to detailed ground-truth data the quality of the classification is very good for West African conditions. Because of the high heterogeneity of the vegetation types it is very difficult to carry out a classification in this region. Es-pecially for agricultural area a distinction between different crops in the Landsat image is not feasible because of mixed cultivation and very small size of fields. Therefore only one agricultural class was defined. The characterisation of one land cover class with one parameter set is problematic be-cause of the high heterogeneity of the land cover within one class.
Soil physical parameters were available from in-situ and laboratory measurements (Giertz, 2004, Junge, 2004, Giertz et al., 2005). In total 123 in-situ and 335 laboratory measure-ments were carried out for the determination of the saturated conductivity, which can vary significantly in space. Due the high spatial variability of this parameter the infiltration pro-cess within one soil unit cannot be simulated accurately us-ing one mean value for each hillslope unit. The approach of SIMULAT-H to cope with this problem is to use a certain number of Ksat-values for each soil unit, which are
[image:15.595.53.284.65.200.2]As the lateral saturated conductivity is very difficult to de-termine and no literature data were available this parame-ter was calibrated by comparing the measured and simulated hydrograph. In general it is assumed that the lateral Ksatis
lower than the vertical because the formation of macropore system is more vertically oriented. With calibration of the lateral saturated conductivity a reduction factor of 0.1 in re-lation to the vertical Ksat was determined. It is difficult to
assess if this factor is correct because no measurements are available. But the simulated processes seemed to be reason-able compared to the observed hydrologic processes in the catchment. The sensitivity analysis revealed that the influ-ence of the lateral Ksaton the discharge amount is relatively
low. Regarding the discharge components the influence of this parameter can be of higher importance.
The highest sensitivity index was determined for the sat-urated water content. But as this parameter was measured on soil cores and the spatial variability of this parameter is low compared to the saturated conductivity the uncertainty related with this parameter is relatively low.
As climate data was available from measurements in the catchment, the uncertainties related to this data are low. For West African conditions the existence of 3 climatic stations in a small basin of 30 km2is exceptional. Only six climatic stations of the national meteorological service exist for entire Benin.
Due to a failure of the measuring system more uncertain-ties are related to the precipitation data for 2003, because data from rain gauges outside the catchment had been used as model input.
For the groundwater parameters no measurement data was available, hence these parameters were calibrated for the catchment. The sensitivity analysis pointed out that the in-fluence of these parameters on the model result is low. 9.2 Model assumptions and algorithms for process
descrip-tion
In general the model related uncertainties are lower for physically-based models than for conceptual or empirical models. As pointed out in Sect. 8, SIMULAT-H is able to correctly simulate the runoff generation processes in the catchment. Therefore it can be assumed that the uncertain-ties related to the process description in general are low. But the validation of the soil moisture revealed that some details such as the saturation of the sub-soil are not correctly simu-lated by the model. This is caused by the lack of a macro-pore model in SIMULAT-H. As macromacro-pores play an impor-tant role for soil water fluxes in the catchment (Giertz, 2004; Giertz et al. 2005), neglecting the macropores can cause a poorer representation of the processes. An integration of this could ameliorate the model performance.
Another model related uncertainty is the lack of a routing-routine in SIMULAT-H. As the results were validated on a daily time step and the regarded catchments are small, the
inaccuracy caused by this is relatively small. For the valida-tion of single events as performed in Vertessy and Elsenbeer (1999) the lack of a routing-routine would have a stronger influence on the model result.
The analysis of the hydrologic processes revealed that the process of reinfiltration of the surface runoff within one hill-slope is significant in the Aguima catchment (Giertz, 2004). The importance of this process was also observed by van de Giesen et al. (2000) in a catchment in central Cˆote d’Ivoire. In order to take this process into account the hillslope ap-proach was integrated in SIMULAT–H. Reinfiltration can also occur within the same hillslope-unit, which is not im-plied in the model. But the high spatial variability of the infiltration process is taken into account using multiple Ksat
-values for the calculation of the infiltration rate.
As already mentioned in Sect. 7 the poor representation of surface runoff generation on pathways is one model related uncertainty. Most of all the process of surface runoff run-ning from fields on the pathways is poorly represented in the model. But it has to be noticed that parameterization is dif-ficult to perform because these pathways are spontaneously built by the local farmers.
Although the model SIMULAT-H implies some simplifi-cations in the process description the process representation is quite good, as shown in Sect. 7.
9.3 Measuring data for model validation
Compared to other studies, the database for model validation was good, as in addition to discharge also discharge compo-nents and soil moisture data were available for model valida-tion.
In general all measurements contain measurement errors, which have to be taken into account while using this data for validation.
Discharge data
The discharge was calculated based on continuous water level measurements and a stage-discharge relationship for each gauge. The latter was obtained by numerous dis-charge measurements in 2001 and 2002 with the cross sec-tion method (Davie, 2003) at different water levels. Although this method is related with uncertainties, it is the standard-method for discharge measurements, because other standard-methods for continuous discharge measurements are not available.
One uncertainty of this method is the possible change in the morphology of the riverbed caused by erosion and sedi-mentation processes, which can influence the stage-discharge relationship.
S. Giertz et al.: Physically-based hydrological modelling in Benin 845 Consequently the calculated peak discharge is very
uncer-tain.
As shown in Sect. 8 the representation of the peak dis-charge is very good for the year 2002. In 2003, no addi-tional discharge measurements were carried out to complete the stage-discharge relationship. Consequently for this year higher uncertainties concerning the discharge data are ex-pectable.
The validation of simulated surface runoff of single peaks was performed using measurement data of electric tivity. The calculation of the surface runoff from the conduc-tivity data is based on Eq. (12). The assumption is that the conductivity of the discharge is a mixture of baseflow and surface runoff, which has a lower conductivity as the base-flow. The uncertainty in this assumption is that in addition to the surface runoff, the quick interflow can reduce the electric conductivity of the discharge. But if the residence time of the water in the soil is low or if the water runs in macropores to the river the electric conductivity is comparable with the surface runoff.
Soil moisture
TDR-probes are a standard measuring instrument for the de-termination of soil moisture. The accuracy of the soil mois-ture measurements is very high, with the exception of soils with a very high humus content, salinity or density. Mea-surement errors also occur when the contact between the soil matrix and the probe is poor. This is often the case in soils with high gravel content. As the sub-soil of the Lixisol, where the measurements of soil moisture were carried out in the Aguima catchment, is characterized by a high gravel content, the possible measurement error has to be taken into account when using this data for model validation. The com-parison of simulated and measured soil moisture in this layer has shown a poor agreement. One reason for this could be possible errors in the measurement data as explained before. The discussion of the uncertainties pointed out that at all levels (input data, model assumptions and validation data) uncertainties exist. Often it is not possible to determine which uncertainties cause the deviation between modelled and measured state variables. By calibration often uncertain-ties are reduced due to the wrong reason. Because in this study only two parameters have been calibrated, the uncer-tainties were better identifiable.
10 Conclusions
The validation of the physically-based model SIMULAT-H has shown that the model concept is suitable to simulate the hydrological processes in a tropical environment. For the dis-charge validation good results were achieved for dry and wet years. Main differences were observable in the beginning of the rainy season. This was also observed for application
of other hydrological models in similar climate conditions (Campling et al., 2002; Varado, 2004).
The comparison of the discharge components determined by hydrochemical measurements with the simulation re-vealed that the model simulated the ratio of groundwater and surface water correctly. For the validation of the discharge components of single events larger differences were observ-able, which was partly caused by uncertainties in the precip-itation data. For one event the reason for the lack of sur-face runoff was rather the insufficient representation of the runoff generation processes on pathways. First modifications of the modelling process have shown that the assumption that a higher proportion of surface runoff flows directly into the river instead of running on the next soil unit ameliorates the simulation results.
Concerning soil water dynamics the model performance was good for the topsoil. Major problems occurred in the gravel-enriched Btc-horizon. Due to the high gravel con-tent the uncertainties in the measurements of the soil physi-cal parameters are high (e.g. Ksatmeasurements,
determina-tion of soil water retendetermina-tion curve) and also the installadetermina-tion of TDR-probes in the soil is difficult. Both could be reasons for the big differences between the measured and simulated soil moisture. In the saprolitic horizon the model was not able to reproduce the quick saturation of this layer, because no macropore model is available in SIMULAT-H. An integra-tion of macropores in the modelling system could ameliorate the model performance concerning the soil water dynamics. But in general the parameterization of a macropore-system is very difficult, because often no information about the size, the amount and the continuity of macropores is available. Another problem is that the measured Ksat-values include
marcropore-flow, so that they are not usable to parameterize a model with an additional macropore system without further assumptions.
Although the model SIMULAT-H implies some simplifi-cations in the process description the model is able to sim-ulate the processes correctly, which was revealed by a com-parison with the field observations.
With the application of a physically-based model in Benin this study is a relevant contribution to the research do-main of hydrological modelling in tropical regions, espe-cially West Africa. Due to the limited data availability often only conceptual models are applied and the experience with physically-based models in this region is low.