Pressure head distribution during unstable flow in relation to the
formation and dissipation of fingers
Hiroyuki Cho
1and Gerrit H. de Rooij
21Saga University, Dept. of Agricultural Sciences, Honjou 1, Saga-shi 840-8502, Japan
2Wageningen University, Dept. of Environmental Sciences, Sub-dept. Water Resources, Nieuwe Kanaal 11, 6709 PA Wageningen, The Netherlands
Email forcorresponding author: [email protected]
Abstract
Wetting front instability creates a shallow induction zone from which fingers emerge that rapidly transport water and solutes downwards. How the induction zone affects finger location and spacing is unknown. In the moist subsoil, fingers may well dissipate because the finger tips no longer have to overcome the water entry value. Both flow regions were investigated in a two-dimensional chamber with a fine-over-coarse glass bead porous medium. A capillary fringe was created by upward wetting through capillary rise. Upon ponding with dye-coloured water, fingers emerged, propagated downward and diverged when reaching the capillary fringe. Microtensiometers were installed in the induction zone, the fingers, and in the capillary fringe. In the induction zone, a lateral sinusoidal pressure head developed within minutes. Only in one of two experiments could the observed pressure head pattern be satisfactorily reproduced by a steady-state model assuming uniform induction zone properties and uniform infiltration. Later, fingers emerged below the pressure head minima. The induction zone did not affect finger properties. The pressure head in the induction zone was determined by the depth of the finger tips. The water requirement of the fingers dictated the lateral pressure head gradients. The pressure heads in the capillary fringe supported the hypothesis that the flow stabilised and dissipated there.
Key words: fingered flow, wetting front instability, unsaturated flow, microtensiometers, induction zone, capillary fringe
Introduction
Fingered flow caused by wetting front instability enhances solute leaching to the groundwater, reduces the capacity of the soil to retain or neutralise contaminants, and hampers crop growth by rapidly transporting water below the root zone. For these reasons fingered flow has been researched extensively (see reviews by Hillel, 1987; Glass and Nicholl, 1996; de Rooij, 2000).
One aspect that received relatively little attention is the mechanism determining which of the many proto-fingers that form in an unstable wetting front (e.g., Hill and Parlange, 1972, Figs. 1 and 4; Starr et al., 1986, Fig. 4A; Wang et al., 1998) will grow to full maturity at the expense of the others. The spacing of individual fingers may be an intrinsic property of unstable flow, governed by overall characteristics such as infiltration rate, soil water entry value and the hydraulic conductivity at the water entry value. On the other hand, the induction zone may determine finger spacing through its lateral conductivity. If this lateral
conductivity is low, the pressure head gradients required to channel the infiltrating water toward the fingers may become sufficiently large to cause the pressure head at some distance from a finger to exceed the water entry value. Water will then infiltrate vertically at this point, and a new finger will form.
pressure head gradient arises from the need to build up pressure to overcome the water entry value of the soil.
When the fingers reach a moist layer, the flow no longer encounters a threshold pressure head. Without this resistance to infiltration, flow can occur without gravitational support. Lateral flow thus becomes possible, and the flow in a moist layer below a finger will diverge. Diverging flow in the moist subsoil is well documented (Starr et al., 1986, Fig. 4B; Ritsema et al., 1993; Liu et al., 1994a), producing a three-region flow field with converging flow toward the fingers in the induction zone, vertical flow within the fingers, and diverging flow below the fingers in the moist subsoil.
Without water entry value, a negative pressure head gradient is no prerequisite for vertical infiltration either. De Rooij (1995) therefore hypothesised that unstable, fingered flow would stabilise upon entering a moist layer. He predicted a reversal of the pressure head gradient from the finger (in which the gradient opposes downward flow) to the region of diverging flow (where the gradient supports downward flow). Cho and de Rooij (1999) and de Rooij and Cho (1999) provide evidence from a single tensiometer supporting this reversal of the gradient in a region of diverging flow, but more comprehensive measurements of the pressure head field below a finger are required.
The objective of this paper is to advance understanding of the early stage of finger growth and the behaviour of fully developed fingers. Specifically, the role of the induction zone in determining finger spacing will be investigated. The onset of fingering is studied by tracing the wetting front in time and recording pressure heads by fast-response microtensiometers in the induction zone. Once fingers have fully developed, their behaviour in the capillary fringe above the phreatic level is monitored, again by the combination of wetting front tracing and microtensiometry. Here, the vertical pressure head gradient in the dry and prewetted soil will receive special attention. Earlier work (Cho and de Rooij, 1999; de Rooij and Cho, 1999; de Rooij et al., 2001) will be extended by establishing a more comprehensive set of measurements in the induction zone and the moist subsoil. The pressure head regime in the entire system of induction zone, fingers, and moist subsoil will be studied, highlighting the interaction between the different flow regions during different stages of the flow.
Theory
A theoretical model for the flow in each of the three flow regions is desirable. Selker et al. (1992b) provided a theoretical treatment of the flow inside fingers. De Rooij (1995) and de Rooij et al. (1996) described the flow in the region of diverging flow.
Here, a straight-forward theoretical model is developed for the flow in the one remaining region: the induction zone. The model is based on the assumption that, once the induction zone has fully developed, its thickness, water content, and hydraulic conductivity are uniform. Furthermore, the flow is assumed to be essentially horizontal, vertically uniform, and Darcian. Finally, the infiltration rate from the fine-textured layer is assumed to be uniform. The model is developed for two-dimensional flow to make it applicable to the experimental data at hand, but the extension to radially symmetric flow is easy.
The induction zone consists of a number of segments. Each segment is the microcatchment of an individual finger. Adjacent microcatchments are separated by a watershed located somewhere between two fingers. The watershed constitutes a no-flow boundary. Water flows in the direction of the finger centre, where flow lines from opposite directions meet and are diverted downwards into the finger. The analysis can be limited to one half of a microcatchment, and makes use of a local x-co-ordinate running from zero at the finger centre to L at the catchment watershed, which separates it from the next microcatchment. Thus, water always flows in the direction of diminishing x.
For steady-state flow, mass conservation requires that at any horizontal location within the micro-catchment of a given finger, the total lateral flux through the induction zone must equal the total infiltration flux between the location of interest and the catchment boundary:
(
L x)
q DK xh∂ ∂ =
− i (1)
where x (L) is the lateral distance to the finger centre, L (L) is the lateral distance between the finger’s centre and its catchment boundary, qi (LT-1) is the infiltration flux density,
D (L) is the thickness of the induction zone, K (LT-1) its
conductivity, and h (L) is the vertically uniform pressure head in the induction zone.
Equation (1) is valid for locations not directly above a finger. There, the finger must protrude into the induction zone to connect the horizontal flow lines in the induction zone to the vertical flow lines in the finger. By assuming that the depth of a flow line is determined by the amounts of water infiltrated downstream from the streamline’s point of infiltration (flowing above the streamline) and upstream from the point of infiltration (flowing below the streamline), the shape of the protrusion can be chosen such that any horizontal flow line is intercepted without affecting the flow lines above it (de Rooij, 1995):
f
f , 0
1 x x x L x L x D
z ≤ ≤
where z (L) is the depth below the top of the induction zone of the protrusion, and xf (L) is half the finger width. This protrusion reduces the thickness of the induction zone by a fraction equal to the fraction of the flow it intercepts, making Eqn. (1) valid for 0 ≤ x ≤ L. Using Eqn. (2) to modify D in Eqn. (1) for 0 ≤ x ≤ xf, and then solving Eq. (1) by separation of variables and integration gives:
L x C x DK L q x DK q x
h =− + + , 0≤ ≤
2 )
( i 2 i (3)
where C (L) is a constant of integration. Equation (3) produces a parabolic pressure head pattern with a lateral pressure head gradient of zero at the catchment boundary (no-flow boundary).
Equation (3) has three parameters: qi/DK, L, and C. For each finger, there are two halves of its microcatchment for which these parameters should be determined. The number of independent parameters can be reduced by determining values for L from experimental data, and assuming qi/DK to be uniform. Furthermore, by imposing pressure head continuity at the finger centres and at the watersheds separating the microcatchments of adjacent fingers, only two independent parameters remain for any number of observed fingers. One parameter (qi/DK) characterises the rate of curvature of the lateral pressure head distribution, the other (determining the different C values of the catchment segments) is related to the average pressure head over the full extent of the induction zone.
Materials and methods
A transparent chamber was used (inner dimensions: 80 cm long, 69 cm high, 1 cm wide) with 75 tensiometer ports (4.5 mm diameter) in one of the 10 mm walls. The bottom contained 52 drainage outlets (4.0 mm diameter) that were filled with self-priming glass fibre material to prevent air bubbles from blocking the drainage flow (see also Cho and de Rooij, 1999; de Rooij and Cho, 1999; de Rooij et al., 2001). Prior to each experiment, the chamber was packed with air-dry glass beads of 0.120-0.150 mm diameter by filling the chamber in layers of about 5 cm. Each layer was packed by tamping, and the top 2 cm disturbed before the next layer was added. The top 2 cm of the final layer were removed and the remaining material packed to give a level surface 65 cm above the chamber bottom (66 cm above the phreatic level at the bottom of the drainage outlets). After levelling the surface, it was perturbed by making one notch (5 mm deep) at 45 cm from the left side for Run 1 and seven notches at 10 cm intervals for Run 2. A 3 cm thick top layer of fine glass beads (0.038 mm diameter) was added. The surface of the top layer was levelled and covered with gauze
to prevent disturbance during ponding.
The chamber was then placed in a water-filled reservoir with the water level at the same height as the chamber inner bottom. The water infiltrated through the drainage openings and created a capillary fringe. After six days the chamber was taken out of the reservoir and prepared for the experiment. Microtensiometers were installed and connected to pressure transducers. A microtensiometer consisted of a hypodermic needle (cut to 20 mm length, 0.70 mm outer diameter) that penetrated a conical silicon plug (15 mm long, diameter decreasing from 7 to 5 mm). A 10 mm long ceramic cup with an inner diameter of 0.8 mm, an outer diameter of 1.2 mm, and an air-entry value of 1 bar (Soilmoisture Equipment Corp., Goleta, CA; mold No. 652S24-B1M3) was fitted over the needle and epoxy glued to it at the bottom end. The tensiometers were stored in de-aerated water before installation. All but one of the tensiometer ports not occupied by a tensiometer were closed with silicon plugs. The one remaining open port served as an air outlet. Each microtensiometer was connected to a pressure transducer (model HTV-0P5N, Hi-Techs Co., Ltd. in Japan).
Prior to the experiment, the pressure-measuring system was tested; pressure heads could be measured to 0.5 mm accuracy. This high accuracy could be maintained by limiting temperature variations in the laboratory to one degree Centigrade. The transducer-tensiometer system responded in less than 3 s to a 30 cm step change of the pressure head. Fifteen tensiometers were installed at 1 cm below the fine-coarse interface (65 cm above the phreatic level) at 5 cm spacing. During the experiment, one tensiometer was installed in the centre of a developing finger at 15 cm below the fine-coarse interface (50 cm above the phreatic level). Eight tensiometers were installed in the capillary fringe, at 26, 31, and 36 cm above the phreatic level. A 21X datalogger and a AM416 multiplexer (Campbell Scientific, Inc., Shepshed, Leics., UK) recorded pressure heads every 10 s.
At the start of an experiment, the soil surface was rapidly ponded with a dye-solution (0.01 M KMnO4) in distilled water. A Mariotte-device kept the ponding depth constant at 1 cm. The infiltration rate was monitored automatically by an electronic balance that weighed the Mariotte-bottle at 10 s intervals. Finger development was videotaped and photographed. The wetting front at regular time intervals was traced from the photographs.
Results and discussion
FLOW PATTERNS
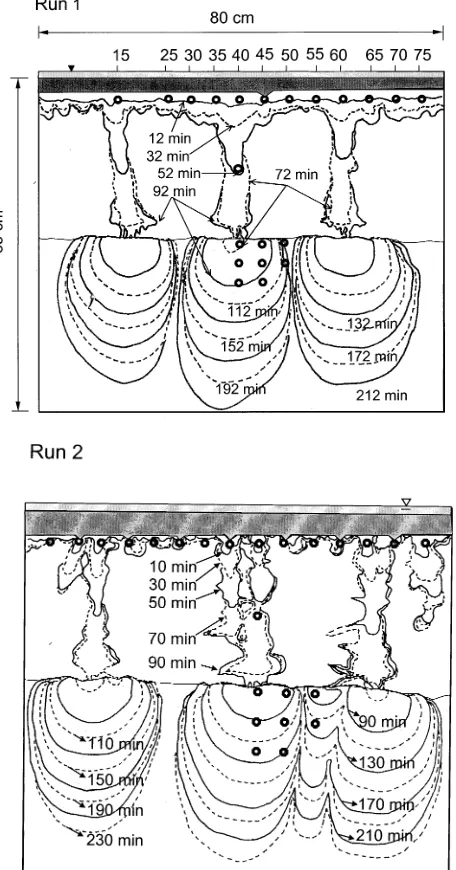
below the fine-coarse interface. The induction zone was markedly more irregular below the more perturbed textural interface of Run 2 (Fig. 1). Irrespective of this, three fingers developed in both experiments about 30 minutes after the start of infiltration. The first finger reached the wettable soil after 69 min (Run 1) and 68 min (Run 2). In both runs, the flow diverged in the capillary fringe to occupy virtually the entire chamber. This reduced the vertical velocity of the infiltration front by approximately 50%.
PRESSURE HEADS IN THE INDUCTION ZONE The lateral pressure head distributions in the induction zone (Fig. 2) are much more regular than the wetting patterns. After half an hour, when the wetting front was just transforming from the initial, inconclusive pattern of the induction zone to its final form with three fingers, the pressure head field was stable. Especially in Run 2, the final three-finger pattern had already fully developed in the pressure head field after 30 minutes, even though the highly erratic wetting front had not yet reached all tensiometers at that time. Apparently, this irregular shape of the induction zone of Run 2 limited its lateral conductivity, which led to considerably larger lateral pressure head gradients compared to those of Run 1 to support the converging flow toward the fingers. Nevertheless, at the time fingers became visible pressure heads never exceeded the water entry value (> –10
[image:4.595.50.278.213.648.2]Fig. 1. Front view of the experimental tank with the wetting fronts observed at the indicated times for Run 1 and Run 2. The top thin, dark grey layer represents the ponded water layer. The light grey layer below the ponded water is the fine-textured top layer. The grey area at the bottom is the capillary fringe in the coarse-textured layer. Tensiometers are indicated by bold black circles.
[image:4.595.297.541.326.652.2]cm based on observed pressure heads immediately after the wetting front reached a tensiometer), and there is no evidence suggesting that the limited lateral conductivity of the induction zone determined finger spacing.
The pressure head in the induction zone dropped continuously during the course of both experiments, without reaching the air-entry value. This is consistent with the requirement that the pressure head at the tip of a finger progressing into initially dry soil must at least be equal to the water-entry value (Hillel and Baker, 1988; Selker et al., 1992a,b). The lower a finger tip is, the lower the pressure head at any given level above it can be without violating this requirement. The observation that the reduction of the pressure head is much more substantial before the fingers reached the capillary fringe than after that supports this link between finger tip depth and the pressure heads in the induction zone.
While the wetting front of the induction zone was erratic, its lateral pressure head distribution was smooth. The final finger pattern was consistent with the early pressure head distribution, especially for Run 2 (the interpretation of the pressure head data of Run 1 is less conclusive owing to the small lateral gradients). This strongly suggests that the pressure head field rather then the wetting pattern determined the location of the fingers. The fact that the long-term behaviour of the fingered flow system did not depend on the properties of the initial wetting front corroborates this hypothesis. The number of fingers, their size, and the travel times in the dry soil and the capillary fringe were comparable between experiments. Clearly, the properties of the induction zone had little bearing on the characteristics of the fingered flow that evolved from it.
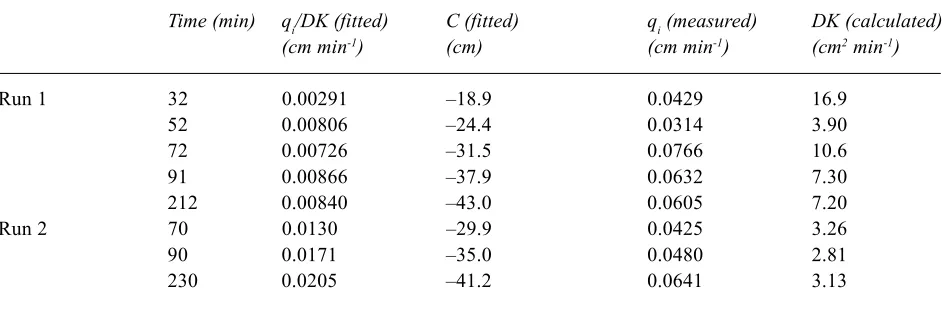
Least-squares fits of Eqn. (3) to the observed pressure head patterns were quite good for Run 1, with the relatively smooth induction zone (Table 1, Fig. 2). Since D and
probably K only varied to a limited degree in the induction zone, this indicates that qi (the vertical flux density at the top of the induction zone) was uniformly distributed over the induction zone, even though the flux density at the bottom was markedly non-uniform. For the more erratic flow pattern of Run 2, the proposed model could reproduce neither the degree of variation nor the shape of the observed pressure head pattern. In this case qi, D, and K may all have varied sufficiently to reduce the validity of the model. Also, the assumption of uniform water content and hydraulic conductivity in the induction zone limits the applicability of the model to cases where the lateral pressure head variations are small, a condition that may not have been met during Run 2.
For Run 1, the fits of qi/DK were stable after 52 minutes (Table 1). During Run 2, the fitted qi/DK gradually increased in time. Measurements of qi allowed the calculation of DK, although the wetting pattern was too erratic to provide reliable estimates of K from estimated values of D. The gradual increase of qi/DK during Run 2 can be attributed to a trend in qi: estimates of DK are more or less constant in the later part of both runs. The difference between DK values of both runs is consistent with the thinner induction zone for Run 2.
In both runs, the temporal trend of the C is directly related to the average depth below the upper tensiometers of the three finger tips. Linear regression of C v. average finger tip depth gives a slope of –0.44 and an intercept of –18.2 cm for Run 1 (R2 = 0.95), while those of Run 2 are –0.33
and –21.3 cm (R2 = 0.93). Note that C is the constant in
[image:5.595.69.540.571.731.2]Eqn. (3) for the left-most half microcatchment. The Cs of the remaining segments are proportional to the fitted C through the continuity constraints.
Table 1. Fitted and measured parameters describing the flow in the induction zone
Time (min) qi/DK (fitted) C (fitted) qi (measured) DK (calculated)
(cm min-1) (cm) (cm min-1) (cm2 min-1)
Run 1 32 0.00291 –18.9 0.0429 16.9
52 0.00806 –24.4 0.0314 3.90
72 0.00726 –31.5 0.0766 10.6
91 0.00866 –37.9 0.0632 7.30
212 0.00840 –43.0 0.0605 7.20
Run 2 70 0.0130 –29.9 0.0425 3.26
90 0.0171 –35.0 0.0480 2.81
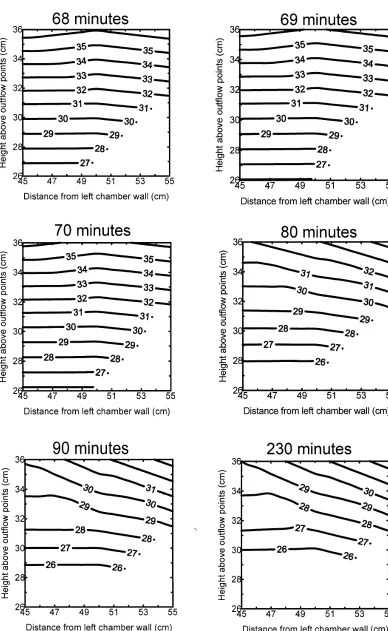
PRESSURE HEADS IN THE CAPILLARY FRINGE Since the induction zone did not affect the long-term behaviour of the flow, only the pressure heads in the capillary fringe of Run 2 will be discussed. Before the central finger reached the capillary fringe, the pressure head field after 69 min of infiltration represented hydrostatic equilibrium (Fig. 3). Shortly after the finger connected with the prewetted soil, this equilibrium field was only slightly perturbed (70 min). As infiltration continued, the effect became stronger. The pressure head field shown for 90 min of infiltration did not change significantly through the remainder of the experiment.
The flow was never large enough to affect the pressure head field to a degree that the vertical pressure head profile in the capillary fringe changed sign as predicted by de Rooij (1995). Apparently, the flow through the finger was not large enough to lift the vertical pressure head gradient of –1 (corresponding to hydrostatic equilibrium) to a positive value over the 5 cm depth interval between tensiometers. De Rooij (1995) based his hypothesis of gradient reversal on the tacit assumption of a unit gradient pressure head distribution prior to the arrival of the finger. In conditions reflecting (approximate) hydrostatic equilibrium, his hypothesis needs to be refined: the limited fluxes produced by fingers generally constitute only a relatively minor perturbation of the initial equilibrium profile, and the flow may stabilise even without a pressure head gradient reversal. In the experiments discussed here, the fact that the infiltration front covered essentially the entire cross-section of the chamber in the capillary fringe supports the notion that fingers in moist soil dissipate (resulting from stabilisation of infiltration) rather then widen. Theoretical finger sizes for moist soils (Liu et al., 1994b) should therefore not be calculated when there is evidence for flow stabilisation in the moist subsoil, since fingers cease to exist once they enter the moist layer. Instead, the flow simply occupies the entire layer.
VERTICAL PRESSURE HEAD PROFILES
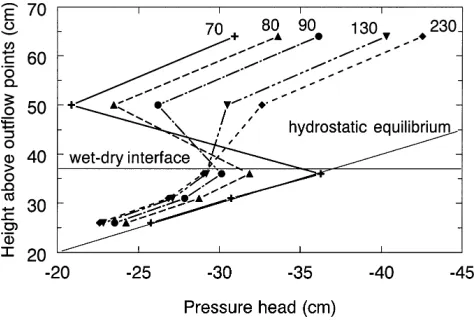
The vertical pressure head profiles through the induction zone, the finger, and the capillary fringe support the idea of finger dissipation, as Fig. 4 shows for Run 2. In both runs there was clear evidence of a pressure head gradient reversal, which was most likely located in the top few centimetres of the capillary fringe, perhaps even in the thin section of the capillary fringe above the locations of the top array of tensiometers (see Fig. 1) used to construct the pressure head fields of Fig. 3. Figure 4 also demonstrates how the pressure heads in the initially dry soil gradually dropped (see discussion above) while those in the pre-wetted soil rose
and gradually moved away from hydrostatic equilibrium. In the increasingly wetter, more conductive capillary fringe vertical hydraulic head gradients diminished directly below the finger.
It should be noted that the flow in the finger deviated markedly from the unit gradient profile: the pressure head typically rose by approximately 10 cm between the tensiometer in the induction zone and that 14 cm below, in the finger. Unit gradient conditions in the finger were much better approximated during Run 1 (see also Fig. 6). This is probably a consequence of the limited lateral conductivity of the induction zone of Run 2. Relatively dry fingers and deviations from unit gradient conditions were also reported by Selker et al. (1991, 1992 a,b)
INTERACTION BETWEEN THE INDUCTION ZONE, THE FINGER, AND THE CAPILLARY FRINGE
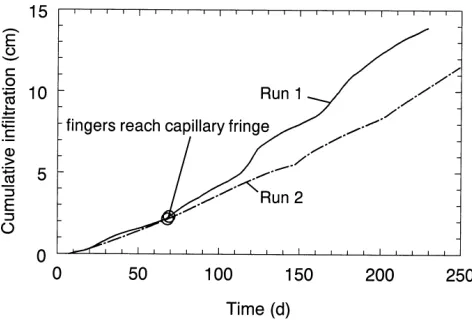
Figure 5 reveals that the infiltration rate of Run 1 increased much more strongly when the fingers reached the capillary fringe than the infiltration rate of Run 2 did. Possibly, the demand for water by the fingers increased when the flow entered the capillary fringe because infiltration became easier when the water entry value vanished. While the induction flow did not hamper lateral flow for the infiltration rate during finger growth in the dry soil, it might have for the increased flow rate that prevailed when the flow entered the prewetted region. Apparently, this limiting effect on the flow towards the fingers was stronger for the erratic induction zone of Run 2 than for the smoother induction zone of Run 1.
The change in the flow conditions when the fingers reach the capillary fringe is also apparent from the temporal trends of the pressure heads in all flow regions (Fig. 6). When
[image:7.595.313.550.69.229.2]Fig. 5. Cumulative infiltration of both experimental runs.
fingers were still advancing through the dry soil, the pressure heads in the induction zone and the fingers dropped at a nearly constant rate consistent with the finger tip velocity of 0.6 cm min–1 (Run 1) or 0.5 cm min–1 (Run 2). In the first
minutes after the fingers connected with the capillary fringe, the rate of change in the induction zone and the fingers reduced, while the pressure heads in the capillary fringe increased in response to the increased flow. Then, the pressure head reduction in the induction zone and the finger increased again, and gradually levelled off as time progressed. At the same time the pressure heads in the wettable soil started rising (with the tensiometer close to the top of the capillary fringe having the sharpest rise), again followed by a gradual levelling-off.
Figures 2, 4, and 6 suggest that the pressure heads in the entire flow domain above the capillary fringe were dominated by the position of the finger tips. Even the lateral pressure head gradients in the induction zone appeared to
Fig. 6. Temporal variation of the pressure head at various depths at 45 cm to the right of the left tank wall for Run 1 (left), and Run 2 (right, see also Fig. 4). In Run 1 not all tensiometers functioned properly. The numbers indicate tensiometer
depths in cm below the fine-coarse interface.
be determined by the flux demanded by the fingers. Thus, the fingers seemed to regulate the pressure head regime in order to acquire the amounts of water required for their growth. Upon entering the capillary fringe, the pressure head field in the three flow regions moved towards a stable configuration consistent with a nearly steady-state, Darcian flow in a flow domain, the geometry of which was established by an unstable flow pattern.
Acknowledgement
The work of G.H. de Rooij has been made possible by a Fellowship of the Royal Netherlands Academy of Arts and Sciences.
References
Baker, R.S. and Hillel, D., 1990. Laboratory tests of a theory of fingering during infiltration into layered soils. Soil Sci. Soc. Amer. J., 54, 20–30.
Cho, H. and de Rooij, G.H., 1999. Fingered flow: the role of the induction zone below the soil surface and the capillary fringe.
In: Characterization and measurement of the hydraulic
properties of unsaturated porous media. Part 1, M.Th. van Genuchten, F.J. Leij and L. Wu. (Eds.), Proc. Inter. Workshop, Riverside, California, October 22-24, 1997, University of California, Riverside, U.S.A. 423–432.
de Rooij, G.H., 1995. A three-region analytical model of solute leaching in a soil with a water-repellent top layer. Water Resour. Res., 31, 2701–2707.
de Rooij, G.H., 2000. Modeling fingered flow of water in soils owing to wetting front instability: a review. J. Hydrol., 231– 232, 277–294.
de Rooij, G.H. and Cho, H., 1999. Modelling solute leaching during fingered flow by integrating and expanding various theoretical and empirical concepts. Hydrolog. Sci. J., 44, 447– 465.
de Rooij, G.H., Warrick, A.W. and Gielen, J.L.W., 1996. Steady flow from a disc source above a shallow water table. J. Hydrol.,
[image:8.595.45.281.68.228.2] [image:8.595.46.541.537.697.2]de Rooij, G.H., Cho, H., Inoue, M. and Toride, N., 2001. Finger formation and its relation to lateral flow in the induction zone. In: Preferential flow. Water movement and chemical transport in the environment. A. Shirmohammadi (Ed.), Proc. 2nd Inter.
Symp., Honolulu, Hawaii, January 3-5, 2001, American Society of Agricultural Engineers, St. Joseph. Michigan, U.S.A. 173– 176.
Glass, R.J. and Nicholl, M.J., 1996. Physics of gravity fingering of immiscible fluids within porous media: an overview of current understanding and selected complicating factors. Geoderma,
70, 133–163.
Hill, D.E. and Parlange, J.-Y., 1972. Wetting front instability in layered soils. Soil Sci. Soc. Amer. Proc., 36, 697–702. Hillel, D., 1987. Unstable flow in layered soils: a review. Hydrolog.
Process., 1, 143–147.
Hillel, D. and Baker, R.S., 1988. A descriptive theory of fingering during infiltration into layered soils. Soil Sci., 146, 51–56. Liu, Y., Steenhuis, T.S. and Parlange, J.-Y., 1994a. Formation and
persistence of fingered flow fields in coarse grained soils under different moisture contents. J. Hydrol., 159, 187–195. Liu, Y., Steenhuis, T.S. and Parlange, J.-Y., 1994b. Closed-form
solution for finger width in sandy soils at different water contents. Water Resour. Res., 30, 949–952.
Philip, J.R., 1975. Stability analysis of infiltration. Soil Sci. Soc. Amer. Proc., 39, 1042–1049.
Ritsema, C.J., Dekker, L.W., Hendrickx, J.M.H. and Hamminga, W., 1993. Preferential flow mechanism in a water repellent sandy soil. Water Resour. Res., 29, 2183–2193.
Selker, J.S., Steenhuis, T.S. and Parlange, J.-Y., 1991. Estimation of loading via fingered flow. In: Irrigation and drainage. W.F. Ritter (Ed.), Proc. 1991 Nat. Conf., Honolulu, Hawaii, July 22-26, 1991. American Society of Civil Engineers, New York. New York, U.S.A. 81–87.
Selker, J., Leclerq, P., Parlange, J.-Y. and Steenhuis, T., 1992a. Fingered flow in two dimensions. 1. Measurement of matric potential. Water Resour. Res., 28, 2513–2521.
Selker, J., Parlange, J.-Y. and Steenhuis, T., 1992b. Fingered flow in two dimensions. 2. Predicting finger moisture profile. Water Resour. Res., 28, 2523–2528.
Starr, J.L., Parlange, J.-Y. and Frink, C.R., 1986. Water and chloride movement through a layered field soil. Soil Sci. Soc. Amer. J., 50, 1384–1390.