An Evaluation on Surface Texture of Aluminium Alloy A356 in
Cylindrical Turning by Optimizing the Process Variables
Pradeep Kumar Gupta
1Mahesh Kumar Jangid
2Sharad Srivastava
31
M. Tech Student
2,3Assistant Professor
1,2,3RIET Jaipur
Abstract—In the present market circumstance quality and profitability of an item assumes huge part. All the assembling or generation units are extraordinarily worried about quality of the item. The benefit level and goodwill of any industry or association is additionally an imperative paradigm other than quality efficiency. Creation of a substantial number of items inside moderately least time is the target of each generation units, however diminishment underway and producing time may cause significant quality misfortunes. To adjust these two opposing criteria it is fundamental to check quality level of the thing. The intention is to fulfill the consumer loyalty's level. This prompts enhancement issue which distinguish best process condition or parametric mix for that assembling procedure. To take care of the multi-target streamlining issues, the present investigation connected Taguchi technique through a contextual analysis in turning of A356 Aluminum Alloy bar utilizing Carbide tip tool. The primary goal of this examination is to discover the best procedure conditions which satisfy the prerequisites of value and also efficiency at the same time. The anticipated ideal conditions guarantee the minimization of surface unpleasantness. In this postulation, to give the ideal setting, Taguchi technique is utilized. Confirmation tests are improved the situation check of ideal outcomes.
Key words: Productivity, Quality, Turning, Surface
Roughness, MRR, Taguchi Approach
I. INTRODUCTION
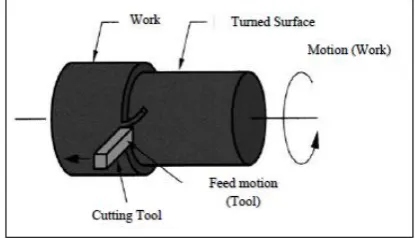
[image:1.595.61.269.575.694.2]The work is straight turned when it is made to rotate about the lathe axis, and the tool is fed analogous to the lathe axis. The plain turning produces a cylinder-shaped exterior by eliminating glut metal from the work piece. The method of turning is occupied by a single point cutting tool on lathe machine. The job is a part of pre-shaped matter that is mounted between the centres using lathe dog, which itself is fixed to the chuck of lathe machine, and allowed to revolve at high rapidity.
Fig. 1: Adjustable parameters in turning operation
A. Cutting variables in Turning
Speed, depth of cut and feed are three prime aspects which effects turning operation. There are also some other factors
such as category of tool has an enormous impact, on the other hand three features are:
B. Cutting speed
While determining the cutting speed for any material, several factors are to be taken into account e.g., the type of job and tool, condition of machining, type of cut required, machinability of material, tool material etc.
Mathematically, Cutting speed
𝑣 =𝜋𝐷𝑁
60 m/min Eq. 1.1 Where,
𝑣 =cutting speed in metres/min,
D= Diameter of the specimen in mm, and N= Speed of spindle in rpm.
C. Feed
The rate at which cutting tool is fed depends upon various factors such as finish required, depth of cut and rigidity of the machine. On maximum programmed lathes, the feed rate is completely associated to the speed of spindle and is articulated in mm (of tool advancement) per revolve of the spindle, or mm/rev. normally feed varies from 0.1 to 1.5 mm.
Fm = ƒ. N mm/min Eq. 1.2
Here,
Fm = the feed rate in mm/minute;
f = the feed rate in mm/rev, N= speed of spindle in rpm.
D. Depth of Cut
The diameter of the specimen is shrunken by two times the deepness o f cut since this stratum is being take away from both verges of the specimen.
mm d D
d
cu t2
Eq. 1.3
Here,
D= initial diameter in mm of the specimen and d = final diameter in mm of the specimen.
E. Tool Material:
Tool material chosen for the experimentation purpose is Carbide tip tool
STS (5/8'' x 6'') 15.88 x 152.80 mm
II. GEOMETRY OF SINGLE POINT CUTTING TOOL
Fig. 2: Single point cutting tool geometry
A. Flank
During the course of plain spinning, the tool is fed into the specimen at the side flank surfaces, and the end edge passes over the recently machined peripheral.
B. Face
It is defined as that surface of the tool against which chips are formed.
C. Back rake angle
It is defined as the angle between the face of the tool and an edge parallel to the base of the tool, and measured in a flat through the cutting edge.
D. Side Rake Angle
It is defined as the angle amid the face of the tool and the centre of the sample, if observed forward the tool down the extent of the tool holder.
E. End Cutting Edge Angle
Increasing the extinction cutting edge angle slants the faraway end of the cutting verge away from the specimen.
F. Side Relief Angle
The angle that thwarts the intervention as the tool cross the threshold the material. Sometimes additional side clearance is also provided on the tool that is also acknowledged as side allowance angle.
G. Lead angle
If a tool frame is manufactured with measurements which move the angle of an insertion, the lead angle receipts this alteration into consideration. This word is used for the side cutting edge angle.
III. TURNING MACHINES
A. Turret Lathes
A longitudinally support hexagon turret replaces the tailstock in turret machine. The turret machine, contains six tools can be mounted, can be rotated about a vertical centre point to bring every tool into working position and the entire unit can be moved longitudinally either physically or by power, to offer sustain to the instruments. The turret indexes consequently to the end of its development when the turret get together is moved in an opposite direction from the shaft by methods for a capstan wheel, along these lines, bring each of the six devices into working position. Proceeding most turret machines, it can be moved transversely, by approaches for the cross slide, and longitudinally over the carriage. In maximum circumstances, an established tool frame similarly
[image:2.595.329.520.71.234.2]is added to the back end of the cross slide for conveying a separating device.
Fig. 3: Turret lathe
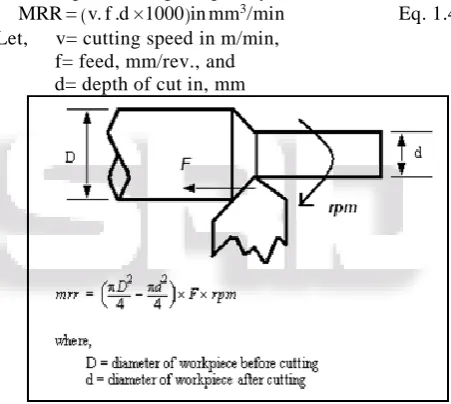
IV. MATERIAL REMOVE RATE
The material removal rate (MRR) in turning operations is d e f i n e d a s the volume of material removed per unit time from the work piece in mm3/min. Fig. shows various
dimension of work piece to be turned. For each revolution of the work piece, a ring- shaped layer of material is removed.
MRR = (v. f .d ×1000) in mm3/min Eq. 1.4
Let, v= cutting speed in m/min, f= feed, mm/rev., and d= depth of cut in, mm
Fig. 4: MRR in turning
V. SURFACE STRUCTURE AND PROPERTIES
Surface irregularity is a n extent of product eminence since surface irregularity prominently influences the performance of mechanical measures and production cost. Mechanical characteristics like fatigue behaviour, oxidization confrontation, creep life span, etc., depend prominently on the surface irregularity. (Fig.5 ).
[image:2.595.309.535.313.515.2] [image:2.595.314.539.623.741.2]The greater part of metal (substrate) has a structure that depends on the arrangement and dispensation of the metal.
Above the substrate, there is a stratum that regularly has been plastically warped and work-hardened during the manufacturing process.
An oxide layer forms above the work- hardened stratum, when the metal is processed and kept in an inert environment or is a gallant metal such as gold or platinum. S urface oxide stratums are normally protected with absorbed stratums of gas and humidity.
T he farthest apparent of the material may be shielded with impurities for example dirt, dust, smear, lubricant scums cleaning-compound and contaminants from the atmosphere.
VI. SURFACE ROUGHNESS IN TURNING
The consequential jaggedness formed by a turning progression can be considered as the grouping of two extents:
Ideal roughness
Natural roughness.
A. Ideal Roughness:
It is the gathering of feed and tool geometry. It defines the paramount promising quality that can be acquired aimed at a particular tool contour and feed. Ideal roughness can be accomplished solitary if the built-up-edge, chatter and imprecisions in the machine tool travels are disinterested. For a high-pitched tool devoid of nose radius, t h e extreme elevation of patchiness is given by:
cot cot
max
f
R
Eq. 1.5Where, f =feed rate,
ϕ =principal cutting edge angle and β =minor cutting edge angle.
The surface roughness assessment is given by, Ra = Rmax/4 Eq. 1.6
[image:3.595.306.552.89.329.2]Unrealistic prototype of surface unevenness has been undoubtedly shown in Fig.6.
Fig. 6: Idealized model of surface roughness
B. Natural roughness
Natural surface roughness actually forms a large proportion roughness. The foremost intention to natural roughness is the existence of a built-up edge and shuddering of the machine tool.
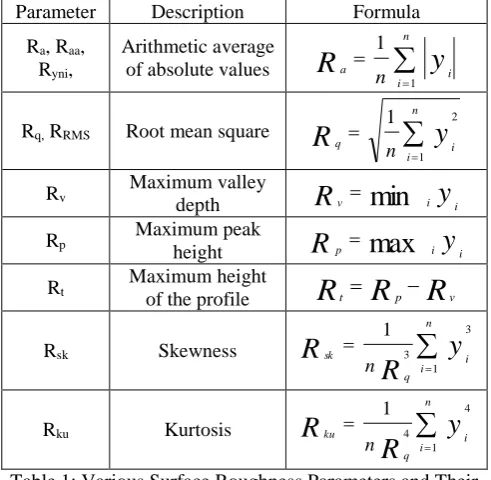
VII. CONSIDERATIONS OF SURFACE COARSENESS
Roughness constraints are designed using a formula. There are several diverse roughness constraints nevertheless Ra is the utmost common. Additional constraints comprises of Rz, Rq, and Rsk.
The formulations recorded in the Table I assume that the roughness contour has been strained from the raw contour records and the mean line has been calculated.
Parameter Description Formula
Ra, Raa,
Ryni,
Arithmetic average
of absolute values
n
i i
a
y
R
n 1
1
Rq, RRMS Root mean square
n
i i
q
y
R
n1 2 1
Rv Maximum valley
depth
R
v min
iy
iRp Maximum peak
height
R
pmax
iy
i
Rt
Maximum height
of the profile
R
tR
pR
vRsk Skewness
n
i i
q
sk
y
R
R
n 1
3
3 1
Rku Kurtosis
n
i i
q
ku
y
R
R
n 1
4
4 1
Table 1: Various Surface Roughness Parameters and Their Formulae
A. Approaches for Evaluation of Surface Roughness
Assessment and extent of surface coarseness of finished work pieces can be completed by means of diverse measurement approaches. These approaches can be categorized into the subsequent classes:
1) Direct measurement approaches 2) Comparable based approaches 3) Non-contact approaches 4) On-process quantity
B. Applications
Commonly used in the manufacture of heavy-duty structures requiring good corrosion resistance, automatic weavings machine components, truck and marine components, railroad cars, furniture, tank fittings, general structural and high pressure applications, wire products, and in pipelines, automatic winding machines components.
VIII. LITERATURE REVIEW
Fnides B., Aouici H., Yallese M. A., X “Cutting forces and surface roughness in hard turning of hot work steel X38CrMoV5-1 using mixed ceramic”, Mechanika, Volume 2, Number 70, pp. 73-78, (2008), considered on machining of slide-lathing grade X38CrMoV5-1 steel handled at 50 HRC by a merged ceramic tool (insertion CC650) to expose the effects of cutting constraints: flank wear, feed rate, cutting rapidity and depth of cut on cutting forces besides on surface coarseness. The author found that tangential cutting force was very sensitive to the variation of cutting depth. It has been examined that surface coarseness was very delicate to the deviation of feed rate and that flank wear had an excessive effect on the development of cutting force components and on the benchmarks of surface coarseness.
[image:3.595.306.551.89.327.2]Engineering Society Journal, Volume 53, Number 48, pp. 25-30, (2006), considered on turning process by High-Speed Steel (HSS) cutting tool with 450 slant angle. This tool
indicated that it might execute cutting process at greater rapidity and longer tool life than customary tool with 900
slant angle.
Suresh P. V. S., Rao P. V. and Deshmukh S. G., “A genetic algorithmic approach for optimization of surface roughness prediction model”, International Journal of Machine Tools and Manufacture, Volume 42, pp. 675–680, (2002), engrossed on turning mild steel by TiN-coated tungsten carbide (CNMG) cutting tools for emerging a surface coarseness forecast simulation by using Response Surface Methodology (RSM). Genetic Algorithms (GA) worked to optimize the impartial role and matched with RSM outcomes. It was detected that Genetic Algorithm program providing least and extreme standards of surface coarseness and their corresponding optimum machining circumstances.
A. Procedure
1) The existing research has been completed over the following proposal of investigation.
2) Inspection and organizing the CNC (Computer Numeric Control) Lathe machine prepared for achievement the turning procedure.
3) Cutting A356 bars by control hacksaw and execution of early handing activity over CNC Lathe to secure expected estimation of the work pieces.
4) The A356 bars are fitted in the jaw of the CNC machine. 5) Performing plain turning process on tests in several
cutting settings including a few arrangements of control contemplations like: nourish, speed, encourage and infiltration of cut.
6) Measure surface coarseness and surface layout with the help of a moveable stylus-sort Profilometer, Taylor Hobson (Talysurf).
B. Process Variables Taken For Experimental Work
In this trial Taguchi L9 Orthogonal Array configuration have been chosen. In exhibit ponder, speed of spindle, feed rate and deepness of cut have been considered as process factors. These procedure factors are chosen keeping mind the modern information. The fundamental point is to advance these procedure factors without changing the hardware establishment inside the industry.
Sr.No. Speed Feed DOC
1 600 0.4 0.3
2 1200 0.7 0.5
3 1800 0.9 0.7
Table 2: Process Parameters Used For Experimental Work
C. Experimentation Design
Experimentations have been conceded out with the help of Taguchi’s L9 Orthogonal Collection. Investigational strategy which comprises of nine arrangements of depth of cut, spindle speed and feed rate. Rendering to the index equipped by Taguchi, L9 Orthogonal Collection strategy of investigation has been found appropriate in the existing research. The Taguchi experimental design has been shown in Table 3.2. The different variables are obtained from the following transformation equations:
Spindle speed
A = (N-N0)/∆N Eq. 1.7
Feed rate
B = (f-f0)/∆f Eq. 1.8
Depth of cut
C = (d-d0)/∆d Eq. 1.9
Here A, B and C are the coded values of the variables N, f and d respectively; N0 , f0 and d0 are the values of spindle speed, feed rate and depth of cut at zero level; ΔN, Δf and Δd are the entities or recesses of deviation in speed (N), feed (f) and depth of cut (d) correspondingly.
Trial No.
Speed (rev./min.)
Feed (millimetre/rev.)
DOC (millimetres)
1 1 1 1
2 1 2 2
3 1 3 3
4 2 1 2
5 2 2 3
6 2 3 1
7 3 1 3
8 3 2 1
[image:4.595.308.551.173.317.2]9 3 3 2
Table 3: Taguchi’s L9 Orthogonal Selection
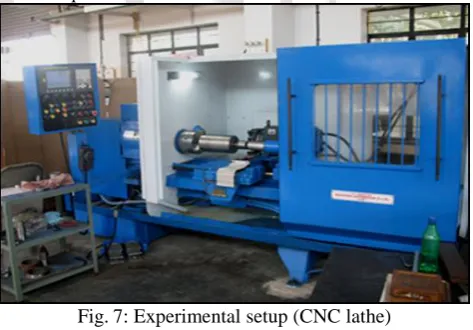
D. Equipments Used
1) Centre Lathe
[image:4.595.311.548.444.609.2]The Centre Lathe is utilised to manufacturing cylinder-shaped from an array of materials comprising; plastics and steels. Several works that verve composed to create an engine work have been mass-produced by lathes. These may be manually operated lathes or computer controlled (i.e., NC or CNC) lathes that have been automated to convey out a specific task. Computer controlled lathe machine is used for current experiment.
Fig. 7: Experimental setup (CNC lathe)
2) Cutting Tool Used
Tool material specification-Carbide tip tool STC (6/7'' x 7'') 16.88 x 152.70 mm
3) Work Piece Used
Aluminium (A356) rods of length 30 mm and diameter 25 mm.
IX. COARSENESS MEASUREMENT
(9V). This device is fitted out with a precious stone stylus taking a tip sweep 5 µm. The gaging stroke each time starts from the extraordinary external point and toward the fruition of the degree the pickup respects area prepared for the ensuing degree. Choice of cut-off length decides the navigate length of piece. Typically the cross length is five times the cut-off length however the amplification factor can be changed. The profilometer mechanical assembly has standard to an endpoint traverse of 0.9 mm, channel 3CR, and navigate speed 1 mm/sec and 4 mm cross separation. Coarseness degrees on the work pieces have been repeated 4 interims and run of the mill of 4 degrees of surface coarseness limitation esteems has been logged.
Fig. 8: Stylus-type profilometer, Talysurf (Taylor Hobson)
X. MATERIAL REMOVAL RATE MEASUREMENT
Material removal rate (MRR) has been calculated from the difference of weight of work piece before and after experiment.
MRR = (Wi -Wf) /ρat mm3/min Eq.1.10
Wi is the initial weight of work piece in g, Wf is the final
weight of work piece in g, t is the machining time in min., ρa
is the density of Al356 in g/mm3 (2.67x10⁻³ g/mm3 ). The
weightiness of the work piece has been measured in a great accuracy digital weighing scale, which can measure up to the precision l e v e l of 10-4 g and therefore escaping the
chance of great inaccuracy while computing material removal rate (MRR) in plain turning process.
A. Data Collection
First of all A356 bars (of diameter 25mm and length 60mm) necessary for accompanying the experimentation have been primed. Meanwhile L9 orthogonal optimization method is using for existing study thus nine specimens o f identical material and identical proportions have been prepared. Applying diverse levels of the progression constraints nine samples have been turned in computer numerically control lathe consequently. Machining interval for apiece specimen has been intended.
After machining, surface coarseness and surface contour have been measured precisely by the assistance of a transportable stylus-type Profilometer, Taylor Hobson (Talysurf). The results of the experiments have been shown in Table VII. The analysis has been made based on those experimental data basis in the following chapter. Optimization of surface roughness has been made b y Taguchi method. Confirmatory tests (by Minitab 15) have also been conducted finally to validate optimal results.
B. Data Analysis
1) Taguchi’ Technique
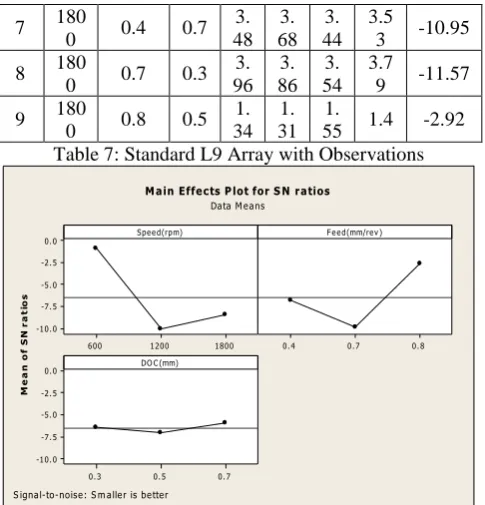
[image:5.595.46.550.191.593.2]The Taguchi technique comprises decreasing the deviation in a progression through simple strategy of experimentations. The global aim of the technique is to manufacture high value product at small cost to the producer. The typical Signal-to-Noise proportions commonly used are as follows: - Smaller the Better (SB) and Upper the Better (UB), Nominal is Best (NB). The optimal situation is the constraint arrangement, which has the maximum Signal/Noise proportion. Several Signal-Noise curvatures have been drawn to portray the performance on variable the diverse control constraints.
Fig. 9: Taguchi’s quadratic loss function
1) Taguchi’s Signal/Noise Proportion for (NB) Nominal-the-best
(Quality features is typically a small output, say Diameter) 𝜂 = 10log (1/𝑛) ∑𝑛 (µ2/𝜎2)
𝑖=1 Eq.1.11 2) Taguchi’s Signal/Noise Proportion for (SB)
Smaller-the-better
(Quality features is typically a small output, say Defects)
𝜂 = −10log (1/𝑛) ∑ 𝑦𝑖2
𝑛
𝑖=1 Eq.1.12 3) Taguchi’s S/N Ratio for (HB) Higher-the-better (Quality features is typically a small output, say Current)
𝜂 = −10log (1/𝑛) ∑ (1/𝑦𝑖2)
𝑛
𝑖=1
Eq. 1.13
C. Technique Reformed for Optimization
The optimization method is the Taguchi technique centred on certain Taguchi’s Orthogonal Array (OA) Strategy of experimentation. The usage of Taguchi’s constraint design comprises the following steps.
1) Recognize the key meaning and its ill effects. 2) Recognize the analysis ailment and quality features. 3) Recognize the objective task to be enhanced. 4) Recognize the regulator aspects and their levels. 5) Choose an appropriate Orthogonal Array and paradigm
the Matrix and Perform the matrix experiment.
6) Observe the facts; forecast the optimal regulator factor levels and its presentation.
7) Perform the confirmation experimentation.
Alloy Elements by weight % Balance
Cu Mg Mn Si Fe
Al 356 0.25 0.2-0.45 0.35
6.5-7.5 0.6 Al
[image:5.595.57.346.199.546.2]Process Constraints Constraint Designation
Levels L1 L2 L3
Speed A 600 1200 1800
Feed B 0.4 0.7 0.8
[image:6.595.48.284.52.260.2]DOC C 0.3 0.5 0.7
Table 5: Process Constraints with Their Values at 3 Levels Sr. No. Speed (rpm) Feed (mm/rev) DOC (mm)
1 1 1 1
2 1 2 2
3 1 3 3
4 2 1 2
5 2 2 3
6 2 3 1
7 3 1 3
8 3 2 1
9 3 3 2
Table 6: Standard L9Orthogonal Array
D. Test Specimen
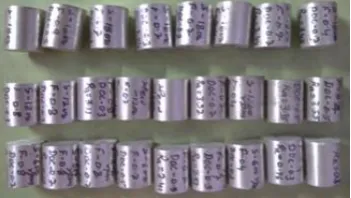
Figure.10 shows the real picture of test specimen A356 (Aluminium Alloy) about on which experiments have been done.
1) Dimension of specimen:
1) Length of the specimen: 30 mm 2) Diameter of the specimen: 25 mm
[image:6.595.351.506.54.168.2]First of all, a test specimen is collected from the market of 850 mm length and 25 mm in diameter. Then cut it up to the required specifications (i.e. 30 mm in length). The greater length of specimen is so selected because some of the material is being removed when machining through cutting and turning. After obtaining the required specimen nine numbers of experiments with 3 levels each have been performed.
Fig. 10: Test Specimen A356
XI. RESULT AND CONCLUSION
A. Result Analysis:
As discussed earlier, various parameters are chosen for the turning operation. After turning with taking various parameters on lathe machine. These specimen were tested on the Taylor Hobson Talysurf, various surface roughness values were obtained.
Fig. 11: Side view of specimen for roughness measurement after turning
Fig. 12: Roughness measurement by Talysurf Calculations of S/N Ratios for Surface Roughness of Table No. VII
1) S/N Ratio (Experiment 1)
η1= −10log (1/n) ∑ yi2
n=3
i=1
𝜂1= −10log [(1/3)(0.812+ 0.962+ 0.862)]
𝜂1= 1.12
2) S/N Ratio (Experiment 2)
𝜂2= −10log [(1/3)(2.532+ 2.412+ 2.172)]
𝜂2= −7.49
3) S/N Ratio (Experiment 3)
𝜂3= −10log [(1/3)(0.542+ 0.682+ 0.722)]
𝜂3= 3.74
4) S/N Ratio (Experiment 4)
𝜂4= −10log [(1/3)(3.422+ 3.552+ 3.352)]
𝜂4= −10.73
5) S/N Ratio (Experiment 5)
𝜂5= −10log [(1/3)(3.972+ 3.022+ 3.172)]
𝜂5= −10.60
6) S/N Ratio (Experiment 6)
𝜂6= −10log [(1/3)(3.112+ 2.672+ 2.532)]
𝜂6= −8.84
7) S/N Ratio (Experiment 7)
𝜂7= −10log [(1/3)(3.482+ 3.682+ 3.442)]
𝜂7= −10.95
8) S/N Ratio (Experiment 8)
𝜂8= −10log [(1/3)(3.962+ 3.862+ 3.542)]
𝜂8= −11.57
9) S/N Ratio (Experiment 9)
𝜂9= −10log [(1/3)(1.342+ 1.312+ 1.552)]
𝜂9= −2.92
Table VII shows the L9OA with observed values for each parameter.
Tri al No .
Spe ed (rp m)
Feed (mm/r ev)
DO C (m m)
Ra -1
Ra -2
Ra -3
Ra (A vg,
µm )
S/N Ratio
for rough
ness
1 600 0.4 0.3 0.
81 0. 96
0. 86
0.8
8 1.12
2 600 0.7 0.5 2.
53 2. 41
2. 17
2.3
7 -7.49
3 600 0.8 0.7 0.
54 0. 68
0. 72
0.6
5 3.74
4 120
0 0.4 0.5
3. 42
3. 55
3. 35
3.4
4 -10.73
5 120
0 0.7 0.7
3. 97
3. 02
3. 17
3.3
9 -10.6
6 120
0 0.8 0.3
3. 11
2. 67
2. 53
2.7
[image:6.595.304.533.209.551.2] [image:6.595.79.255.647.746.2]7 180
0 0.4 0.7
3. 48
3. 68
3. 44
3.5
3 -10.95
8 180
0 0.7 0.3
3. 96
3. 86
3. 54
3.7
9 -11.57
9 180
0 0.8 0.5
1. 34
1. 31
1.
55 1.4 -2.92 Table 7: Standard L9 Array with Observations
Fig. 13: S/N ratio values for Surface Roughness
XII. CONCLUSION
The study suggested an optimization approach using Taguchi’s optimization methodology. This research deals with optimization of several surface coarseness constraints in examination of an optimum parametric mishmash capable of creating desired surface eminence of the turned product in a moderately smaller interval. Various conclusions drawn based on the test conducted on Aluminium A356 alloy during turning operation with Uncoated Carbide Insert are given below:
1) From the results obtained a Model has been developed for Surface Roughness. From this model we can predict the optimum value of Surface Roughness if the values of Cutting Speed, Feed and Depth of Cut are known. 2) The authentication experimentation established that the
error arisen was not as much of as 2.0 % between calculation and real value.
3) The optimal settings of process parameters for optimal Surface Roughness are: Speed (600 rpm), Feed (0.8 mm/rev), and DOC (0.7 mm)
REFERENCES
[1] Jain R.K. (2001), “Production Technology” Khanna Publisher. ISBN 8174090991.
[2] Bewoor and Vinay Kulkarni (2009), “Metrology &
Measurement”, Tata McGraw Hill. ISBN:
9780070140004.
[3] Whitehouse and David (2012). “Surfaces and their measurement”. ISBN 9780080972025.
[4] Abott steven (2014), “SPE (Surface profile explorer)”. [5] Mahmoud E. A. E. and Abdelkarim H. A., (2006),
“Optimum Cutting Parameters in Turning Operations using HSS Cutting Tool with 450 Approach Angle”, Sudan Engineering Society Journal, Volume 53, Number 48, pp. 25-30.
[6] Ozel T. and Karpat Y., (2005), “Predictive modeling of surface roughness and tool wear in hard turning using
regression and neural networks”, International Journal of Machine Tools and Manufacture, Volume 45, pp. 467– 479.
[7] Kirby E. D., Zhang Z. and Chen J.C., (2004), “Development of An Accelerometer based surface roughness Prediction System in Turning Operation Using Multiple Regression Techniques”, Journal of Industrial Technology, Volume 20, Number 4, pp. 1-8. [8] Chien W.-T and Tsai C.-S., (2003), “The investigation
on the prediction of tool wear and the determination of optimum cutting conditions in machining 17-4PH stainless steel”, Journal of Materials Processing Technology, Volume 140, pp. 340–345.
[9] Feng C. X. (Jack) and Wang X., (2002), “Development of Empirical Models for Surface Roughness Prediction in Finish Turning”, International Journal of Advanced Manufacturing Technology, Volume 20, pp. 348–356. [10]Suresh P. V. S., Rao P. V. and Deshmukh S. G., (2002),
“A genetic algorithmic approach for optimization of surface roughness prediction model”, International Journal of Machine Tools and Manufacture, Volume 42, pp. 675–680.
1800 1200 600 0. 0 -2. 5 -5. 0 -7. 5 -10. 0
0.8 0. 7 0. 4
0. 7 0. 5 0. 3 0. 0 -2. 5 -5. 0 -7. 5 -10. 0
Speed(rpm)
M
e
a
n
o
f
S
N
r
a
t
io
s
F eed(mm/rev )
DO C (mm)
M ain Effects P lot for S N ratios
Data M eans
[image:7.595.47.290.52.305.2]