1
The impact of a brief gratitude intervention on subjective well-being, biology and sleep
Marta Jackowska, PhD1,2*; Jennie Brown, MSc1; Amy Ronaldson, MSc1, Andrew Steptoe, DPhil1.
1Research Department of Epidemiology and Public Health, University College London, UK. 2Department of Psychology, Whitelands College, University of Roehampton, Holybourne Avenue, SW15 4JD, London, UK.
*Corresponding author and reprints requests: Marta Jackowska, Department of Psychology, Whitelands College, University of Roehampton, Holybourne Avenue, SW15 4JD, London, United Kingdom. Telephone: +44(0)20 8392 3642, E-mail:
marta.jackowska@roehampton.ac.uk
Running title: Subjective well-being, biology and sleep
Word count: 5424 (this number includes the reference list) Tables count: 2
Title: The impact of a brief gratitude intervention on subjective well-being, biology and sleep
Abstract
This randomised controlled experiment tested whether a brief subjective well-being
(SWB) intervention would have favourable effects on cardiovascular and neuroendocrine
function and on sleep. We compared 2 weeks of a gratitude intervention with an active
control (everyday events reporting) and no treatment conditions in 119 young women.
The treatment elicited increases in hedonic well-being, optimism and sleep quality along
with decreases in diastolic blood pressure. Improvements in SWB were correlated with
increased sleep quality and reductions in blood pressure, but there were no relationships
with cortisol. This brief intervention suggests that SWB may contribute towards lower
morbidity and mortality through healthier biological function and restorative health
behaviours.
Introduction
There are many conceptualisations of subjective well-being (SWB), but recent
categorisations have identified three broad but distinct constructs: hedonic well-being,
eudemonic well-being and evaluative well-being (Steptoe et al., 2014; Stone and Mackie,
2013). Hedonic well-being refers to feelings or moods such as happiness or sadness,
while eudemonic well-being captures judgements about autonomy and the meaning and
purpose of life. The third component of evaluative well-being aligns with life satisfaction
and relates to the cognitive-judgmental appraisals that people make about their lives
(Ryan and Deci, 2001). Although eudemonic and hedonic well-being are related, each
represents a unique aspect of well-being. For example, some people perceive their life as
unfulfilling but nonetheless rate themselves as happy, while others report low levels of
happiness or affect despite pursuing their life goals (Ryan and Deci, 2001). However,
there is controversy about the distinction between hedonic and eudemonic well-being
since the constructs overlap conceptually (Fredrickson et al., 2013; Kashdan et al., 2008;
Telzer et al., 2014). Studies into SWB have also focused on positive or adaptive
trait-like factors, or dispositions such as optimism, sense of humour and emotional vitality
(Fredrickson and Joiner, 2002; Gallagher and Lopez, 2009; Kubzansky and Thurston,
2007).
Individuals with greater SWB enjoy longer and healthier lives (Boehm and
healthier biological profiles, suggesting that it may exert beneficial effects on health
through optimising biological function (Fredrickson at al., 2013; Kok & Fredrickson,
2010; Pressman and Cohen, 2005). Higher levels of SWB may buffer the effects of stress
and/or enhance stress recovery (Boehm and Kubzansky, 2012). Indeed, experimental
research has found that SWB is associated with smaller inflammatory and blood pressure
(BP) responses to acute stressors (Dockray and Steptoe, 2010). Studies conducted in
everyday life also reported that individuals with higher levels of positive states have lower
heart rate (HR), lower ambulatory BP, and lower concentrations of the stress hormone
cortisol and inflammatory markers (Ryff et al., 2006; Steptoe et al., 2005; Steptoe et al.,
2012). Observational studies suggest that positive trait-like dispositions such as optimism
also have healthier biological correlates including lower levels of cortisol and
inflammatory markers (Endrighi et al., 2011; Ikeda et al., 2011).
Greater SWB may also engender better physical health through health behaviours
(Steptoe et al., 2009). A recent longitudinal study demonstrated that eudemonic
well-being predicted greater use of preventive health care services relevant to serious illness
at older ages (Kim et al., 2014). Good sleep is linked to better health outcomes
(Cappuccio et al., 2011), and individuals reporting optimal sleep patterns also enjoy
higher SWB. For example, in the Midlife in the United States study SWB was inversely
related to insomnia symptoms (Hamilton et al., 2007). We have previously found that
al., 2008). Little research has explored prospective links between SWB and sleep, but
one longitudinal study showed that higher well-being was linked to a lower likelihood of
disturbed sleep ten years later (Phelan et al., 2010).
Most research relating SWB with biological responses is observational, and cannot
shed light on the causal processes involved. Greater well-being may promote more
favourable biological responses, but it is also plausible that biological processes
contribute to greater SWB. Relatedly, the research on sleep and SWB remains largely
cross-sectional, so it is uncertain whether SWB leads to better sleep, or if good sleep
enhances SWB. One method of clarifying temporal precedence is to modify well-being
to see whether this has a beneficial impact on biology and sleep. There are a small number
of short-term laboratory studies suggesting that experimentally-induced positive affect
can result in health-promoting cardiovascular and neuroendocrine responses (e.g.
Buchanan et al., 1999; Hucklebridge et al., 2000; Pressman and Cohen, 2005) but the
significance of these brief responses is uncertain, and they have limited relevance to sleep.
We therefore sought to test the impact of interventions that might increase SWB over a
number of days.
Expressing gratitude has been shown to increase life satisfaction (Boehm et al.,
2011) and to reduce negative affect (Emmons and McCullough, 2003). Other
interventions that may boost SWB include visualising best possible selves (Boehm et al.,
study was designed, only the gratitude approach had been successfully used to improve
sleep (Emmons and McCullough, 2003).
In light of these findings, we used a gratitude intervention to explore whether
increasing SWB would have a beneficial impact on cardiovascular and neuroendocrine
activity as well as on sleep in everyday life. Since past gratitude interventions have been
criticized for not including a true control group (Wood et al., 2010) our study involved
two control conditions: an active control condition and a no treatment control condition.
We predicted that in comparison with the control conditions, participants randomized to
the gratitude condition would experience greater increases in SWB that would be
associated with lower cortisol and lower ambulatory BP and HR. We selected these
biological markers since they can be conveniently collected in everyday life, and have
shown associations with SWB (Dockray & Steptoe, 2010). We also hypothesised that
randomisation to the gratitude programme would lead to improvements in sleep in
individuals with sleep problems as baseline. Finally, we conjectured that across the
complete sample, participants who reported greater improvements in SWB would show
Methods
Design
This study was a single-blind randomised controlled experiment that compared the
gratitude intervention with an active control condition (everyday events) and no treatment
condition. The study lasted 4 weeks with a baseline measurement week, 2 weeks of
intervention, and a post-intervention measurement week (see Fig. 1 in supplementary
materials). Salivary cortisol, ambulatory BP and HR were assessed over one working day
before and after the intervention period. All participants also provided daily positive
affect and sleep ratings for a week before and after the intervention.
Participants
Participants were 119 women either working or studying at University College London.
Volunteers were eligible to take part if they reported emotional distress between 2 and 9
on the 12-item General Health Questionnaire (Goldberg et al., 1997), and moderate sleep
disturbance indicated by a mean score between 1.5 and 4 on the Jenkins Sleep Problems
Scale (Jenkins et al., 1988). These cut-off points were guided by the literature (Goldberg
et al., 1997; Vahtera et al., 2006), and the scales were used at the screening selection stage
due to their good psychometric properties and brevity. To avoid floor and ceiling effects
participants with no/very low or high emotional distress and/or no/low or very high sleep
disturbance were not recruited. The remaining inclusion criteria included not being
any medical or psychiatric condition in the last 2 years. Since sleep patterns change with
age (Ohayon et al., 2004) women older than 45 years old were not invited to take part.
Sample size was determined using nQuery Advisor 4.0 (Statistical Solutions, Cork,
Ireland). Based on Emmons and McCullough’s (2003) study 2, we estimated that we
would detect a moderate effect size in positive affect with a sample of 40 per group (α =
0.05, 85% power). The study was approved by UCL Research Ethics Committee.
Procedure
During the first visit to the laboratory participants provided written consent, weight and
height were measured, and baseline questionnaires to assess socio-demographic
characteristics, SWB and sleep were distributed. We fitted participants with ambulatory
BP monitors and gave them a set of 7 plastic tubes to collect saliva for the assessment of
cortisol. The second visit to the laboratory took place a week later during which
participants were informed about the condition to which they had been randomly
assigned. We used a computer generated block randomisation list to allocate 40
participants to the gratitude condition, 41 to the everyday events condition and 38 to the
no treatment condition. Participants in the gratitude and everyday events conditions were
provided with diary booklets in which to write their assignments, and were instructed to
practice the writing tasks for 2 weeks. Respondents in both conditions received two
emails during this period encouraging them to persist with their writing assignments.
writing task in three weeks’ time, and were asked to go on about their lives as usual.
During the third visit to the laboratory (2 weeks later) participants returned their writing
tasks, and were fitted for post-intervention physiological assessments. The 4th and final
visit, scheduled a week later, was conducted solely to collect completed questionnaires
and to reimburse participants for taking part in the study.
Measures
Background measures. Education, socio-demographic, economic and health variables
(e.g., smoking) were measured by questionnaire.
Well-being measures. In our study SWB was assessed with evaluative, hedonic, and
eudemonic measures, as well as with optimism.
Evaluative well-being was indexed with the Satisfaction with Life Scale (Diener et
al., 1985) rated on a 7-point Likert scale. Scores were summed and higher scores were
reflective of greater life satisfaction. The scores could range from 5 to 35 (Cronbach’s
α= .86).
Hedonic well-being was measured with the Positive Emotional Style scale (Cohen
et al., 2003), which is a shortened version of the scale originally used to study stress and
infectious illness. The scale consisted of 16 adjectives (e.g., “Happy) rated on a 5-point
post-treatment assessment weeks. Average affect ratings were computed for each day, and
were then used to calculate an average weekly positive affect measure excluding days 1
and 7 since they could have been unusual for participants (α= .86).
Emotional distress was assessed with the Hospital Anxiety and Depression Scale
(HADS) (Zigmond and Snaith, 1983). The HADS consists of 14 items referring to
anxiety and depressive symptoms. The items were rated on a 4-point Likert scale, and
total scores (possible range 0-42) were computed (α= .84).
Eudemonic well-being was indexed with the Flourishing Scale (Diener et al., 2010).
This consists of 8 items (e.g. “I lead a purposeful and meaningful life”) rated on a 7-point
Likert scale. The scores were totalled with higher scores reflecting greater eudemonic
well-being (α= .86).
Optimism was measured with the Revised Life Orientation Test (Scheier et al.,
1994) which consists of 6 items rated on a 5-point Likert scale. Scores were summed and
could range from 0 to 24, with higher ones indicating greater optimism (α= .82).
Sleep measures. The Pittsburgh Sleep Quality Index (Buysse et al., 1989) was the
measure of global sleep disturbance. The PSQI comprises of 19 items assessing various
aspects of sleep including duration and efficiency. Apart from sleep duration and latency
were indicative of more disturbed sleep, and in this study the scores ranged from 1 to 15
at baseline (α=.76).
Participants also provided daily sleep quality ratings (ranging from 0=“Very good”
to 3=“Very bad”) over one week at baseline and one week post-intervention. Average
daily sleep quality scores were computed by taking a mean of sleep ratings from nights 2
to 6; responses from nights 1 and 7 were excluded since these could have been unusual
for participants. Higher scores were indicative of poorer sleep quality. For clarity this
measure will be referred to as daily sleep quality in this manuscript.
Biological measures. Cortisol was obtained by taking 7 saliva samples collected using
Salivette plastic tubes (Sarstedt, Leicester, UK). The first sample was collected during
the initial visit to the laboratory between 8:00 and 9:30 am, and the remaining samples
were taken at the following times: sample 2: 10:00 am, sample 3: 12:00 pm, sample 4:
5:00 pm, sample 5: before going to bed. Sample 6 was taken immediately upon waking
up the next day, and sample 7 precisely 30 minutes later. The same procedure of cortisol
collection was followed post-intervention.
We measured BP and HR with the SpaceLabs 90217 ambulatory blood pressure
monitor (Redmond, WA). The monitor was fitted on a participant’s arm by a member of
device was programmed to take readings every 30 minutes, and was worn for at least 10
hours.
Experimental and control writing tasks. The instructions for the writing tasks were an
abridged version of those used by Sheldon and Lyubomirsky (2006). Briefly, we asked
participants in the experimental condition to write a gratitude diary in which they
expressed gratitude towards previously unappreciated people and things in their lives.
Participants in the everyday events condition were requested to write a diary to record
things that happened to them, and/or things that they noticed each day; to keep the task
neutral, respondents were encouraged to notice things and/or events irrespective of
whether they were pleasant, neutral or unpleasant. Participants in the gratitude condition
were asked to express gratitude about 3 things or towards 3 people each day they wrote
in their diary, while those in the everyday events condition were requested to write about
3 events and/or things they noticed on that particular day. Participants in both conditions
were asked to complete 3 writing exercises per week.
We assessed the effort invested into writing the diaries by asking respondents to
note how many times they completed the writing exercises and how much effort they put
into it, with the possible responses being “Very little effort”, “Quite a bit of effort” and
Data Processing
Blood pressure and heart rate. Ambulatory BP and HR recordings were scrutinised for
outliers and failed recordings. Values were then averaged across the recording period.
Participants provided between 10 and 32 values for each variable, with the average
ranging from 21.4 to 26 at different time points.
Cortisol. Cortisol output was analysed by computing two parameters. First, the cortisol
awakening response (CAR) was calculated as the difference between the sample taken on
awakening and 30 minutes later (Chida and Steptoe, 2009). Participants who reported
taking their first sample more than 15 minutes after awakening were excluded from
analyses, since this can lead to erroneous estimations of the CAR (Dockray et al., 2008).
Second, we calculated total cortisol output across the day as the area under the curve
(AUC), using the method described previously (Pruessner et al., 2003). The cortisol AUC
was log transformed prior to analysis.
Statistical analysis
Four participants dropped out of the study (see Fig. 1), but they did not differ from those
who completed the study on any variables described here. The results were analysed on
an intent to treat basis using the last observation carried forward method, but the same
data. We compared the baseline characteristics of the three groups using chi squared and
analysis of variance for categorical and continuous variables, respectively. Responses to
the treatments were assessed using difference scores between baseline and post-treatment
in analysis of covariance with baseline value and age since sleep and SWB may change
with age (Ohayon et al., 2004; Stone et al., 2010). The analyses of physiological variables
included body mass index (BMI) as an additional covariate as it is related to BP and
cortisol (Carroll et al., 2003; Steptoe et al., 2004). Results are presented as mean
difference scores with 95% confidence intervals (C.I.) and P-values.
The associations between changes in SWB and changes in sleep and physiology
were analysed by regressing change in SWB on the change in sleep and physiological
activity, entering age and baseline sleep score as covariates in analyses relating sleep, and
age, BMI and baseline physiological activity in models relating physiological variables.
These analyses were conducted across the whole sample, and the results are presented as
B-values with 95% C.I., and P-values.
Results
Baseline characteristics of participants are summarized in Table 1. Participants were
predominantly well-educated young women with healthy weights and normal BPs. We
did not find any significant differences on demographic, psychological or biological
SWB, sleep and biological measures, conducted across the whole sample, are depicted in
the supplementary table. There were no significant associations between biomarkers and
SWB at baseline, but sleep quality was greater among participants who reported greater
life satisfaction and hedonic well-being. The compliance with writing tasks was good.
The average number of completed writing tasks in the gratitude condition was 5.4
(SD=1.1) and 5.3 (SD=1.2) in the everyday events. In both groups the majority of
participants completed all 6 writing tasks.
Please insert Table 1 around here
Effects of interventions on SWB measures
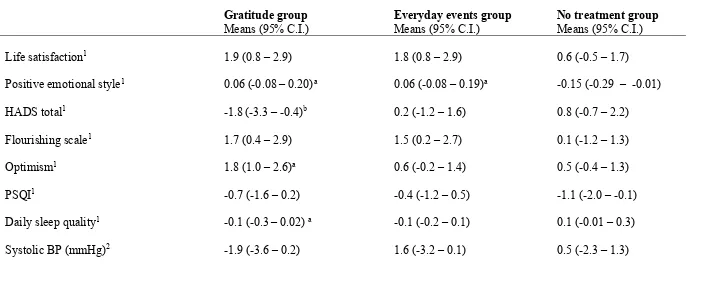
Table 2 summarizes responses to the interventions. There were no differences in changes
in life satisfaction between groups, although improvements in life satisfaction were only
observed in the gratitude and everyday events groups. The increase in positive emotional
style was greater in the gratitude (0.21, C.I. 0.01 – 0.40, P=0.037) and everyday events
(0.20, C.I. 0.01 – 0.40, P=0.033) than no treatment group. The decrease in distress
measured with the HADS was greater in the gratitude than everyday events (2.06, C.I.
-4.05 – -0.06, P=0.057) and no treatment groups (-2.63, C.I. -4.67 – -0.60, P=0.013).
was greater in the gratitude than everyday events (1.24, C.I. 0.08 – 2.40, P=0.043) and no
treatment group (1.40, C.I. 0.15 – 2.52, P=0.028).
To rule out the possibility of over-adjustment we repeated the above analyses
controlling only for age but not for baseline value of SWB measure, however, the results
remained unchanged (data not shown).
Please insert Table 2 around here
Effects of interventions on sleep and biological measures
Daily sleep quality was slightly but significantly improved to a greater extent in the
gratitude group (-0.26, C.I. -0.46 – -0.05, P=0.014)than in the no treatment group. We
did not show any differences in changes in sleep disturbances indexed by the PSQI. Our
analyses of the biological measures revealed no differences between conditions in systolic
BP, HR, or cortisol. However, a greater decrease in ambulatory diastolic BP was recorded
in the gratitude than no treatment condition (-2.00 mmHg, C.I. 0.05 – 3.88, P=0.041) after
adjustment for age and BMI. The everyday events condition showed an intermediate
response that did not differ from the other two groups. The comparison between
experimental conditions therefore showed effects corresponding to the well-being
measures only for diastolic BP. There was no relationship between the number of
When the analyses were repeated controlling only for age (sleep measures) or age
and BMI (biological measures) but not for baseline sleep or biological values, as
appropriate, the results were identical to those in fully adjusted models (data not shown).
Correlations between changes in SWB, sleep and biology
Using data from the whole sample we analysed whether changes in SWB measures were
correlated with favourable changes in sleep indices. Greater increases in positive
emotional style were associated with improved daily sleep quality (B=0.28, C.I. 0.4 –
-0.1, P<0.001), while reduced emotional distress was correlated with lower global sleep
disturbance (B=0.10, C.I. 0.02 – 0.2, P=0.023).
The analyses of biological parameters revealed that participants who reported larger
increases in life satisfaction showed greater reductions in systolic BP (B=0.29, C.I. 0.04
– 0.55, P=0.028), diastolic BP (B=0.32, C.I. 0.15 – 0.52, P=0.003), and HR (B=0.48, C.I.
0.13 – 0.83, P=0.011). Further, the reduction in HADS distress was associated with
greater reductions in diastolic BP (B=0.17, C.I. 0.01 – 0.34, P=0.041); reductions in
diastolic BP were also related to increases in flourishing ratings (B=0.23, C.I. 0.03 – 0.43,
P=0.027). There were no significant associations between changes in SWB and cortisol.
Further analyses without adjustment for baseline values of biological measures were
Discussion
We tested whether an intervention to promote SWB would favourably impact
cardiovascular and neuroendocrine responses as well as self-reported sleep. Two weeks
of keeping a gratitude diary led to reductions of emotional distress as well as increases in
optimism and positive emotional style. The gratitude intervention was also associated
with improved daily sleep quality and with reductions in diastolic BP, when compared
with control conditions. However, flourishing and life satisfaction as well as the
remaining biological parameters were not sensitive to the experimental manipulation.
Notably, we also found that across the complete sample, increases in evaluative, hedonic
and eudemonic measures were correlated with reductions in diastolic BP and HR as well
as with improved daily sleep quality and reduced global sleep disturbance.
Cross-sectional studies are consistent with the notion that SWB may be
health-protective through its direct effects on biological function, but longitudinal data are
lacking. Our study, to the best of our knowledge, is one of the first prospective studies to
demonstrate that increases in SWB are correlated with improved biological function in a
controlled study design, suggesting that changes in positive well-being may drive
healthier biological activity.
In line with the literature (Emmons and McCullough, 2003) our intervention
decreased emotional distress and increased positive emotional style. We also found that
measured in studies that used the gratitude paradigm, so it is difficult to compare our
finding with past research.
We demonstrated that across the whole sample increases in SWB were correlated
with favourable cardiovascular responses in a sample of young healthy women, an
interesting finding since baseline BP was low, potentially leaving little scope for
reductions. The positive effect may be due to the use of ambulatory BP monitoring which
provides an index of BP and HR under naturalistic circumstances, instead of standard
clinical conditions, making it more sensitive to detect even subtle changes. The analysis
of ambulatory data also involved aggregating large numbers of readings over the day,
potentially providing more robust estimates than measures obtained under standard
clinical conditions.
Changes in well-being were not related to cortisol in our investigation. A number
of studies have reported that SWB measures are correlated with lower cortisol levels
(Dockray and Steptoe, 2010), but there are large individual differences in cortisol
concentrations and it is plausible that our study lacked power to detect changes in cortisol
values. Another explanation why cortisol responses were not sensitive to changes in
SWB could be that the study was too short. It is possible that neuroendocrine function
requires more extended periods of enhanced SWB before changes can be recorded.
We found modest associations between increased SWB and sleep since only daily
inconclusive findings may be that our experimental manipulation was too brief or the
changes in SWB were too small to impact sleep perceptions. Nonetheless, to date there
has been only one (published) gratitude intervention that successfully improved sleep,
and our findings partly support these data (Emmons and McCullough, 2003). The
correlational analyses across the whole sample revealed that improvements in SWB were
associated with favourable sleep perceptions, corroborating past evidence (Hamilton et
al., 2007; Steptoe et al., 2008), and lending tentative support to the hypothesis that
well-being may promote better sleep (Phelan et al., 2010).
An important feature of this study was the monitoring of objective markers of
biological function, which are often not included in health-related studies. The
biomarkers were assessed in everyday life outside of the constraints of laboratory settings,
potentially increasing ecological validity. However, our study has limitations. The
sample comprised mostly white, young and university educated women, so findings
cannot be extrapolated to less educated, older, male or more ethnically diverse
populations. The measures described here were assessed in the days after the
experimental manipulation, so our data shed no light on longer term effects of gratitude
paradigm on SWB, sleep and biology. The experimental intervention was only carried
out over a few days, and more extended training may be needed to stimulate more
comprehensive improvements in SWB, sleep and biology. We included an active control
attention from the researchers, the materials provided and tasks scheduled. It is notable
that in the active control condition some of the SWB measures improved
post-intervention, and to some extent these responses mirrored those in the gratitude condition.
A similar trend can be observed across sleep and blood pressure measures, tentatively
suggesting that our results show a difference between active and no treatment groups,
rather than between the gratitude and two control conditions. It is plausible that by asking
participants to pay attention to everyday events we might have increased their
mindfulness. Since mindfulness can reduce anxiety, depressive symptoms and stress
(Fjorback et al., 2011), the everyday events condition may have functioned as a mild
intervention instead of a neutral condition. We collected a large number of measures, but
so as to not increase participant burden any further we did not ask them to wear blood
pressure monitors at night. It would also have been valuable also to include other
measures such as heart rate variability, or inflammation. Finally, we focused only on
self-reported sleep, which is susceptible to biases (Jackowska et al., 2011).
Notwithstanding, our study suggests that enhanced SWB is correlated with
favourable sleep perceptions and cardiovascular responses. This is consistent with the
hypothesis that SWB contributes towards lower morbidity and mortality through healthier
biological function and restorative health behaviour.
References
Boehm JK and Kubzansky LD (2012) The heart's content: the association between
positive psychological well-being and cardiovascular health. Psychological
Bulletin 138(4): 655-691.
Boehm JK, et al. (2011) A longitudinal experimental study comparing the effectiveness
of happiness-enhancing strategies in Anglo Americans and Asian Americans.
Cognition & Emotion 25(7): 1263-1272.
Buysse DJ, et al. (1989) The Pittsburgh Sleep Quality Index: a new instrument for
psychiatric practice and research. Psychiatry Research 28(2): 193-213.
Buchanan TW, et al (1999) Cortisol fluctuates with increases and decreases in negative
affect. Psychoneuroendocrinology 24(2):227-241.
Cappuccio FP, et al. (2011) Sleep duration predicts cardiovascular outcomes: a systematic
review and meta-analysis of prospective studies. European Heart Journal 32(12):
1484-1492.
Carroll D, et al. 2003 Blood pressure reactions to stress and the prediction of future blood
pressure: effects of sex, age, and socioeconomic position. Psychosomatic
Medicine 65(6): 1058-1064.
Chida Y and Steptoe A (2009) Cortisol awakening response and psychosocial factors: a
Chida Y and Steptoe A (2008) Positive psychological well-being and mortality: a
quantitative review of prospective observational studies. Psychosomatic Medicine
70(7): 741-756.
Cohen S, et al. (2003) Emotional style and susceptibility to the common cold.
Psychosomatic Medicine 65(4): 652-657.
Diener E, et al. (1985) The Satisfaction with Life Scale. Journal of Personality
Assessment 49(1): 71-75.
Diener E, et al. (2010) New well-being measures: short scales to assess flourishing and
positive and negative feelings. Social Indicators Research 97(2): 143-156.
Dockray S and Steptoe A (2010) Positive affect and psychobiological processes.
Neuroscience and Biobehavioral Reviews 35(1): 69-75.
Dockray S, et al. (2008) The cortisol awakening response in relation to objective and
subjective measures of waking in the morning. Psychoneuroendocrinology 33(1):
77-82.
Emmons RA and McCullough ME (2003) Counting blessings versus burdens: an
experimental investigation of gratitude and subjective well-being in daily life.
Journal of Personality and Social Psychology 84(2): 377-389.
Endrighi R, et al. (2011) Associations of trait optimism with diurnal neuroendocrine
activity, cortisol responses to mental stress, and subjective stress measures in
Fjorback LO, et al. (2011) Mindfulness-based stress reduction and mindfulness-based
cognitive therapy - a systematic review of randomized controlled trials. Acta
Psychiatrica Scandinavica 124(2):102-119.
Fredrickson BL, et al. (2013) A functional genomic perspective on human well-being.
Proceedings of the National Academy of Sciences 110(33): 13684-13689.
Fredrickson BL and Joiner T (2002) Positive emotions trigger upward spirals toward
emotional well-being. Psychological Science 13(2): 172-175.
Gallagher MW and Lopez SJ (2009) Positive expectancies and mental health: identifying
the unique contributions of hope and optimism. The Journal of Positive
Psychology 4(6): 548-556.
Goldberg DP, et al. (1997) The validity of two versions of the GHQ in the WHO study of
mental illness in general health care. Psychological Medicine 27(1): 191-197.
Hamilton NA, et al. (2007) Insomnia and well-being. Journal of Consulting and Clinical
Psychology 75(6): 939-946.
Hucklebridge F, et al. (2000) Modulation of Secretory Immunoglobulin A in saliva:
Response to manipulation of mood. Biological Psychology 53: 25–35.
Ikeda A, et al. (2011) Optimism in relation to inflammation and endothelial dysfunction
in older men: the VA Normative Aging Study. Psychosomatic Medicine 73(8):
Jackowska M, et al. (2011) Psychosocial factors and sleep efficiency: discrepancies
between subjective and objective evaluations of sleep. Psychosomatic Medicine
73(9): 810-816.
Jenkins CD, et al. (1988) A scale for the estimation of sleep problems in clinical research.
Journal of Clinical Epidemiology 41(4): 313-321.
Kashdan TB, et al. (2008) Reconsidering happiness: The costs of distinguishing between
hedonics and eudaimonia. The Journal of Positive Psychology 3(4): 219-233.
Kim ES, et al. (2014) Purpose in life and use of preventive health care services.
Proceedings of the National Academy of Sciences 111(46): 16331-16336.
Kok BE and Fredrickson BL (2010) Upward spirals of the heart: Autonomic flexibility,
as indexed by vagal tone, reciprocally and prospectively predicts positive
emotions and social connectedness. Biological psychology 85(3): 432-436.
Kubzansky LD and Thurston RC (2007) Emotional vitality and incident coronary heart
disease: benefits of healthy psychological functioning. Archives of General
Psychiatry 64(12): 1393-1401.
Kahneman D and Deaton A (2010) High income improves evaluation of life but not
emotional well-being. Proceedings of the National Academy of Sciences of the
United States of America 107(38): 16489-16493.
Lyubomirsky S, et al. (2005) The benefits of frequent positive affect: does happiness lead
Ohayon MM, et al. (2004) Meta-analysis of quantitative sleep parameters from childhood
to old age in healthy individuals: developing normative sleep values across the
human lifespan. Sleep 27(7): 1255-1273.
Phelan CH, et al. (2010) Psychosocial predictors of changing sleep patterns in aging
women: a multiple pathway approach. Psychology and Aging 25(4): 858-866.
Pressman SD and Cohen S (2005) Does positive affect influence health?. Psychological
Bulletin 131(6): 925.
Pruessner JC, et al. (2003) Two formulas for computation of the area under the curve
represent measures of total hormone concentration versus time-dependent change.
Psychoneuroendocrinology 28(7): 916-931.
Ryan RM and Deci EL (2001) On happiness and human potentials: a review of research
on hedonic and eudaimonic well-being. Annual Review of Psychology 52:
141-166.
Ryff CD, et al. (2006) Psychological well-being and ill-being: do they have distinct or
mirrored biological correlates? Psychotherapy and Psychosomatics 75(2): 85-95.
Scheier MF, et al. (1994) Distinguishing optimism from neuroticism (and trait anxiety,
self-mastery, and self-esteem): a reevaluation of the Life Orientation Test. Journal
Sheldon KM and Lyubomirsky S (2006) How to increase and sustain positive emotion:
the effects of expressing gratitude and visualizing best possible selves. The
Journal of Positive Psychology 1(2): 73-82.
Steptoe A, et al. (2004) Central adiposity and cortisol responses to wakening in
middle-aged men and women. International Journal of Obesity 28: 1168-1173.
Steptoe A, et al. (2005) Positive affect and health-related neuroendocrine, cardiovascular,
and inflammatory processes. Proceedings of the National academy of Sciences of
the United States of America 102(18): 6508-6512.
Steptoe A, et al. (2009) Positive affect and psychobiological processes relevant to health.
Journal of Personality 77(6): 1747-1776.
Steptoe A, et al. (2012) Distinctive biological correlates of positive psychological
well-being in older men and women. Psychosomatic Medicine 74(5): 501-508.
Steptoe A, et al. (2008) Positive affect, psychological well-being, and good sleep. Journal
of Psychosomatic Research 64(4): 409-415.
Steptoe A, et al. (2014) Subjective wellbeing, health, and ageing. The Lancet(In Press).
Stone AA and Mackie C (2013) Subjective Well-Being: Measuring Happiness, Suffering,
and Other Dimensions of Experience Washington, DC, National Acedemies
Stone AA, et al. (2010) A snapshot of the age distribution of psychological well-being in
the United States. Proceedings of the National Academy of Sciences of the United
States of America 107(22): 9985-9990.
Telzer EH, et al. (2014) Neural sensitivity to eudaimonic and hedonic rewards
differentially predict adolescent depressive symptoms over time. Proceedings of
the National Academy of Sciences of the United States of America 111(18):
6600-6605.
Vahtera J, et al. (2006) Sleep disturbances as a predictor of long-term increase in sickness
absence among employees after family death or illness. Sleep 29(5): 673-682.
Wood AM, et al. (2010) Gratitude and well-being: a review and theoretical integration.
Clinical Psychology Review 30(7): 890-905.
Zigmond AS and Snaith RP (1983) The Hospital Anxiety and Depression Scale. Acta
[image:30.842.94.792.175.457.2]
Table 1. Baseline characteristics of participants in the three experimental conditions
Gratitude group (n = 40)
Means(95% C.I. /frequency(%)
Everyday events group (n = 41)
Means(95% C.I. /frequency(%)
No treatment group (n = 38)
Means(95% C.I,) /frequency(%)
Age (years) 26.0 (24.5 – 27.5) 26.8 (25.2 – 28.3) 26.0 (24.4 – 27.6)
Education (graduate or higher) 17 (42.5%) 19 (46.3%) 15 (39.5%)
Ethnicity (minority status) 13 (32.5%) 10 (24.4%) 10 (26.3%)
Household income (>£20,000) 26 (65.0%) 23 (56.1%) 21 (55.3%)
Body mass index (kg/m2) 22.4 (21.2 – 23.6) 22.3 (21.4 – 23.2) 22.5 (21.5 – 23.5)
Life satisfaction1 23.1 (21.2 – 25.1) 21.7 (19.8 – 23.7 ) 22.9 (20.8 – 24.9)
Gratitude group (n = 40)
Means(95% C.I. /frequency(%)
Everyday events group (n = 41)
Means(95% C.I. /frequency(%)
No treatment group (n = 38)
Means(95% C.I,) /frequency(%)
HADS total1 13.4 (11.6 – 15.2) 13.5 (11.8 – 15.3) 12.9 (11.1 – 14.8)
Flourishing scale1 42.2 (39.9 – 44.5) 41.8 (39.6 – 44.1) 43.6 (41.2 – 46.0)
Optimism1 15.5 (13.9 – 17.2) 14.7 (13.1 – 16.2) 13.9 (12.3 – 16.2)
PSQI1 6.3 (5.5-7.2) 6.2 (5.4-7.1) 7.0 (6.1-7.8)
Daily sleep quality1 1.1 (1.0-1.2) 1.0 (0.8-1.1) 0.9 (0.8-1.1)
Systolic BP (mmHg)2
(n = 117)
112.6 (110.2 – 115.1) 112.2 (109.8 – 114.5) 115.5 (113.0 – 118.0)
Diastolic BP (mmHg)2
(n = 115)
Gratitude group (n = 40)
Means(95% C.I. /frequency(%)
Everyday events group (n = 41)
Means(95% C.I. /frequency(%)
No treatment group (n = 38)
Means(95% C.I,) /frequency(%) (n = 117)
Cortisol awakening response (nmol/l)2
(n = 105)
8.4 (5.0 – 11.7) 7.1 (3.6 – 10.6) 8.4 (5.0 – 11.9)
Cortisol AUC (log, nmol/l)2
(n = 115)
9.5 (9.4 – 9.6) 9.5 (9.4 – 9.6) 9.6 (9.5 – 9.7)
1Adjusted for age.
[image:33.842.85.789.172.458.2]
Table 2. Changes in psychological, sleep and biological outcomes in the three experimental conditions
Gratitude group
Means (95% C.I.) Everyday events group Means (95% C.I.) No treatment group Means (95% C.I.)
Life satisfaction1 1.9 (0.8 – 2.9) 1.8 (0.8 – 2.9) 0.6 (-0.5 – 1.7)
Positive emotional style1 0.06 (-0.08 – 0.20)a 0.06 (-0.08 – 0.19)a -0.15 (-0.29 – -0.01)
HADS total1 -1.8 (-3.3 – -0.4)b 0.2 (-1.2 – 1.6) 0.8 (-0.7 – 2.2)
Flourishing scale1 1.7 (0.4 – 2.9) 1.5 (0.2 – 2.7) 0.1 (-1.2 – 1.3)
Optimism1 1.8 (1.0 – 2.6)a 0.6 (-0.2 – 1.4) 0.5 (-0.4 – 1.3)
PSQI1 -0.7 (-1.6 – 0.2) -0.4 (-1.2 – 0.5) -1.1 (-2.0 – -0.1)
Daily sleep quality1 -0.1 (-0.3 – 0.02)a -0.1 (-0.2 – 0.1) 0.1 (-0.01 – 0.3)
Diastolic BP (mmHg)2 -1.2 (-3.1 – -0.4)a -0.4 (-1.7 – 0.9) 0.2 (-1.1 – 1.6)
HR (bpm)2 -0.5 (-2.9 – 1.9) 0 (-2.3 – 2.3) 1.4 (-1.0 – 3.9)
Cortisol awakening response (nmol/l)2 -1.1 (-4.2 – 2.1) -3.1 (-6.4 – 0.1) -2.2 (-5.4 – 0.9)
Cortisol AUC (log, nmol/l)2 -0.1 (-0.2 – 0.1) -0.1 (-0.2 – 0.1) -0.1 (-0.2 – -0.02)
1Adjusted for age; 2Adjusted for age and BMI.