0095-1137/10/$12.00 doi:10.1128/JCM.01101-10
Copyright © 2010, American Society for Microbiology. All Rights Reserved.
Normalized Resistance Interpretation as a Tool for Establishing
Epidemiological MIC Susceptibility Breakpoints
䌤
Go
¨ran Kronvall*
Department of Microbiology and Tumor Biology–MTC, Clinical Microbiology, Karolinska Institutet, Karolinska University Hospital Solna, Stockholm, Sweden
Received 1 June 2010/Returned for modification 2 September 2010/Accepted 24 September 2010
Normalized resistance interpretation (NRI) utilizes the fact that the wild-type population on the sensitive side is not affected by resistance development, and therefore a normalized reconstruction of the peak can be performed. The method was modified for MIC distributions by the introduction of helper variables, in-between
values assigned the mean of the neighboring numbers of isolates. This method was used on
Staphylo-coccus aureus and Escherichia coli MIC distributions for 27 antimicrobials each and obtained from the EUCAST (European Committee on Antimicrobial Susceptibility Testing) website (http://www.eucast.org/mic _distributions/). The number of isolates in each of the 54 distributions ranged from 40 to 124,472. NRI
produced normalized distributions in all cases. Cutoff values were calculated forⴙ2.0 and ⴙ2.5 standard
deviations (SD) above the means and then rounded up to nearest regular MIC dilution step. EUCAST also
show cutoff values, ECOFF values, which were used as the reference. The NRI generatedⴙ2.0 SD values
showed the best agreement with 26 of 27 withinⴞ1 dilution step and 17 exactly on the ECOFF values for
Staphylococcus aureus, and 25 of 27 withinⴞ1 dilution step and 14 right on the ECOFF values forEscherichia
coli. NRI offers an objective method for the reconstruction of the wild-type population in an MIC distribution
for a given bacterial species and an antimicrobial agent. This method offers a new tool in comparative susceptibility studies such as global surveillance of resistance, as well as in quality control in individual laboratories.
Traditional concepts for setting interpretive breakpoints in antimicrobial susceptibility testing were challenged by J. D. Williams in 1990 when he proposed the setting of so-called microbiological guidelines in relation to the distribution of inhibition zone diameter values (or MIC values) of the suscep-tible population, for instance two standard deviations (SD) below the mode inhibition zone size (24). This would require a species-related aspect which was not yet accepted, although some reports on this issue had been published (2, 12, 14). Earlier, O’Brien had shown that an adjustment of interpretive breakpoints in relation to the susceptible peak in zone diam-eter histograms made results from different laboratories com-parable and thereby foresaw later developments (17). In recent years, the term epidemiological breakpoints or epidemiologi-cal cutoff (ECOFF), has been proposed by the European Com-mittee on Antimicrobial Susceptibility Testing (EUCAST) to describe the upper MIC limit of the susceptible peak in an MIC distribution, the wild-type (WT) population. MIC distri-butions of WT isolates species-wise for many antimicrobials have been published on the internet by EUCAST and are publicly available (http://www.eucast.org/mic_distributions/) (5, 6).
Normalized resistance interpretation (NRI) is an objective method to define the WT population in inhibition zone diam-eter histograms (4, 8, 10). The method has been used for setting interpretive breakpoints in an 18-year resistance
sur-veillance, and also in an investigation of meropenem
suscep-tibility inPseudomonas aeruginosa(3, 22). It was recently used
extensively in marine microbiology by P. Smith et al. (19–21). NRI was also used successfully to analyze Etest MIC data to set epidemiological breakpoints for tigecycline (11). However, a direct application of NRI to regular 2-fold dilution MIC results has not been possible because the mathematical calcu-lations will be based on too few data points. The use of NRI has been extended in the present investigations to regular MIC values by the introduction of helper variables, and NRI has been evaluated as a method for the objective estimation of epidemiological breakpoints using the EUCAST MIC distri-butions as the material and as the reference (http://www.eucast .org/mic_distributions/).
MATERIALS AND METHODS
MIC distributions.The publicly available EUCAST MIC distributions include a large number of bacterial species and antimicrobials (http://www.eucast.org /mic_distributions/). For the purpose of testing the NRI method for MIC distri-butions in the present studies, results forStaphylococcus aureusandEscherichia coliwere used. EUCAST claim on their website that the “Histograms display WT organisms.” It is not clear, however, which method is used to ensure this selection in the published materials, which can include as many as⬎100,000 isolates for a single combination of antimicrobial agent and species. It is apparent from the distributions that in many cases these selections do include non-WT organisms as well.
MIC zone data from EUCAST were also obtained from the ESCMID Year-book 2009/2010 (p. 45) forEscherichia coliand cefotaxime and used for the calculation of the regression line for this combination of species and antimicro-bial (http://www.escmid.org/escmid_library/publications/escmid_yearbook/). The regression line was calculated for 2-log MIC values⫹9 on thexaxis and the squared inhibition zone diameter on theyaxis for optimal linearity (7).
NRI.The NRI method utilizes the fact that the upper part of the WT popu-lation in a zone diameter histogram or the lower part in an MIC distribution is
* Mailing address: Clinical Microbiology L2:02, Karolinska University Hospital Solna, SE-17176 Stockholm, Sweden. Phone: 46-8-51774910. Fax: 46-8-308099. E-mail: [email protected].
䌤Published ahead of print on 6 October 2010.
4445
on May 16, 2020 by guest
http://jcm.asm.org/
not affected by the occurrence of resistant isolates and therefore the WT pop-ulation can be reconstructed (4, 8, 10). The method was developed by using inhibition zone diameter histograms but has also been applied to Etest MIC distributions as described earlier (11). In the present studies the EUCAST MIC distributions used in the experiments were determined by using conventional 2-log dilution steps. In order to make such distributions possible to analyze with NRI, we used helper variables in the following way. The independent variable was expanded to include values between the regular 2-log values in the MIC distribution. The number of isolates for these intermediate MIC values were set to the mean of the numbers of isolates for the two neighboring regular MIC values, thereby creating the helper variable. This expanded distribution with more data points made the calculations mathematically possible. However, the distributions were broader, and the regular parameter settings chosen for zone diameter histograms had to be changed for MIC distributions to a slight peak adjustment toward the susceptible side (4). These fixed parameter settings were used throughout. The cutoff values were determined at 2.0 and 2.5 SD above the calculated means of the normalized WT curves.
The actual NRI calculations were performed as described earlier with MIC values converted to 2-log values⫹9 as in a traditional regression line and then to zone diameter equivalents in order to be able to use a computer program developed for inhibition zone diameter histogram analysis (NRI was used with permission from the patent holder, Bioscand AB [Ta¨by, Sweden]. The NRI method is protected under U.S. patent 7,465,559 and European patent 1383913) (11). This procedure using zone equivalents has nothing to do with any true inhibition zones but is merely an aid in the calculations. A direct calculation according to NRI principles using log MIC is also possible.
RESULTS
The NRI method was applied to 27 antimicrobial MIC
dis-tributions forS. aureusand to 27 distributions forE. coli, all of
them obtained from the public website of EUCAST. NRI with
helper variables produced normal distributions of WT isolates in all of these 54 cases, irrespective of the variation in number of isolates in the individual distributions, with numbers ranging from 40 to 124,472 (Tables 1 and 2). The introduction of helper variables therefore made NRI calculations possible also for regular MIC distributions.
Epidemiological cutoff values were calculated from the NRI
results at⫹2.0 and ⫹2.5 SD from the NRI means and are
shown in Tables 1 and 2. These cutoff values were rounded up to the nearest MIC value and compared to the corresponding
ECOFF given by EUCAST. For the 27S. aureusdistributions,
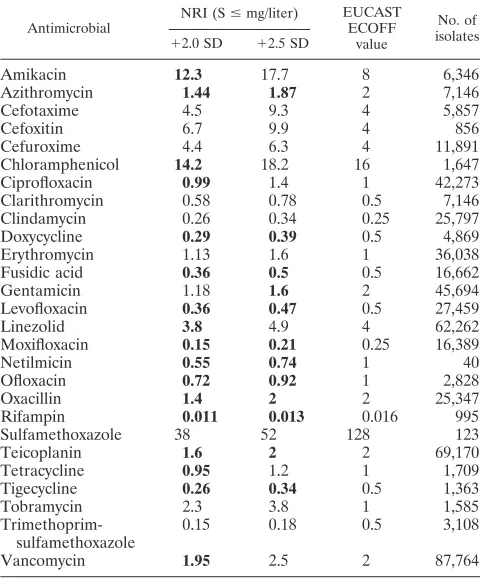
the cutoff values at the⫹2.0 SD level corresponded in 17 cases
to the EUCAST ECOFF values; in two cases the values were one step below, in seven cases they were one step above, and in one case they were two steps above the ECOFF values. At
the ⫹2.5 SD level commonly used for NRI analysis of zone
diameter histograms, the calculated cutoff values corresponded in 12 cases to the ECOFF values; in 2 cases they were one step below, in 9 cases they were one step above, and in 4 cases they
were two steps above. For the 27E. colidistributions, the cutoff
values at the⫹2.0 SD level corresponded in 14 cases to the
ECOFF values; in 1 case they were two steps below, in 5 cases they were one step below, in 6 cases they were one step above, and in 1 case they were two steps above the respective ECOFF
values. At the⫹2.5 SD level, the figures were in 11 cases right
[image:2.585.302.542.81.379.2]at the ECOFF level, in 3 cases they were one step below, in 11
TABLE 1. NRI analysis of 27S. aureusMIC distributionsa
Antimicrobial
NRI (Sⱕmg/liter) EUCAST ECOFF
value
No. of isolates
⫹2.0 SD ⫹2.5 SD
Amikacin 12.3 17.7 8 6,346
Azithromycin 1.44 1.87 2 7,146
Cefotaxime 4.5 9.3 4 5,857
Cefoxitin 6.7 9.9 4 856
Cefuroxime 4.4 6.3 4 11,891
Chloramphenicol 14.2 18.2 16 1,647
Ciprofloxacin 0.99 1.4 1 42,273
Clarithromycin 0.58 0.78 0.5 7,146
Clindamycin 0.26 0.34 0.25 25,797
Doxycycline 0.29 0.39 0.5 4,869
Erythromycin 1.13 1.6 1 36,038
Fusidic acid 0.36 0.5 0.5 16,662
Gentamicin 1.18 1.6 2 45,694
Levofloxacin 0.36 0.47 0.5 27,459
Linezolid 3.8 4.9 4 62,262
Moxifloxacin 0.15 0.21 0.25 16,389
Netilmicin 0.55 0.74 1 40
Ofloxacin 0.72 0.92 1 2,828
Oxacillin 1.4 2 2 25,347
Rifampin 0.011 0.013 0.016 995
Sulfamethoxazole 38 52 128 123
Teicoplanin 1.6 2 2 69,170
Tetracycline 0.95 1.2 1 1,709
Tigecycline 0.26 0.34 0.5 1,363
Tobramycin 2.3 3.8 1 1,585
Trimethoprim-sulfamethoxazole
0.15 0.18 0.5 3,108
Vancomycin 1.95 2.5 2 87,764
[image:2.585.43.283.82.373.2]aThe cutoff values at⫹2.0 and⫹2.5 SD from the means of the calculated normal distributions are shown, as well as the ECOFF values given by EUCAST. The numbers of isolates in the 27 distributions are also indicated. Values in agreement with EUCAST values are indicated in boldface.
TABLE 2. NRI analysis of 27E. coliMIC distributionsa
Antimicrobial
NRI (Sⱕmg/liter) EUCAST ECOFF
value
No. of isolates
⫹2.0 SD ⫹2.5 SD
Amikacin 7.8 10.8 8 10,917
Amoxicillin-clavulanic acid
16.9 24.1 8 56,847
Ampicillin 10.8 15.1 8 39,220
Cefotaxime 0.28 0.39 0.25 10,829
Cefoxitin 13 19 16 66,874
Ceftazidime 0.48 0.68 0.5 15,136
Cefuroxime 10.4 14.6 8 124,472
Chloramphenicol 21.5 29.9 16 11,725
Ciprofloxacin 0.031 0.04 0.032 17,877
Doxycycline 6.7 9.8 4 3,653
Gentamicin 2 2.8 2 43,924
Imipenem 0.49 0.69 0.5 16,667
Levofloxacin 0.082 0.1 0.25 9,144
Amdinocillin 0.49 0.68 1 1,636
Meropenem 0.05 0.066 0.125 8,005
Moxifloxacin 0.14 0.19 0.25 3,219
Nalidixic acid 8.9 11.9 16 5,190
Netilmicin 0.9 1.15 2 6,011
Nitrofurantoin 34 45 64 3,938
Norfloxacin 0.09 0.12 0.25 654
Ofloxacin 0.2 0.25 0.25 3,680
Piperacillin 4.4 5.9 8 25,906
Tetracycline 4.1 5.4 8 7,521
Tigecycline 0.52 0.68 1 4,238
Tobramycin 2.2 3 2 28,424
Trimethoprim 1.3 1.78 2 8,198
Trimethoprim-sulfamethoxazole
0.21 0.28 1 7,712
a
The cutoff values at⫹2.0 and⫹2.5 SD from the means of the calculated normal distributions are shown, as well as the ECOFF values given by EUCAST. The numbers of isolates in the 27 distributions are also indicated. Values in agreement with EUCAST values are indicated in boldface.
on May 16, 2020 by guest
http://jcm.asm.org/
cases they were one step above, and in 2 cases they were two steps above the ECOFF values. It seems that the cutoff values
set at⫹2.0 SD above the mean of the NRI generated normal
distributions corresponded best with the ECOFF values issued by EUCAST.
The deviations from the ECOFF values might be due to a number of influencing factors. One such possible factor was
the size of the material in the distributions. FifteenS. aureus
distributions had lower than 10,000 isolates included. When the degree of deviation from the ECOFF values for these 15 distributions were compared to the 12 with a higher number of
isolates there was no difference, neither for the⫹2.0 SD cutoff
nor for the⫹2.5 SD cutoff values. AmongE. colidistributions
there was a tendency toward higher cutoff values for the 13 distributions with more than 10,000 isolates compared to the
14 distributions with lower numbers, both for the⫹2.0 SD and
the⫹2.5 SD cutoff values. This was further analyzed by using
Pearson Correlation and found significant, with two-tailed sig-nificances of 0.018 and 0.021, respectively. This correlation does not explain the differences noted for several combinations of species and antimicrobial between NRI-generated cutoff values and the ECOFF values of EUCAST. Unfortunately, the method for their estimation of epidemiological cutoff values is not clear from the information on their website, so a further analysis of individual distributions will have to await clarifica-tion on this point.
Examples of NRI calculations on MIC distributions are
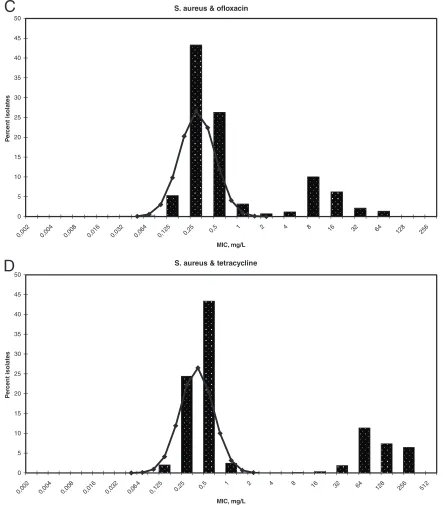
shown in Fig. 1 and Fig. 2. All fourS. aureusMIC distributions
in Fig. 1 were clearly bimodal, indicating that these distribu-tions do in fact contain non-WT isolates with some kind of antimicrobial resistance. The ECOFF values given for these
antimicrobials and S. aureus also testify to this fact. For
azithromycin (Fig. 1A), the NRI-derived cutoff values at⫹2.0
and⫹2.5 SD were 1.44 and 1.87 mg/liter, respectively,
suggest-ing a cutoff value (S) ofⱕ2 mg/liter, which is identical to the
EUCAST ECOFF value. ForS. aureusand erythromycin (Fig.
1B), the NRI derived cutoff values were 1.13 and 1.6 mg/liter at
⫹2.0 and⫹2.5 SD, respectively, which rounded up to 2 mg/
liter, whereas the ECOFF value was 1.0 mg/liter. ForS. aureus
and ofloxacin (Fig. 1C), the rounded up NRI cutoff values and the ECOFF value were the same: 1.0 mg/liter. When it comes toS. aureusand tetracycline (Fig. 1D), the⫹2.0 SD value 0.95 corresponded to the ECOFF value of 1.0 mg/liter, whereas the
⫹2.5 SD value of 1.2 would give a cutoff 2.0 mg/liter.
TheE. colidistribution of cefotaxime MIC values (Fig. 2A) showed a largely unimodal pattern with an ECOFF value of 0.25 mg/liter. The NRI-derived cutoff values were 0.28 and 0.39
mg/liter, which give an adjusted figure of Sⱕ0.5 mg/liter, one
step higher than the ECOFF value. For this particular combi-nation, some additional EUCAST data are available in the ESCMID YearBook 2009/2010 (p. 45) (1). From this informa-tion a regression line between MIC values and inhibiinforma-tion zone diameters could be calculated. The recommended clinical
cut-off value for susceptibility was S ⱕ 1 mg/liter, and for disc
diffusion tests it was Sⱖ21 mm. However, from the EUCAST
data regression line, their MIC breakpoint corresponded to an
inhibition zone breakpoint of Sⱖ19, whereas the NRI MIC
cutoff and the ECOFF value corresponded to Sⱖ21 mm and
Sⱖ23 mm, respectively. It is interesting that the
NRI-gener-ated MIC cutoff value of 0.5 mg/liter gave the same inhibition
zone value as the EUCAST inhibition zone breakpoint, Sⱖ
21 mm, as calculated from the regression line made from EUCAST data.
Doxycycline susceptibility is usually deduced from tetracy-cline susceptibility results, but the doxycytetracy-cline MIC
distribu-tion for E. coli was interesting (Fig. 2B). The pattern was
bimodal but with an apparent overlap. Still, NRI clearly de-fined a WT population which trailed into the 8 to 64 mg/liter region with a large number of non-WT isolates. The ECOFF is set to 4 mg/liter, but the NRI-derived normal distribution
showed cutoff values of 6.7 and 9.8 mg/liter at⫹2.0 and⫹2.5
SD, respectively. The⫹1.0 SD cutoff was 3.1 mg/liter, which is
closer to the ECOFF value.
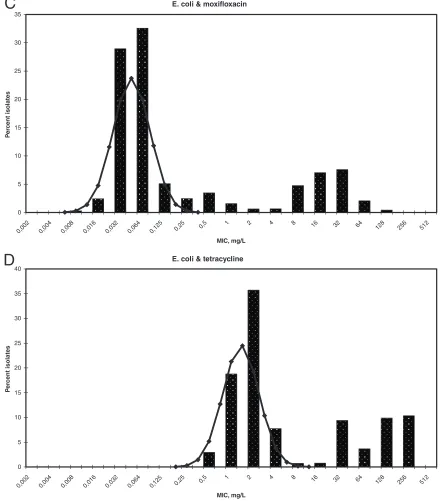
The MIC distribution forE. coliand moxifloxacin (Fig. 2C)
showed a pattern with two major peaks and a tendency toward a third peak in between. The WT peak was clearly identified using NRI, and the resultant cutoff values corresponded
ex-actly to the ECOFF value of 0.25 mg/liter. WhenE. coliand
tetracycline (Fig. 2D) was analyzed and compared to the doxy-cycline distribution (Fig. 2B), there was a good separation of the WT peak from isolates with resistance. Also, for this anti-microbial the rounded up cutoff values were the same as the ECOFF value of 8 mg/liter.
DISCUSSION
The NRI method was modified for the analysis of MIC distributions by the introduction of helper variables and tested on 54 EUCAST distributions from their public website (http: //www.eucast.org/mic_distributions/). The 54 MIC distribu-tions consisted of from 40 to 124,472 isolates and, for all of them, NRI produced a normal distribution peak corresponding to the apparent WT population. Epidemiological breakpoints
were calculated from the NRI results at ⫹2.0 and ⫹2.5 SD
above the mean and were compared to the ECOFF values
published by EUCAST. The ⫹2.0 SD cutoff values
corre-sponded best to the ECOFF values. For the 27 S. aureus
distributions, 26 were within⫾1 step and 17 were right on the
ECOFF values. For the 27 E. coli distributions, 25 were
within⫾1 step and 14 right on the ECOFF values. NRI thus
represents an objective method for estimating the WT popu-lation in both MIC distributions and inhibition zone histo-grams. NRI was recently used in a retrospective 30-year
fol-low-up onS. aureusand E. coli resistance development at a
university hospital (9). Several changes in the methodology during these 30 years made a direct comparison of the suscep-tibility interpretations invalid, but with NRI-generated zone diameter cutoff values, such a comparison was made possible. NRI therefore shows a great potential as a tool in surveillance work. In the present studies these possibilities have been ex-tended to include MIC results. NRI is an objective method that now can be applied to both zone diameter histograms and MIC distributions and can therefore be used when an estimation of epidemiological breakpoints is of interest, for instance in com-parative studies, including different laboratories and countries. One problem in the present comparison with EUCAST ECOFF values is the lack of reference to the methods used by EUCAST for setting these values. Since there is no other golden standard available, the EUCAST values were taken as the true reference. However, from the MIC distribution shown
on May 16, 2020 by guest
http://jcm.asm.org/
in Fig. 2B it is already clear that an MIC ECOFF of 4 mg/liter is too low to include all WT isolates. The ECOFF value seems to have been adjusted in order to minimize possible errors identify-ing resistant isolates as susceptible WT. Whether more such con-siderations are included in the list of ECOFF values is not clear at present. Another question arises from the fact that on the EUCAST website for MIC distributions is stated that “histograms display WT organisms, together with EUCAST clinical break-points and epidemiological cutoff values (ECOFFs)” (http://www .eucast.org/mic_distributions/). A method for selecting WT
or-ganisms has not been established, and many distributions do in fact contain non-WT organisms. At present, the EUCAST data can be considered the best data available, and therefore the com-parisons in the present studies utilized EUCAST data as the golden standard.
The best agreement between NRI generated cutoff values
and ECOFF values were with NRI cutoff values set at⫹2.0 SD.
[image:4.585.71.512.72.567.2]This would suggest that 97.7% of the WT isolates are included in the calculated WT peak. In reality, this figure might be even higher when some additional facts are taken into account.
FIG. 1.S. aureusMIC distributions for azithromycin (A), erythromycin (B), ofloxacin (C), and tetracycline (D). Diagram bars show the percent S. aureusisolates as given on the EUCAST website. The NRI-derived normal distributions of WT isolates are indicated by line graphs.
on May 16, 2020 by guest
http://jcm.asm.org/
First, the exact figure from NRI calculations is rounded up, thereby including more isolates. Second, an analysis of the WT peak in an inhibition zone diameter histogram showed that the WT population was slightly peaked and skewed toward higher zone values (13). This would also apply to MIC distributions, although the precision is lower compared to disc diffusion tests. The upper part of the WT MIC distribution thus ends more abruptly compared to a normal distribution, raising the figure for WT isolates included slightly higher.
Turnidge et al. have published another method for the
esti-mation of epidemiological cutoff values in MIC distributions (23). These researchers used nonlinear regression on cumula-tive 2-log MIC data and iterated analysis to find the optimum subset of data representing the WT population. This optimum was found when the difference between the estimated and the true number of isolates in the fitted subset was minimal. This method has the advantage of giving a more detailed statistical analysis of the MIC distributions. They published information
on the analysis of threeS. aureus distributions (vancomycin,
[image:5.585.71.514.70.575.2]linezolid, fusidic acid) and fourE. colidistributions (imipenem,
FIG. 1—Continued.
on May 16, 2020 by guest
http://jcm.asm.org/
ampicillin, cefotaxime, and gentamicin) made from pooled data, and their epidemiological cutoff values corresponded to those of EUCAST for six of them (23). Five of these six distributions gave the same cutoff values using NRI
calcula-tions at the⫹2.0 SD level. ForE. coliand cefotaxime, their
cutoff value was 0.5, which was the same as the NRI-generated cutoff value obtained in the present studies. From a linear regression analysis of MIC zone data from EUCAST it was apparent that the recommended clinical inhibition zone
break-point of EUCAST, S ⱖ 21 mm, corresponded to the MIC
cutoff value of Turnidge et al., as well as the cutoff values calculated using NRI in the present studies (23).
[image:6.585.73.514.70.564.2]The initiative by EUCAST to make MIC distributions avail-able on the internet represents an important step for interna-tional cooperation in clinical microbiology. The fact that all distributions are species specific also emphasizes the fact that individual bacterial species show a more or less unique re-sponse to a given antimicrobial. The trend in Europe at present is to use species-related interpretations and also in this regard EUCAST is in the forefront, issuing MIC breakpoints for
FIG. 2.E. coliMIC distributions for cefotaxime (A), doxycycline (B), moxifloxacin (C), and tetracycline (D). Diagram bars show the percent E. coliisolates as given on the EUCAST website. The NRI-derived normal distributions of WT isolates are indicated by line graphs.
on May 16, 2020 by guest
http://jcm.asm.org/
groups of species or individual species and publishing them on the internet (http://www.eucast.org/clinical_breakpoints/). The concept of species-specific interpretive breakpoints was sug-gested as early as 1974 and later (4, 8, 10, 18). Also, the extensive work on inhibition zone diameter histogram analysis of O’Brien had this species-specific concept as a basis, although it was not expressed in words (15–17). This emphasis on the importance of species-specific interpretations will also influ-ence surveillance work, global or local. An automated, objec-tive method, such as NRI, could play an important role in
making antimicrobial susceptibility results comparable in such surveillance studies.
ACKNOWLEDGMENT
The EUCAST organization, chaired by Gunnar Kahlmeter, is ac-knowledged for making their vast source of antimicrobial susceptibility test results publicly available.
REFERENCES
[image:7.585.71.514.73.574.2]1.Brown, D., and G. Kahlmeter.2010. EUCAST in 2010, p. 44–45.InG. Cornaglia, P. Cologna, and D. White (ed.), ESCMID yearbook 2009/2010.
FIG. 2—Continued.
on May 16, 2020 by guest
http://jcm.asm.org/
European Society of Clinical Microbiology and Infectious Diseases, Basel, Switzerland.
2.Furtado, G. L., and A. A. Medeiros. 1980. Single-disk diffusion testing (Kirby-Bauer) of susceptibility of Proteus mirabilis to chloramphenicol: sig-nificance of the intermediate category. J. Clin. Microbiol.12:550–553. 3.Giske, C. G., C. Bore´n, B. Wretlind, and G. Kronvall.2005. Meropenem
susceptibility breakpoint forPseudomonas aeruginosastrains hyperproducing
mexBmRNA. Clin. Microbiol. Infect.11:662–669.
4.Joneberg, J., M. Rylander, M. F. Galas, C. Carlos, and G. Kronvall.2003. Analysis of parameters and validation of method for normalized interpreta-tion of antimicrobial resistance. Int. J. Antimicrob. Agents21:525–535. 5.Kahlmeter, G., and D. F. Brown.2002. Resistance surveillance studies:
comparability of results and quality assurance of methods. J. Antimicrob. Chemother.50:775–777.
6.Kahlmeter, G., D. F. Brown, F. W. Goldstein, A. P. MacGowan, J. W. Mouton, A. O¨ sterlund, A. Rodloff, M. Steinbakk, P. Urbaskova, and A. Vatopoulos.2003. European harmonization of MIC breakpoints for antimi-crobial susceptibility testing of bacteria. J. Antimicrob. Chemother.52:145– 148.
7.Kronvall, G.1982. Analysis of a single reference strain for determination of gentamicin regression line constants and inhibition zone diameter break-points in quality control of disk diffusion antibiotic susceptibility testing. J. Clin. Microbiol.16:784–793.
8.Kronvall, G.2003. Determination of the real standard distribution of sus-ceptible strains in zone histograms. Int. J. Antimicrob. Agents22:7–13. 9.Kronvall, G.2010. Antimicrobial resistance 1979–2009 at Karolinska
hospi-tal, Sweden: normalized resistance interpretation during a 30-year follow-up on Staphylococcus aureus and Escherichia coli resistance development. APMIS118:621–639.
10.Kronvall, G., G. Kahlmeter, E. Myhre, and M. F. Galas.2003. A new method for normalized interpretation of antimicrobial resistance from disk test re-sults for comparative purposes. Clin. Microbiol. Infect.9:120–132. 11.Kronvall, G., I. Karlsson, M. Walder, M. So¨rberg, and L. E. Nilsson.2006.
Epidemiological MIC cut-off values for tigecycline calculated from Etest MIC values using normalized resistance interpretation. J. Antimicrob. Che-mother.57:498–505.
12.Kronvall, G., S. Ringertz, I. Karlsson, E.Go¨ransson, and K. Dornbusch.
1988. Laboratory- and species-specific interpretive breakpoints for disk dif-fusion tests of chloramphenicol susceptibility of Haemophilus influenzae. Antimicrob. Agents Chemother.32:1484–1489.
13.Kronvall, G., S. Ringertz, S. Nystro¨m, M. Rylander, and E. Theodorsson.
1991. Comparison of 30g and 120g gentamicin disks for the prediction of gentamicin resistance inEnterococcus faecalis. APMIS99:887–892. 14.Matsen, J. M., M. E. Lund, and D. C. Brooker.1974. Comparison and
evaluation of carbenicillin disks in diffusion susceptibility testing. Antimi-crob. Agents Chemother.5:599–606.
15.O’Brien, T. F., J. F. Acar, A. A. Medeiros, R. A. Norton, F. Goldstein, and R. L. Kent.1978. International comparison of prevalence of resistance to antibiotics. JAMA239:1518–1523.
16.O’Brien, T. F., R. L. Kent, and A. A. Medeiros.1969. Computer-generated plots of results of antimicrobial-susceptibility tests. JAMA210:84–92. 17.O’Brien, T. F., R. A. Norton, R. L. Kent, and A. A. Medeiros.1977.
Inter-national surveillance of prevalence of antibiotic resistance. J. Antimicrob. Chemother.3:59–66.
18.Ringertz, S., B. Olsson-Liljequist, G. Kahlmeter, and G. Kronvall.1997. Antimicrobial susceptibility testing in Sweden. II. Species-related zone di-ameter breakpoints to avoid interpretive errors and guard against unrecog-nized evolution of resistance. Scand. J. Infect. Dis. Suppl.105:8–12. 19.Ruane, N. M., I. Douglas, M. Geary, C. Carroll, G. T. A. Fleming, and P.
Smith.2007. Application of normalized resistance interpretation to disc diffusion data on the susceptibility ofAeromonas salmonicidato three quin-olone agents. Aquaculture272:156–167.
20.Smith, P., and P. Christofilogiannis.2007. Application of normalized resis-tance interpretation to the detection of multiple low-level resisresis-tance in strains ofVibrio anguillarumobtained from Greek fish farms. Aquaculture
272:223–230.
21.Smith, P., I. Douglas, J. McMurray, and C. Carroll.2009. A rapid method of improving the criteria being used to interpret disc diffusion antimicrobial susceptibility test data for bacteria associated with fish diseases. Aquaculture
290:172–178.
22.Sundqvist, M., P. Geli, D. I. Andersson, M. Sjo¨lund-Karlsson, A. Runeha-gen, H. Cars, K. Abelson-Storby, O. Cars, and G. Kahlmeter.2010. Little evidence for reversibility of trimethoprim resistance after a drastic reduction in trimethoprim use. J. Antimicrob. Chemother.65:350–360.
23.Turnidge, J., G. Kahlmeter, and G. Kronvall.2006. Statistical characterisa-tion of bacterial wild-type distribucharacterisa-tions of MIC values and the determinacharacterisa-tion of epidemiological cut-off values. Clin. Microbiol. Infect.12:418–425. 24.Williams, J. D.1990. Prospects for standardisation of methods and
guide-lines for disc susceptibility testing. Eur. J. Clin. Microbiol. Infect. Dis.9:496– 501.