2019 International Conference on Applied Mathematics, Modeling, Simulation and Optimization (AMMSO 2019) ISBN: 978-1-60595-631-2
Research of Teacher’s Performance Evaluation Model
Based on AHP and Improved PSO-BP Neural Network
Jia XU
*and Lang PEI
College of Computer Science, Wuhan Qingchuan University, Wuhan *Corresponding author
Keywords: Analytic hierarchy process, BP neural network, PSO algorithms.
Abstract. The teacher’s performance evaluation is an important guarantee for the development of higher education. In view of the limitations of traditional analytic hierarchy process in the teachers' performance comprehensive evaluation and the shortcomings of BP neural network in the teachers' performance comprehensive evaluation, such as non-convergence and large prediction error, the paper proposed an evaluation index system based on analytic hierarchy process as input of BP neural network, and used dynamic inertial weight and multiple empirical particles to improve PSO algorithm and optimize the weights and thresholds of BP network, established teacher's performance evaluation model. The simulation results show that the model effectively reduces the number of network iterations, improves the prediction accuracy, and has a good application prospect in the teacher's performance evaluation.
Introduction
Comprehensive evaluation of teachers' performance is system engineering with heavy workload and cumbersome statistics. It is also an important guarantee for the development of higher education. Through scientific evaluation, schools can not only objectively judge the ability of teachers to teach and educate people, but also guide teachers to make continuous progress according to performance indicators. Teachers can also clearly understand their own shortcomings and improve them. At present, the researches of scholars mostly focus on building evaluation index system and calculating index weight, such as: literature [1] constructs comprehensive evaluation index system from four aspects of teaching, teachers' morality, scientific research and skills, calculates index weight with traditional analytic hierarchy process; literature [2] constructs comprehensive evaluation index system from four aspects of comprehensive quality, teaching work, social work and personnel training, and directly stipulate the proportion of the underlying index.
However, there are many factors involved in the comprehensive evaluation of teachers' performance, including qualitative index and quantitative index. These factors restrict and influence each other. No single evaluation method can guarantee the comprehensiveness and scientificity of evaluation [3]. Therefore, this paper combines Analytic Hierarchy Process (AHP) and Back Propagation Neural Network (BP Neural Network) to select performance evaluation index as input of the neural network from five aspects: comprehensive quality, daily teaching, teaching research, scientific research and serving the society; and uses improved PSO algorithm to optimize BP network, so as to effectively raise high accuracy of comprehensive evaluation of teachers' performance.
Comprehensive Evaluation Index System of Teacher Performance Based on AHP
AHP is a systematic analysis method combining qualitative and quantitative analysis proposed by American operations research institute Saaty [4-5] in the 1970s, which is relatively effective in the comprehensive evaluation of multi-factors, multi-criteria and multi-scheme [6]. In the paper, AHP is used to determine the index weight. The specific steps are as follows:
aspects: comprehensive quality B1, daily teaching B2, teaching research B3, scientific research B4 and
social service B5. Then, according to the first-level index, 16 second-level indexes are improved and a
hierarchical structure model is constructed.
Step 2: Determining the Weight of Indicators. The paper uses the 1-9 scale method [7] to construct the judgment matrix, calculates the index weight by the square root method, and test the consistency of the judgment matrix at last. The random consistency ratio CR is less than 0.1, the judgment matrix has satisfactory consistency, and otherwise the judgment matrix needs to be adjusted.
[image:2.595.171.433.209.308.2]Take the total target layer A as an example, the judgment matrix and weight is shown in Table 1.
Table 1. Judgment matrix A and index weight.
A B1 B2 B3 B4 B5 Weight
B1 1 1/5 1/3 1/3 1 0.074
B2 5 1 3 3 5 0.428
B3 3 1/3 1 1 3 0.212
B4 3 1/3 1 1 3 0.212
B5 1 1/5 1/3 1/3 1 0.074
In Table 1, the value of λmax is 5.074, CI is 0.019, and CR is 0.017. CR is less than 0.1, so the
judgment matrix A has satisfactory consistency.
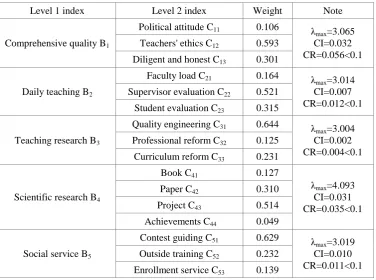
[image:2.595.111.488.386.666.2]According to the above calculation method, the paper constucts the comprehensive evaluation index system of University teachers'performance and shows in Table 2.
Table 2. Comprehensive evaluation index system of teachers' performance.
Level 1 index Level 2 index Weight Note
Comprehensive quality B1
Political attitude C11 0.106 λ
max=3.065
CI=0.032 CR=0.056<0.1 Teachers' ethics C12 0.593
Diligent and honest C13 0.301
Daily teaching B2
Faculty load C21 0.164 λ
max=3.014
CI=0.007 CR=0.012<0.1 Supervisor evaluation C22 0.521
Student evaluation C23 0.315
Teaching research B3
Quality engineering C31 0.644 λ
max=3.004
CI=0.002 CR=0.004<0.1 Professional reform C32 0.125
Curriculum reform C33 0.231
Scientific research B4
Book C41 0.127
λmax=4.093
CI=0.031 CR=0.035<0.1
Paper C42 0.310
Project C43 0.514
Achievements C44 0.049
Social service B5
Contest guiding C51 0.629 λ
max=3.019
CI=0.010 CR=0.011<0.1 Outside training C52 0.232
Enrollment service C53 0.139
In Table 2, the values of CR in judgment matrix B1-B5 are all less than 0.1, so they all have
satisfactory consistency.
BP Neural Network Based on Improved PSO
PSO algorithm optimization strategy. Inertial weight is a very important parameter in standard PSO algorithm [8]. The larger the inertia weight is, the stronger the exploration ability is; the smaller the inertia weight is, the stronger development ability is [9]. The paper adopts the method of dynamic adjusting inertia weight [10], and makes inertia weight satisfy the equations (1):
1 5 0 25 1 1 5 0 0 25 0 1 MaxNum t MaxNum t MaxNum t MaxNum t k w . . . . (1)where t is the current iteration number, MaxMum is the maximum iteration number, and the inertia weight value increases linearly from 0.25 to 0.75, then decreases linearly to 0.25.
The paper observes the flight behavior of particles, summarizes the flight path of particles, and adjust the weakening selection behavior by introducing empirical particles, so as to optimize the individual extreme value Pbi and the group extreme value Pgb, thus improves the convergence speed
and accuracy of PSO algorithm.
The updated Formula of Individual Extreme (2) is defined as
2 2 3 21 Pb t r Pb t r Pb t i r i t Pb t Pb n m i i i
' (2)
where Pbi’ is the updated individual extreme value. Pbi is the current individual extreme value. Pbm
and Pbn are the experienced individual extreme values; they are randomly selected from previous ones
in the same generation. r1, r2 and r3 are random values between -0.5 and 1.5, and their sum is 1.
The updated Formula of global Extreme (3) is defined as
t r Pb
t r Pb
t r Pb
tPgb' 1 1 2 2 3 3 (3) where Pgb’ is the updated global extreme value. Pb1, Pb2 and Pb3 are three best individual extremes
from the same generation. r1, r2 and r3 are random values between -0.5 and 1.5, and their sum is 1.
BP and PSO Algorithms Fusion. Firstly, establish the relationship between PSO solution space and BP network structure. The solution space dimension of PSO is the dimension of particle position vector and velocity vector, which can be expressed by the combination of node numbers in each layer of BP network. Its value is the sum of the number of weights and thresholds in BP neural network. Secondly, establish the relationship between PSO fitness and the total error of BP network. The total error formula of BP is the fitness function of particles, and the fitness value of particles is the total error, which is accumulated by all training data during the forward propagation. Finally, establish the relation between PSO evolution formula and BP network weight and threshold. After each iteration, use the updated particle swarm optimal position to assign values for weights and thresholds of BP, to make the network has better convergence speed and prediction accuracy.
Simulation Experiment and Analysis
The paper pre-processes the sample data at first, then makes simulation experiment between the standard BP algorithm, linear PSO-BP algorithm and improved PSO-BP algorithm, and finally compares and analyzes results from four aspects: convergence speed, prediction accuracy, relative error and mean square error.
Table 3. Sample data.
No C11 C12 C13 C21 C22 C23 C31 C32 C33 C41 C42 C43 C44 C51 C52 C53 Result 1 10 10 10 7 8 9 5 5 4 10 10 10 5 10 5 8 8.080 2 10 10 10 8 8 9 5 5 2 5 10 10 5 3 5 8 7.564 3 10 10 10 9 8 9 10 5 2 5 10 5 5 10 5 8 8.035 4 10 10 10 8 8 9 5 5 4 5 10 10 5 5 5 8 7.721 5 10 10 10 8 8 9 5 5 4 10 10 5 5 10 5 8 7.533 6 10 10 10 8 8 9 5 5 8 5 10 5 5 2 5 8 7.205 7 10 10 10 9 9 10 5 5 2 5 10 10 5 10 10 4 8.085
8 10 10 9 7 8 9 5 5 10 5 5 5 5 3 5 8 6.868
9 10 10 10 8 7 9 5 5 4 5 10 5 5 2 5 10 6.784 10 10 10 10 8 8 9 5 5 2 5 5 5 5 2 10 8 6.715 11 10 10 10 7 8 9 5 5 2 5 5 5 5 10 10 10 6.954 12 10 10 10 10 8 9 5 10 10 10 10 5 5 10 10 9 8.151 13 10 10 9 8 9 10 10 5 2 5 10 10 5 8 10 8 8.700 14 10 10 10 8 8 9 10 5 2 10 5 5 5 2 5 8 7.475 15 9 10 10 7 8 9 5 5 2 5 10 5 5 5 10 10 7.071
In Table 3, the first 13 sets of data are training samples, and the last two sets are test samples. The paper uses normalization processing method with linear function Conversion, and makes each sample data can participate in network training in the same important position. Through experimental comparison, the network structure of improved PSO-BP model is 16-10-1; the particle swarm size of the prediction model is 20; the particle dimension is 181. The initial position component is a random number between -1 and 1. The current velocity component is a random number between -0.5 and 0.5. The maximum iterations number is 2000 of the algorithm and the minimum error is 0.001.
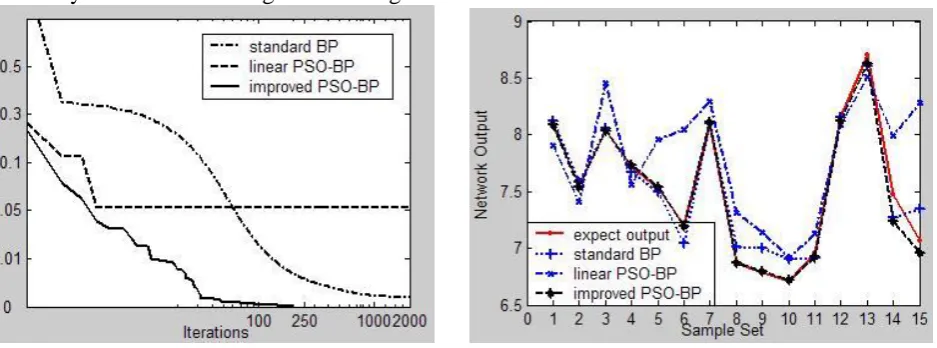
Experimental results and analysis. The algorithm convergence analysis and the network output curve analysis are shown as Figure 1 and Figure 2.
[image:4.595.71.540.474.648.2]
Figure 1. Convergence properties picture. Figure 2. Output picture.
In Figure 1, the convergence speed of standard BP is slow and it is still not convergent at the maximum iterations; linear PSO-BP algorithm has fell into local fitness value of 0.207 at the early stage and it still could not jumped out at the maximum iterations; the fitness value of improved PSO-BP algorithm keeps a good decreasing trend, and the algorithm can achieve the minimum error at 203 iterations.
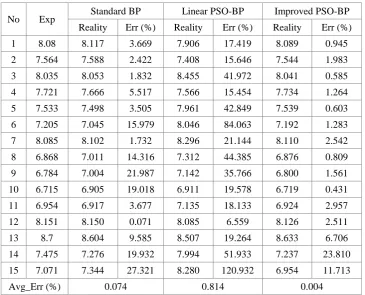
Table 4. Relative error value comparison of three algorithms.
No Exp Standard BP Linear PSO-BP Improved PSO-BP Reality Err (%) Reality Err (%) Reality Err (%)
1 8.08 8.117 3.669 7.906 17.419 8.089 0.945
2 7.564 7.588 2.422 7.408 15.646 7.544 1.983
3 8.035 8.053 1.832 8.455 41.972 8.041 0.585
4 7.721 7.666 5.517 7.566 15.454 7.734 1.264
5 7.533 7.498 3.505 7.961 42.849 7.539 0.603
6 7.205 7.045 15.979 8.046 84.063 7.192 1.283
7 8.085 8.102 1.732 8.296 21.144 8.110 2.542
8 6.868 7.011 14.316 7.312 44.385 6.876 0.809 9 6.784 7.004 21.987 7.142 35.766 6.800 1.561 10 6.715 6.905 19.018 6.911 19.578 6.719 0.431 11 6.954 6.917 3.677 7.135 18.133 6.924 2.957
12 8.151 8.150 0.071 8.085 6.559 8.126 2.511
13 8.7 8.604 9.585 8.507 19.264 8.633 6.706
14 7.475 7.276 19.932 7.994 51.933 7.237 23.810 15 7.071 7.344 27.321 8.280 120.932 6.954 11.713
Avg_Err (%) 0.074 0.814 0.004
In Table 4, Exp expresses the expected output. Reality shows the real output. Err denotes the relative error and adopts the percentage mode. Avg_Err denotes the average relative error. Compared with other algorithms, the Average Error value of the improved PSO-BP algorithm is only 0.004%, and it is obviously better than others.
The MSE is an important index of the BP network mode [11].The MSE of three algorithms is shown in Table 5:
Table 5. MSE comparison of three algorithms.
Standard BP Linear PSO-BP Improved PSO-BP
MSE 0.0051 0.0387 0.0003
In Table 5, the MSE of the improved PSO-BP algorithm is only 0.0003 and it is obviously better than others.
Summary
BP neural network is suitable for the comprehensive evaluation and modeling of University teachers' performance with non-linear characteristics, but it has some problems. This paper uses the dynamic inertia weight which increases at first and then decreases, and combines the PSO algorithm of multi-empirical particles to optimize the weights and thresholds of BP network. The improved model can quickly give evaluation results and ensure strong fault-tolerant ability. However, the learning samples of the model depend on the evaluation results of AHP, so the evaluation method proposed in this paper cannot completely replace the traditional AHP, but provides a more accurate and efficient new way of thinking for the comprehensive evaluation of University teachers' performance.
Acknowledgement
References
[1] Zhong Lin. Design and implementation of the high vocational colleges performance appraisal system. University of Electronic Science and Technology of China, 2012.
[2] Huang Liqiong. HY vocational technology college teachers’ performance appraisal system research. Guangdong University of Technology, 2013.
[3] Xu Huiyuan. Research on Comprehensive Quality Evaluation of College Students Based on AHP and BP Neural Network Theory. Studies in Ideological Education, Supplement I (169): 200-204, 2009.
[4] Satty T L. A scaling method for priorities in hierarchical structures. Journal of Mathematical Psychology, 1978, 1(1): 57-68.
[5] Satty T L. Axiomatic foundation of the analytic hierarchy process. Management Science, 1986, 23(7): 851-855.
[6] Zhang Yi, Wang Xianjia. Contractor selection model for engineering projects based on AHP and momentum BP neural network. Mathematics in Practice and Theory, 44(21): 52-57, 2014.
[7] Xu Gongping, Wu Kui. Theory and Method of Multiple Attribute Decision Making. Tsinghua University Press, Beijing, (2006): 124-125.
[8] Shi Y, Eberhart R C. A modified particle swarm optimizer. Proceedings of the IEEE Conference on Evolutionary Computation. Piscataway, NJ. 1998: 69-73.
[9] Tian Yu bo, Zhu Ren jie, Xue Quan Xiang. Research advances on inertia weight in particle swam optimization. Computer Engineering and Applications, 44(23): 39-41, 2008.
[10] Jia Xu, Lang Pei. Air Quality Index Prediction Using Error Back Propagation Algorithm and Improved Particle Swarm Optimization. Proceedings of the International Conference on Mechatronics and Intelligent Robotics, 2017.