Open Access
Research article
Does parallel item content on WOMAC's Pain and Function
Subscales limit its ability to detect change in functional status?
Paul W Stratford*
1and Deborah M Kennedy
1,2Address: 1School of Rehabilitation Science and Associate Member Department of Clinical Epidemiology and Biostatistics, McMaster University,
1400 Main Street West (4th Floor), Hamilton, ON, Canada, L8S 1C7 and 2Centre for Studies of Physical Function, Orthopaedic and Arthritic
Institute of Sunnybrook and Women's College Health Sciences Centre; 43 Wellesley Street East, Toronto, ON, Canada, M4Y 1H1
Email: Paul W Stratford* - [email protected]; Deborah M Kennedy - [email protected] * Corresponding author
Abstract
Background: Although the Western Ontario and McMaster University Osteoarthritis Index
(WOMAC) is considered the leading outcome measure for patients with osteoarthritis of the lower extremity, recent work has challenged its factorial validity and the physical function subscale's ability to detect valid change when pain and function display different profiles of change. This study examined the etiology of the WOMAC's physical function subscale's limited ability to detect change in the presence of discordant changes for pain and function. We hypothesized that the duplication of some items on the WOMAC's pain and function subscales contributed to this shortcoming.
Methods: Two eight-item physical function scales were abstracted from the WOMAC's 17-item
physical function subscale: one contained activities and themes that were duplicated on the pain subscale (SIMILAR-8); the other version avoided overlapping activities (DISSIMILAR-8). Factorial validity of the shortened measures was assessed on 310 patients awaiting hip or knee arthroplasty. The shortened measures' abilities to detect change were examined on a sample of 104 patients following primary hip or knee arthroplasty. The WOMAC and three performance measures that included activity specific pain assessments – 40 m walk test, stair test, and timed-up-and-go test – were administered preoperatively, within 16 days of hip or knee arthroplasty, and at an interval of greater than 20 days following the first post-surgical assessment. Standardized response means were used to quantify change.
Results: The SIMILAR-8 did not demonstrate factorial validity; however, the factorial structure of
the DISSIMILAR-8 was supported. The time to complete the performance measures more than doubled between the preoperative and first postoperative assessments supporting the theory that lower extremity functional status diminished over this interval. The DISSIMILAR-8 detected this deterioration in functional status; however, no significant change was noted for the SIMILAR-8. The WOMAC pain scale demonstrated a slight reduction in pain and the performance specific pain measures did not reflect a change in pain. All measures showed substantial improvement over the second assessment interval.
Conclusions: These findings support the hypothesis that activity overlap on the pain and function
subscales plays a causal role in limiting the WOMAC physical function subscale's ability to detect change.
Published: 09 June 2004
BMC Musculoskeletal Disorders 2004, 5:17
Received: 30 December 2003 Accepted: 09 June 2004
This article is available from: http://www.biomedcentral.com/1471-2474/5/17
Background
At the Outcome Measures in Arthritis Clinical Trials (OMERACT III) conference, pain and physical function were identified as the top two core outcomes for patients with osteoarthritis (OA) of the hip or knee [1]. The WOMAC pain and physical function subscales have been recommended as the leading self-report measures to assess these attributes [2,3]. Conceived for patients with osteoarthritis of the hip or knee, the WOMAC is a self-report disease specific measure developed by Bellamy using a clinimetric approach [4]. Specifically, WOMAC items were generated using a structured interview that included open- and closed-ended questions applied to 100 patients with primary osteoarthritis of the hip or knee. Patients were asked to rate the importance of items generated from the open- and closed-ended questions and the final WOMAC items were those with the highest fre-quency and importance produce ratings [5]. Although the first version of the WOMAC had five dimensions [5], the social and emotional subscales were subsequently deleted yielding the current measure with three subscales: pain (5 items), stiffness (2 items), and physical function (17 items) [4]. There are two administration formats for WOMAC items: one applies a 5-point Likert approach and the other uses a 100 mm visual analogue scale [6]. Scores can be interpreted for each subscale or the total score. The WOMAC has been used extensively in clinical interven-tion studies including drug trials [7,8], exercise [9-11] and modality studies [12,13], and joint replacement surgery investigations [14-17].
The measurement properties of the WOMAC have been investigated in many studies and McConnell et al have provided an excellent review article [6]. This summary indicates that the WOMAC pain and physical function subscales have levels of internal consistency and test-retest reliability consistent with clinical practice and research applications. Moreover, McConnell et al reported many studies supporting the WOMAC's construct validity and sensitivity to change [6]. Information concerning the WOMAC's factorial validity does not appear in the review because no citations existed prior to their article. Factorial or structural validity examines the extent to which domains hypothesized to make up a measure – pain, stiff-ness, and physical function in the case of the WOMAC – actually underlie patients' responses. Subsequent to McConnell et al's review article, consistent evidence refut-ing the factorial validity of the WOMAC's pain and physi-cal function subsphysi-cales has appeared [18-20]. These investigations suggest that WOMAC items do not group by pain and function as originally conceived, but rather by activities with overlap of the pain and function items [20].
An important consequence of the poor factorial validity is that the WOMAC may not be capable of distinguishing
between changes in pain and functional status when these attributes have discordant changes. A previous study dem-onstrated that the WOMAC's physical function subscale was unable to detect deterioration in patients' functional status levels when assessed within 16 days of hip or knee arthroplasty [20]. Of particular interest was the finding that the time components for two performance measures – a 40 m walk test and timed-up-and-go test – more than doubled, while the WOMAC pain subscale score and numeric pain rating scores specific to the performance measures remained the same or decreased slightly. Based on these findings it was hypothesized that the WOMAC's physical function score may be spuriously influenced by responses to the WOMAC's pain questions [20].
The purpose of this study was to investigate the causal mechanism of the WOMAC's physical function subscale's (WOMAC PF) poor ability to detect change in the pres-ence of discordant changes in pain and function. Our hypothesis was that the duplication of some items on the WOMAC's pain and function subscales contributes to this shortcoming.
Methods
We used the LK3.1 version of the WOMAC. For this ver-sion of the WOMAC, items are scored on a 5-point scale (0 to 4) with higher scores representing greater levels of pain, stiffness, and difficulty with physical function. Pain subscale scores can vary from 0 to 20; stiffness subscale scores can vary from 0 to 8; and physical function subscale scores can vary from 0 to 68.
(7) performing heavy domestic duties; and (8) perform-ing light domestic duties. Throughout the remainder of this paper we refer to the version with items similar to the pain scale as SIMILAR-8 and the version with dissimilar items as DISSIMILAR-8.
Two patient samples in which data on the WOMAC were collected in its original format contributed to this work. The first sample of 310 patients awaiting hip or knee arthroplasty was used to examine the factorial structure of the shortened measures; the second sample of 104 patients receiving hip or knee arthroplasty was applied to test the hypothesis that overlapping pain and function activities account for the poor ability of the WOMAC-PF to detect change in the presence of discordant changes in pain and function. Both samples consisted of patients diagnosed as having osteoarthritis (OA) of the hip or knee. The participants were individuals who had end-stage osteoarthritis determined by their surgeon according to patient symptoms, clinical findings and radiographs [21,22]. Patients in the change sample underwent primary total hip (THA) or total knee (TKA) arthroplasty. Exclu-sion criteria included bilateral or reviExclu-sion arthroplasty sur-gery, additional operative procedures, and comorbidities associated with cognitive impairment. The assessments and surgeries took place at a tertiary care hospital in Toronto Canada. Ethics approval was obtained from the institution's review board and all patients taking part in this investigation provided written informed consent.
In the change cohort, in addition to the WOMAC data, three performance tests – a self-paced walk (SPWT) [23], a stair test (ST), and the timed-up-and-go (TUG) [24] – were also administered. Each performance measure included time and pain components. Time was assessed to the nearest 1/100 of a second using a stopwatch. Patients recorded their pain immediately following each activity on an 11-point numeric pain rating scale (0 = no pain to 10 = pain as bad as it can be). For the SPWT, patients walked two lengths of a 20 m corridor in response to the instruction "Walk as quickly as you can without over exerting yourself." For the stair test, patients ascended and descended 9-stairs (step height 20 cm) in their usual manner, at a safe and comfortable pace. The TUG test commenced with patients sitting in a standard arm-chair, standing, walking to a tape 3 m in front of the chair, and returning to a seated position in the chair.
No gold standard exists for functional status. Accordingly, a construct validation process plays an important role when examining the extent to which a measure is valid. Construct validation involves forming theories about the attribute of interest – in this study lower extremity func-tional status – and testing the extent to which the measure of interest provides results consistent with the theories
[25]. To assess the measures' abilities to detect change we used data from two time intervals: the first where pain and physical function change differently, and the second where pain and physical function display a similar change. Previous work has shown that pain does not change appreciably when assessed within 16 days of hip or knee arthroplasty; however, there is a marked deterio-ration in physical function over this interval [20,23]. Moreover, a substantial reduction in pain and improve-ment in functional status has been noted when the inter-val between a postoperative assessment within 16 days of surgery and a second postoperative assessment exceeds 20 days [20]. Accordingly, we used data from patients assessed preoperatively, within 16 days of surgery (first postoperative assessment), and at a minimum of 20 days following the first postoperative assessment (second post-operative assessment).
There were three aspects to the analyses: (1) assessment of the factorial validity of the pain and physical function subscales (patients awaiting surgery, n = 310); (2) exami-nation of the shortened measures' abilities to detect change (patients receiving total joint arthroplasty, n = 104); and (3) determination of the correlation between the WOMAC pain and function scores and the shortened measures' scores (n = 104). Exploratory factorial analysis of the pain and physical function subscales with oblique rotation was applied to examine the factorial validity of the shortened measures. The application of oblique rota-tion acknowledges a correlarota-tion between pain and func-tion. Factors were identified for eigenvalues greater than one.
We applied the standardized response mean (SRM) to quantify change [26]. The SRM is calculated as the average change divided by the standard deviation of the change scores. In this study a negative SRM indicated deteriora-tion (e.g., increases in pain scores, WOMAC physical func-tion scores, and time to complete performance tests) and positive SRM represented improvement. We used a boot-strap procedure to obtain 95% confidence intervals for the SRMs and to test for differences between SRMs for the shortened versions of the WOMAC physical function sub-scale [27]. The bootstrap procedure consisted of sampling with replacement 1000 samples each of 104 observations. The 1000 bootstrap samples were sorted and the 95% confidence intervals were obtained by reading the 25th
and 975th observations. The between measure
Correlation analysis was used to describe the relationship between the WOMAC pain and function subscales, and the two shortened WOMAC-PF versions. Meng's test for dependent correlation coefficients was applied to test for differences in correlations between the shortened meas-ures [28].
Results
One hundred sixty-one (52%) of the 310 patient sample were females. One hundred thirty-seven patients (44%) were awaiting THA of which 62 were female. The mean age and body mass index for the 310 patients were 64.5 years (sd 10.9) and 31.0 kg/m2 (sd 5.9) respectively. Of
the 104 patients taking part in the change investigation, 48 (46%) were females. Fifty patients (48%) had THA, 22 of which were females. The sample's mean age and body mass index were 62.4 years (sd 10.2) and 29.9 kg/m2 (sd
4.9) respectively. The median interval between surgery and the first postoperative assessment was 8 days (1st, 3rd
quartiles: 7, 10), and 38 days (1st and 3rd quartiles: 32, 47)
between the first and second postoperative assessments.
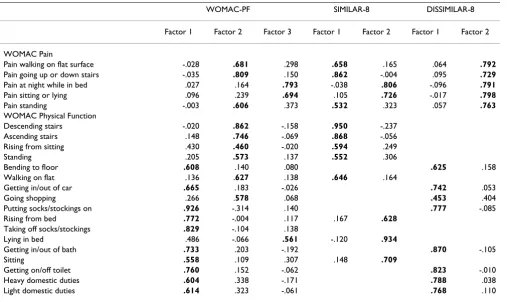
Table 1 displays the pattern loadings for the factor analy-ses. Three factors accounting for 65% of the variance were identified for the pain and original physical function
sub-scales of the WOMAC; however, the items did not group by the hypothesized domains of pain and physical func-tion. Two factors accounting for 63% of the variance were identified for the pain and SIMILAR-8 items. Once again there was not a clear distinction between pain and physi-cal function items. Two factors consistent with the WOMAC's hypothesized pain and physical function domains, and accounting for 62% of the variance were identified for DISSIMILAR-8 items.
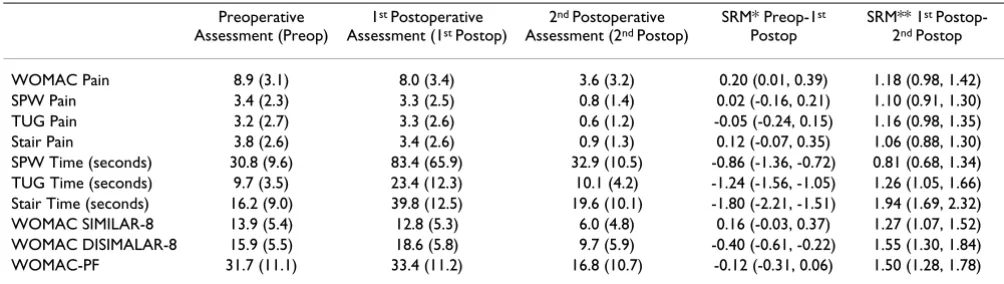
Table 2 provides descriptive statistics and SRMs for the self-report and performance tests. The results provided in this table convey the following information about the interval between the preoperative and first postoperative assessments: (1) the WOMAC pain scale displayed a decrease in reported pain; (2) no appreciable change took place in the performance pain measures; (3) there was a substantial increase in the time to complete the perform-ance tests; (4) the DISSIMILAR-8 showed a significant deterioration in physical function; and (5) neither the WOMAC-PF nor SIMILAR-8 demonstrated change. The DISSIMILAR-8 was statistically superior at detecting dete-rioration compared to the SIMILAR-8 (difference in SRM = 0.56, 95% CI: 0.44 to 0.70) and the WOMAC-PF (differ-ence in SRM = 0.28, 95% CI: 0.20 to 0.34). Over the sec-Table 1: Pattern Loading Coefficients from Factor Analyses with Oblique Rotation (n = 310)
WOMAC-PF SIMILAR-8 DISSIMILAR-8
Factor 1 Factor 2 Factor 3 Factor 1 Factor 2 Factor 1 Factor 2
WOMAC Pain
Pain walking on flat surface -.028 .681 .298 .658 .165 .064 .792
Pain going up or down stairs -.035 .809 .150 .862 -.004 .095 .729
Pain at night while in bed .027 .164 .793 -.038 .806 -.096 .791
Pain sitting or lying .096 .239 .694 .105 .726 -.017 .798
Pain standing -.003 .606 .373 .532 .323 .057 .763
WOMAC Physical Function
Descending stairs -.020 .862 -.158 .950 -.237
Ascending stairs .148 .746 -.069 .868 -.056
Rising from sitting .430 .460 -.020 .594 .249
Standing .205 .573 .137 .552 .306
Bending to floor .608 .140 .080 .625 .158
Walking on flat .136 .627 .138 .646 .164
Getting in/out of car .665 .183 -.026 .742 .053
Going shopping .266 .578 .068 .453 .404
Putting socks/stockings on .926 -.314 .140 .777 -.085
Rising from bed .772 -.004 .117 .167 .628
Taking off socks/stockings .829 -.104 .138
Lying in bed .486 -.066 .561 -.120 .934
Getting in/out of bath .733 .203 -.192 .870 -.105
Sitting .558 .109 .307 .148 .709
Getting on/off toilet .760 .152 -.062 .823 -.010
Heavy domestic duties .604 .338 -.171 .788 .038
[image:4.612.55.562.99.401.2]ond assessment interval there was no appreciable difference in the abilities of the DISSIMILAR-8 and WOMAC-PF to detect change (difference in SRM = 0.05, 95% CI: -0.04 to 0.07); however the DISSIMILAR-8 was significantly superior to SIMILAR-8 at detecting improve-ment (difference in SRM = 0.28, 95% CI: 0.03 to 0.52).
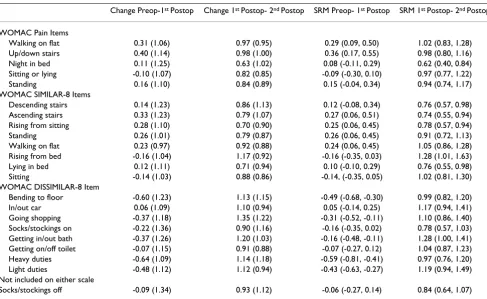
Table 3 displays the mean change scores and SRMs by WOMAC item. Positive SRMs represent a reduction in pain or an improvement in physical function. Based on the confidence intervals, there was a reduction in pain for the walking and stairs items between the preoperative and first postoperative assessments. The remaining three pain items did not demonstrate a change (i.e., 95% CI included zero). Also for this assessment interval, there is an appar-ent improvemappar-ent in the following physical function scores on the SIMILAR-8: (1) ascending stairs; (2) rising from sitting; (3) standing; and (4) walking on flat. The remaining SIMILAR-8 items did not detect a change over this interval (i.e., the 95% CI included zero). In contrast, five of the eight DISSIMILAR-8 items demonstrated dete-rioration in physical function: (1) bending to floor; (2) going shopping; (3) getting in/out of bath; (4) heavy domestic duties; and (5) light domestic duties. The remaining three items on the DISSIMILAR-8 showed no change.
Table 4 reports the correlation coefficients between the shortened physical function measures and the WOMAC pain and function subscales scores at each of the three assessment points. There were substantially higher corre-lations that were statistically significant at all points in time between the WOMAC pain subscale and the SIMI-LAR-8 compared to the DISSIM8. The correlations between the WOMAC-PF and the DISSIMILAR-8 are mar-ginally higher than with the SIMILAR-8. Statistical signifi-cance is demonstrated preoperatively and at the second
postoperative assessments. The correlations between the WOMAC pain and physical function scales for the preop-erative, first postoppreop-erative, and second postoperative assessments were 0.79 (95% CI: 0.70, 0.85), 0.76 (95% CI: 0.66, 0.83), and 0.81 (95% CI: 0.73, 0.87), respectively.
Discussion
The purported principal themes of the WOMAC are pain, stiffness, and physical function. However, previous stud-ies have shown that WOMAC items do not group according to these subscale headings [18,19]: the items group by activity [20]. A consequence is that a subscale's score may not provide an accurate representation of the attribute specified by the subscale's trait label. We hypoth-esized that the duplication of activities on the pain and physical function subscales contributes to the WOMAC's compromised factorial validity. Accordingly, the purpose of this study was to examine the viability of parallel activ-ity content on the pain and physical function subscales as an explanation for the physical function subscale's poor ability to accurately detect change in the presence of dis-cordant changes for pain and function. Our results indi-cate the following: (1) factorial validity exists for the DISSIMILAR-8, but not for the SIMILAR-8 or WOMAC PF; (2) the DISSIMILAR-8 detected deterioration in functional status over the first assessment interval better than the SIMILAR-8 and WOMAC-PF; (3) all measures detected improvement over the second assessment inter-val; and (4) WOMAC pain subscale scores demonstrated substantially higher correlations with the SIMILAR-8 com-pared to the DISSIMILAR-8.
[image:5.612.53.555.100.242.2]Although one would expect pain and physical function to be related, expert groups have considered these attributes to be different enough as to warrant independent assess-ment [1-3]. The WOMAC makes this distinction in that its Table 2: Descriptive Statistics (sd) and Standardized Response Means (SRM, 95% CI) for Self-report and Performance Measures
Preoperative Assessment (Preop)
1st Postoperative
Assessment (1st Postop)
2nd Postoperative
Assessment (2nd Postop)
SRM* Preop-1st
Postop
SRM** 1st
Postop-2nd Postop
WOMAC Pain 8.9 (3.1) 8.0 (3.4) 3.6 (3.2) 0.20 (0.01, 0.39) 1.18 (0.98, 1.42)
SPW Pain 3.4 (2.3) 3.3 (2.5) 0.8 (1.4) 0.02 (-0.16, 0.21) 1.10 (0.91, 1.30)
TUG Pain 3.2 (2.7) 3.3 (2.6) 0.6 (1.2) -0.05 (-0.24, 0.15) 1.16 (0.98, 1.35)
Stair Pain 3.8 (2.6) 3.4 (2.6) 0.9 (1.3) 0.12 (-0.07, 0.35) 1.06 (0.88, 1.30)
SPW Time (seconds) 30.8 (9.6) 83.4 (65.9) 32.9 (10.5) -0.86 (-1.36, -0.72) 0.81 (0.68, 1.34)
TUG Time (seconds) 9.7 (3.5) 23.4 (12.3) 10.1 (4.2) -1.24 (-1.56, -1.05) 1.26 (1.05, 1.66)
Stair Time (seconds) 16.2 (9.0) 39.8 (12.5) 19.6 (10.1) -1.80 (-2.21, -1.51) 1.94 (1.69, 2.32)
WOMAC SIMILAR-8 13.9 (5.4) 12.8 (5.3) 6.0 (4.8) 0.16 (-0.03, 0.37) 1.27 (1.07, 1.52)
WOMAC DISIMALAR-8 15.9 (5.5) 18.6 (5.8) 9.7 (5.9) -0.40 (-0.61, -0.22) 1.55 (1.30, 1.84)
WOMAC-PF 31.7 (11.1) 33.4 (11.2) 16.8 (10.7) -0.12 (-0.31, 0.06) 1.50 (1.28, 1.78)
*Median interval between assessments was 8 days (1st, 3rd quartiles: 7, 10 days) **Median interval between assessments was 38 days (1st, 3rd
subscales include pain and function. Moreover, and unlike many other self-report measures that inquire about difficulty, the WOMAC offers the following statement to direct patients in their responses: "By this [difficulty with physical function] we mean your ability to move around and to look after yourself." To the extent that the time to "move around" as assessed by the performance tasks pro-vided a representation of a patient's physical function, sig-nificant deterioration occurred over the first assessment interval: the time for all performance tasks more than doubled. In contrast, the pain associated with the
[image:6.612.60.547.98.397.2]per-formance tasks did not change significantly over the first assessment interval. Coupled with the results from the WOMAC pain responses, these findings suggest that pain does not get worse over the first assessment interval. The SIMILAR-8 responses for ascending stairs, walking, rising from sitting, and standing, showed significant improve-ments over the first assessment interval. These self-report activities on the WOMAC are directly comparable to the performance activities of walking, stairs, and TUG. Three items on the DISSIMILAR-8 did not detect deterioration over the first assessment interval.
Table 3: Mean Item Changes (sd) and Standardized Response Means (SRM, 95% CI)
Change Preop-1st Postop Change 1st Postop- 2nd Postop SRM Preop- 1st Postop SRM 1st Postop- 2nd Postop
WOMAC Pain Items
Walking on flat 0.31 (1.06) 0.97 (0.95) 0.29 (0.09, 0.50) 1.02 (0.83, 1.28)
Up/down stairs 0.40 (1.14) 0.98 (1.00) 0.36 (0.17, 0.55) 0.98 (0.80, 1.16)
Night in bed 0.11 (1.25) 0.63 (1.02) 0.08 (-0.11, 0.29) 0.62 (0.40, 0.84)
Sitting or lying -0.10 (1.07) 0.82 (0.85) -0.09 (-0.30, 0.10) 0.97 (0.77, 1.22)
Standing 0.16 (1.10) 0.84 (0.89) 0.15 (-0.04, 0.34) 0.94 (0.74, 1.17)
WOMAC SIMILAR-8 Items
Descending stairs 0.14 (1.23) 0.86 (1.13) 0.12 (-0.08, 0.34) 0.76 (0.57, 0.98)
Ascending stairs 0.33 (1.23) 0.79 (1.07) 0.27 (0.06, 0.51) 0.74 (0.55, 0.94)
Rising from sitting 0.28 (1.10) 0.70 (0.90) 0.25 (0.06, 0.45) 0.78 (0.57, 0.94)
Standing 0.26 (1.01) 0.79 (0.87) 0.26 (0.06, 0.45) 0.91 (0.72, 1.13)
Walking on flat 0.23 (0.97) 0.92 (0.88) 0.24 (0.06, 0.45) 1.05 (0.86, 1.28)
Rising from bed -0.16 (1.04) 1.17 (0.92) -0.16 (-0.35, 0.03) 1.28 (1.01, 1.63)
Lying in bed 0.12 (1.11) 0.71 (0.94) 0.10 (-0.10, 0.29) 0.76 (0.55, 0.98)
Sitting -0.14 (1.03) 0.88 (0.86) -0.14, (-0.35, 0.05) 1.02 (0.81, 1.30)
WOMAC DISSIMILAR-8 Item
Bending to floor -0.60 (1.23) 1.13 (1.15) -0.49 (-0.68, -0.30) 0.99 (0.82, 1.20)
In/out car 0.06 (1.09) 1.10 (0.94) 0.05 (-0.14, 0.25) 1.17 (0.94, 1.41)
Going shopping -0.37 (1.18) 1.35 (1.22) -0.31 (-0.52, -0.11) 1.10 (0.86, 1.40)
Socks/stockings on -0.22 (1.36) 0.90 (1.16) -0.16 (-0.35, 0.02) 0.78 (0.57, 1.03)
Getting in/out bath -0.37 (1.26) 1.20 (1.03) -0.16 (-0.48, -0.11) 1.28 (1.00, 1.41)
Getting on/off toilet -0.07 (1.15) 0.91 (0.88) -0.07 (-0.27, 0.12) 1.04 (0.87, 1.23)
Heavy duties -0.64 (1.09) 1.14 (1.18) -0.59 (-0.81, -0.41) 0.97 (0.76, 1.20)
Light duties -0.48 (1.12) 1.12 (0.94) -0.43 (-0.63, -0.27) 1.19 (0.94, 1.49)
Not included on either scale
Socks/stockings off -0.09 (1.34) 0.93 (1.12) -0.06 (-0.27, 0.14) 0.84 (0.64, 1.07)
Table 4: Correlation Coefficients (95% CI) Between Shortened Measures and WOMAC Pain and Physical Function Scores
Assessment SIMILAR-8 DISSIMILAR-8 Difference Comparison (Z, p-value)
WOMAC Pain
Preoperative 0.83 (0.76, 0.88) 0.69 (0.57, 0.78) 4.04, p2 < 0.001
1st Postoperative 0.78 (0.69, 0.85) 0.66 (0.54, 0.76) 2.82, p
2 = 0.005
2nd Postoperative 0.89 (0.84, 0.92) 0.66 (0.54, 0.75) 6.21, p
2 < 0.001
WOMAC Physical Function
Preoperative 0.94 (0.91, 0.96) 0.97 (0.95, 0.98) 2.43, p2 = 0.015
1st Postoperative 0.94 (0.91, 0.96) 0.95 (0.93, 0.97) 1.63, p
2 = 0.104
2nd Postoperative 0.91 (0.87, 0.94) 0.95 (0.93, 0.97) 3.58, p
[image:6.612.53.553.448.562.2]These items involved sitting (socks on/off) or rising from sitting (on/off toilet). In retrospect, one could argue that these items parallel the sitting item on the WOMAC pain scale and perhaps one should not be surprised at the results.
Our findings support the hypothesis that duplicating activities on the pain and physical function subscales plays an etiologic role in compromising the WOMAC-PF subscale's ability to detect valid change in the presence of discordant change in pain and function. First, the DISSIM-ILAR-8 displayed factorial validity, whereas, the SIMILAR-8 lacked factorial validity. Second, the DISSIMILAR-SIMILAR-8 detected deterioration in physical function over the inter-val when discordant change in pain and function occurred; however, the SIMILAR-8 did not detect this change. Not only did the SIMILAR-8 fail to detect deterio-ration in functional status, but also the point estimate of change was in the direction of improvement rather than deterioration. This apparent improvement in functional status is consistent with the WOMAC pain subscale's assessment of a reduction in pain. Finally, the WOMAC pain subscale demonstrated substantially higher correla-tions with the SIMILAR-8 compared to the DISSIMILAR-8.
Numerous studies have supported the validity [29-33] and sensitivity to change [29,34-38] of the WOMAC and it is the recommended outcome assessment tool for assessing pain and physical function in studies investigat-ing patients with osteoarthritis of the lower extremity [1-3]. With the exception of several recent investigations [18-20,39], the WOMAC has performed admirably. However, there are two differences between studies that support the WOMAC and those investigations that question its ability to detect valid change. One difference is that the studies supporting the WOMAC did not investigate the measure's factorial validity. Clearly, there is consistent evidence that factorial validity does not exist [18-20,39]. A natural ques-tion asks, "Is the lack of factorial validity important?" A review of the WOMAC's ability to detect change is inform-ative when answering this question. The many studies supporting the WOMAC's ability to detect change share a common feature: pain and function were expected to improve over the assessment interval. Moreover, the inter-val between assessments for many of these studies often exceeded several months, and even if the rate of change differed for pain and function, it is unlikely that this dif-ference could be detected [9,29,35,36,38]. The current study applied a construct validation design that took advantage of "extreme" differences in change for pain and physical function. Consistent with the results of a previ-ous investigation [20], the WOMAC-PF subscale did not detect the decline in functional status that occurred over the first assessment interval.
Because standard practice for some clinicians will not involve the rigorous assessment of physical function within 16 days of total joint arthroplasty, it is natural to question the generalizability of our findings. At issue, is not whether one would assess patients under these cir-cumstances, but whether WOMAC-PF responses are spuriously influenced by WOMAC pain responses. To investigate the relationship between responses to pain and physical function items, we took advantage of a situ-ation where the attributes under investigsitu-ation were known to differ in their change profiles. Our findings sug-gest that WOMAC-PF scores are strongly associated with WOMAC pain scores. In this study the association was strong enough to suppress the SIMILAR-8 and WOMAC-PF abilities to detect deterioration in physical function when the performance measures demonstrated a substan-tial difference in the profiles of change for pain and phys-ical function. We suspect that if the association between reported WOMAC pain and physical function is suffi-ciently strong as to mask the deterioration in physical function that occurred over the first assessment interval in this study, that the association would influence WOMAC-PF scores when the true difference between change pro-files in pain and physical function is less obvious. If this conjecture holds true, it could call into question the results of head-to-head comparison studies where the WOMAC-PF has been shown to be more sensitive to change than competing measures' assessments of physical function [38,40].
Since commencing our study, shorter versions of the WOMAC have been reported [41,42]. However, like the full-length WOMAC, these measures contain a subset of activities common to the pain and function subscales. These measures also lack factorial validity and the ability to detect change in functional status when pain and func-tion display discordant change (see appendix: see Addi-tional file: 1).
WOMAC. Finally, we conceived the shorter versions of the WOMAC-PF to test the hypothesis that the duplication of some items on the WOMAC's pain and physical function subscales contributes to the physical function scale's poor ability to detect change when pain and function display discordant change. Although the DISSIMILAR-8 was more adept at detecting change compared to the WOMAC-PF – and the other shorter versions cited previously – we do not endorse the DISSIMILAR-8 as a viable alternative to the WOMAC-PF. There are many considerations and trade-offs to be weighed when selecting items for a meas-ure. For example, in addition to being psychometrically sound, a measure must possess content validity. Clearly, a lower extremity functional status measure that does not overtly inquire about ambulation lacks content validity. For this reason, we caution against using the DISSIMILAR-8 as an outcome measure for clinical trials and as the basis for decisions in clinical practice.
The stimulus for our study was previous work suggesting WOMAC-PF item responses are spuriously influenced by WOMAC pain item responses. The results of the current support this hypothesis. We believe the results are impor-tant at two levels. Specific to the WOMAC, our findings suggest that either the pain or physical function subscale be restructured to avoid the same activity being included on both scales. A potential solution to be explored in sub-sequent inquiry would be to assess pain in a more general context, rather than focusing on specific activities. In a more general context, our results serve as a cautionary note to measure developers who are contemplating including similar activities on multiple subscales.
Conclusions
The intent of this study was to provide an insight into the causal mechanism of the WOMAC-PF subscale's limited ability to detect change in the presence of discordant change in pain and function. This was accomplished by constructing two shorter versions of the WOMAC-PF sub-scale. One shorter version included activities that appear on both the pain and function subscales; the other shorter version avoided activities common to the pain and func-tion subscales. Like the full-length physical funcfunc-tion sub-scale, the SIMILAR-8 was unable to detect a change in physical function in the presence of discordant changes in pain and function; however, the DISSIMILAR-8 did detect change in the presence of discordance changes in pain and function. This finding supports the hypothesis that the overlap of questions on the WOMAC pain and physical function subscales interferes with the measure's ability to detect change.
Competing Interests
None declared.
Authors' Contributions
PWS and DMK took part in the design, analysis, and writ-ing of this paper.
Additional material
Acknowledgments
This research was supported by a grant from the Orthopaedic and Arthritic Foundation. At the time of this study, Deborah Kennedy was supported by a Studentship Award from the Provincial Rehabilitation Research Program, funded by the Ministry of Health and Long Term Care and the Toronto Rehabilitation Institute Foundation.
References
1. Bellamy N, Kirwan J, Boers M, Brooks P, Strand V, Tugwell P, Altman R, Brandt K, Dougados M, Lequesne M: Recommendations for a core set of outcome measures for future phase III clinical tri-als in knee, hip, and hand osteoarthritis. Consensus develop-ment at OMERACT III.J Rheumatol 1997, 24:799-802.
2. Bellamy N: Osteoarthritis clinical trials: candidate variables and clinimetric properties.J Rheumatol 1997, 24:768-778. 3. Dougados M, LeClaire P, van der Heijde D, Bloch DA, Bellamy N,
Alt-man RD: A report of the Osteoarthritis Research Society International Standing Committee for Clinical Trials Response Criteria Initiative. Osteoarthritis Cartilage 2000,
8:395-403.
4. Bellamy N, Buchanan WW, Goldsmith CH, Campbell J, Stitt LW: Val-idation study of WOMAC: a health status instrument for measuring clinically important patient relevant outcomes to antirheumatic drug therapy in patients with osteoarthritis of the hip or knee.J Rheumatol 1988, 15:1833-1840.
5. Bellamy N: An evaluative index for clinical trials.Design, Meas-urement, and Evaluation Hamilton, McMaster University; 1982. 6. McConnell S, Kolopack P, Davis AM: The Western Ontario and
McMaster Universities Osteoarthritis Index (WOMAC): a review of its utility and measurement properties. Arthritis Rheum 2001, 45:453-461.
7. Houpt JB, McMillan R, Wein C, Paget-Dellio SD: Effect of glu-cosamine hydrochloride in the treatment of pain of osteoar-thritis of the knee.J Rheumatol 1999, 26:2423-2430.
8. Grace D, Rogers J, Skeith K, Anderson K: Topical diclofenac ver-sus placebo: a double blind, randomized clinical trial in patients with osteoarthritis of the knee. J Rheumatol 1999,
26:2659-2663.
9. O'Reilly SC, Muir KR, Doherty M: Effectiveness of home exercise on pain and disability from osteoarthritis of the knee: a ran-domised controlled trial.Ann Rheum Dis 1999, 58:15-19. 10. Thomas KS, Muir KR, Doherty M, Jones AC, O'Reilly SC, Bassey EJ:
Home based exercise programme for knee pain and knee osteoarthritis: randomised controlled trial.BMJ 2002, 325:752. 11. Deyle GD, Henderson NE, Matekel RL, Ryder MG, Garber MB, Alli-son SC: Effectiveness of manual physical therapy and exercise in osteoarthritis of the knee. A randomized, controlled trial.
Ann Intern Med 2000, 132:173-181.
12. Berman BM, Singh BB, Lao L, Langenberg P, Li H, Hadhazy V, Bareta J, Hochberg M: A randomized trial of acupuncture as an adjunctive therapy in osteoarthritis of the knee.Rheumatology (Oxford) 1999, 38:346-354.
13. Takeda W, Wessel J: Acupuncture for the treatment of pain of osteoarthritic knees.Arthritis Care Res 1994, 7:118-122.
Additional file 1
Click here for file
Publish with BioMed Central and every scientist can read your work free of charge "BioMed Central will be the most significant development for disseminating the results of biomedical researc h in our lifetime."
Sir Paul Nurse, Cancer Research UK
Your research papers will be:
available free of charge to the entire biomedical community
peer reviewed and published immediately upon acceptance
cited in PubMed and archived on PubMed Central
yours — you keep the copyright
Submit your manuscript here:
http://www.biomedcentral.com/info/publishing_adv.asp
BioMedcentral
14. Bachmeier CJ, March LM, Cross MJ, Lapsley HM, Tribe KL, Courtenay BG, Brooks PM: A comparison of outcomes in osteoarthritis patients undergoing total hip and knee replacement surgery.
Osteoarthritis Cartilage 2001, 9:137-146.
15. Braeken AM, Lochhaas-Gerlach JA, Gollish JD, Myles JD, Mackenzie TA: Determinants of 6-12 month postoperative functional status and pain after elective total hip replacement.Int J Qual Health Care 1997, 9:413-418.
16. Jain R, Schemitsch EH, Waddell JP: Cementless acetabular revi-sion arthroplasty.Can J Surg 2000, 43:269-275.
17. Laupacis A, Bourne R, Rorabeck C, Feeny D, Tugwell P, Wong C:
Comparison of total hip arthroplasty performed with and without cement : a randomized trial.J Bone Joint Surg Am 2002,
84-A:1823-1828.
18. Thumboo J, Chew LH, Soh CH: Validation of the Western Ontario and Mcmaster University osteoarthritis index in Asians with osteoarthritis in Singapore.Osteoarthritis Cartilage 2001, 9:440-446.
19. Faucher M, Poiraudeau S, Lefevre-Colau MM, Rannou F, Fermanian J, Revel M: Algo-functional assessment of knee osteoarthritis: comparison of the test-retest reliability and construct valid-ity of the WOMAC and Lequesne indexes. Osteoarthritis Cartilage 2002, 10:602-610.
20. Kennedy D, Stratford PW, Pagura SMC, Wessel J, Gollish JD, Wood-house LJ: Exploring the factorial validity and clinical interpret-ability of the Western Ontario and McMaster Universities Osteoarthritis Index (WOMAC). Physiother Can 2003,
55:160-168.
21. Altman R, Asch E, Bloch D, Bole G, Borenstein D, Brandt K, Christy W, Cook TD, Greenwald R, Hochberg M: Development of crite-ria for the classification and reporting of osteoarthritis: clas-sification of osteoarthritis of the knee. Arthritis Rheum 1986,
29:1039-1049.
22. Altman R, Alarcon G, Appelrouth D, Bloch D, Borenstein D, Brandt K, Brown C, Cook TD, Feldman D: The American College of Rheumatology criteria for the classification and reporting of osteoarthritis of the hip.Arthritis Rheum 1991, 34:505-514. 23. Walsh M, Kennedy D, Stratford PW, Woodhouse LJ: Perioperative
functional performance of women and men following total knee arthroplasty.Physiother Can 2001, 53:92-100,114.
24. Podsiadlo D, Richardson S: The timed "Up & Go": A test of basic funtional mobility for frail elderly persons.J Am Geriatr Soc 1991, 39:142-148.
25. Streiner DL, Norman GR: Health Measurement Scales: A Prac-tical Guide to Their Development and Use. 2nd edition. New York, Oxford University Press; 2000.
26. Liang MH, Fossel AH, Larson MG: Comparisons of five health sta-tus instruments for orthopaedic evaluation.Med Care 1990,
28:632-642.
27. Efron B, Gong G: A leisurely look at the bootstrap, the jack-knife, and cross-validation.Am Statistician 1983, 37:36-48. 28. Meng X, Rosenthal R, Rubin DB: Comparing correlated
correla-tion coefficients.Psychol Bull 1992, 111:172-175.
29. Wright JG, Young NL: A comparison of different indices of responsiveness.J Clin Epidemiol 1997, 50:239-246.
30. Brazier JE, Harper R, Munro J, Walters SJ, Snaith ML: Generic and condition-specific outcome measures for people with oste-oarthritis of the knee.Rheumatology (Oxford) 1999, 38:870-877. 31. Bombardier C, Melfi CA, Paul J, Green R, Hawker G, Wright J, Coyte
P: Comparison of a generic and a disease-specific measure of pain and physical function after knee replacement surgery.
Med Care 1995, 33:AS131-44.
32. Hawker G, Melfi C, Paul J, Green R, Bombardier C: Comparison of a generic (SF-36) and a disease specific (WOMAC) (Western Ontario and McMaster Universities Osteoarthritis Index) instrument in the measurement of outcomes after knee replacement surgery.J Rheumatol 1995, 22:1193-1196.
33. Soderman P, Malchau H: Validity and reliability of Swedish WOMAC osteoarthritis index: a self-administered disease-specific questionnaire (WOMAC) versus generic instru-ments (SF-36 and NHP).Acta Orthop Scand 2000, 71:39-46. 34. Fortin PR, Penrod JR, Clarke AE, St-Pierre Y, Joseph L, Belisle P, Liang
MH, Ferland D, Phillips CB, Mahomed N, Tanzer M, Sledge C, Fossel AH, Katz JN: Timing of total joint replacement affects clinical outcomes among patients with osteoarthritis of the hip or knee.Arthritis Rheum 2002, 46:3327-3330.
35. Boardman DL, Dorey F, Thomas BJ, Lieberman JR: The accuracy of assessing total hip arthroplasty outcomes: a prospective cor-relation study of walking ability and 2 validated measure-ment devices.J Arthroplasty 2000, 15:200-204.
36. Laupacis A, Bourne R, Rorabeck C, Feeny D, Wong C, Tugwell P, Les-lie K, Bullas R: The effect of elective total hip replacement on health-related quality of life. J Bone Joint Surg Am 1993,
75:1619-1626.
37. Parent E, Moffet H: Comparative responsiveness of locomotor tests and questionnaires used to follow early recovery after total knee arthroplasty.Arch Phys Med Rehabil 2002, 83:70-80. 38. Theiler R, Sangha O, Schaeren S, Michel BA, Tyndall A, Dick W, Stucki
G: Superior responsiveness of the pain and function sections of the Western Ontario and McMaster Universities Osteoar-thritis Index (WOMAC) as compared to the Lequesne-Algo-functional Index in patients with osteoarthritis of the lower extremities.Osteoarthritis Cartilage 1999, 7:515-519.
39. Ryser L, Wright BD, Aeschlimann A, Mariacher-Gehler S, Stucki G: A new look at the Western Ontario and McMaster Universities Osteoarthritis Index using Rasch analysis.Arthritis Care Res 1999, 12:331-335.
40. Jones CA, Voaklander DC, Johnston DW, Suarez-Almazor ME:
Health related quality of life outcomes after total hip and knee arthroplasties in a community based population. J Rheumatol 2000, 27:1745-1752.
41. Whitehouse SL, Lingard EA, Katz JN, Learmonth ID: Development and testing of a reduced WOMAC function scale.J Bone Joint Surg Br 2003, 85:706-711.
42. Davis AM, Badley EM, Beaton DE, Kopec J, Wright JG, Young NL, Williams JL: Rasch analysis of the Western Ontario McMaster (WOMAC) Osteoarthritis Index: results from community and arthroplasty samples.J Clin Epidemiol 2003, 56:1076-1083.
Pre-publication history
The pre-publication history for this paper can be accessed here: