2019 International Conference on Information Technology, Electrical and Electronic Engineering (ITEEE 2019) ISBN: 978-1-60595-606-0
Effects of Structural Parameters on Liquid
Flowing in Immersion Lithography
Liang ZHENG
*and Yu CHEN
School of Sciences, Harbin Institute of Technology (Shenzhen), Shenzhen, Guangdong Province, China, 518055
*Corresponding author
Keywords: Immersion lithography, Immersion field, Liquid flowing, Structural parameters.
Abstract. The immersion liquid plays a crucial role on the pattern transfer from the projecting lens to the silicon wafer in immersion lithography. To acquire the premium quality of the image after exposure, the immersion liquid must remain highly pure and flow stably. In this paper, a mathematical model is constructed for the immersion fluid field and effects of various structural parameters on the flowing of the immersion liquid are investigated. As a result, optimal structural parameters of the immersion field are acquired to ensure the fast and stable flowing of the immersion liquid in the end.
Introduction
In Immersion lithography, the immersion liquid plays a crucial role on the pattern transfer from the projection lens to the silicon wafer [1-3]. In order to acquire the premium quality of the image after exposure, the immersion liquid must remain highly pure and flow stably [4-6]. In this paper, a mathematical model is constructed for the immersion fluid field via the use of theoretical analysis. Effects of various structural parameters, such as the width, angle of inclination at the injection and recovery ports, on the velocity and flux of the immersion liquid, are investigated. Consequently, the optimal structural parameters of the immersion fluid field can be acquired to ensure the fast and stable flowing of the immersion liquid in the end.
Theoretical Model of the Immersion Fluid Field
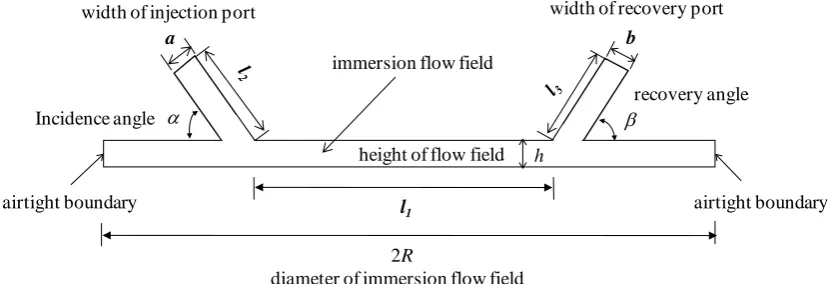
In this research, the immersion fluid is assumed to be incompressible since the flowing speed is much less than the sonic speed. The two-dimensional model of the immersion field is illustrated in Fig.1. As shown in Fig.1, the height of the flow field is far less than the diameter of the flow field and the speed of the immersion liquid is very low, therefore the flow of the immersion liquid can be considered as the laminar flow.
l1
2R
airtight boundary airtight boundary
height of flow field immersion flow field
Incidence angle
a b
width of injection port
h
width of recovery port
recovery angle
[image:1.595.90.507.584.726.2]diameter of immersion flow field
Figure 1. Schematic of the immersion flow field model.
1 1 2 2
1 z2
2 2 f j
z h h
g g
(1)
where z1 and z2 represent the positions of heads at two ends of the injection port and the recovery port;
v1 and v2 denote the average speeds of at these two ends; p1 and p2 present the static pressure at the injection port and recovery port; hf and hj are the frictional head loss and the local head loss of the immersion field, respectively. In addition, represents the specific weight of the immersion fluid and
g denotes the gravitational acceleration.
In this research, the settings at the injection port and recovery port are symmetric, thus the frictional head loss of the immersion field can be expressed as:
1 2 1 2 2 2 12 24 f l l
h v v
h a
(2)
and the local head loss of the immersion field can be expressed as:
2 2 2
2[3 ( 1) ]
90 2 j v a h h g
(3)
where lengths l1 and l2, width a and angle are all illustrated in Fig.1. Due to the mass conservation of the immersion field, there is:
1 2
Qhv av (4)
then the frictional head loss of the immersion field can be written as:
1 2
2 2
3 2
12 24
f
l a l
h v v
h a
(5)
Combing Eq. 3 and Eq. 5 into Eq. 1, the Bernoulli equation of total flux now can be expressed as:
2 2
2
1 1 2 1 2 2
1 2 3 2 2
12 24 1
z ( ) [3 ( 1) ]
2 90 2
p v p l a l a v
z v
g h a h g
(6)
Therefore, once pressures at the injection port and the recovery port are provided, the average speeds can be acquired at these two ports. Consequently, the flux and the speed distribution of the entire immersion fluid field can be obtained.
Parametric Analysis of Liquid Flowing in the Immersion Field
During the exposure process in the immersion lithography, the flowing of the immersion liquid needs not only a fast speed to quicken the circulation of the immersion liquid, but a stable speed to ensure the high quality of the exposed images on the silicon wafer. Eq. 6 reveals that the average speed of the immersion liquid depends on the structural parameters of the immersion field. Therefore, in this section, a parametric analysis is conducted to investigate the effects of the structural parameters on the liquid flowing of the immersion field such that the optimal structural parameters can be obtained to ensure a stable and quick flowing of the immersion fluid.
Effects of Widths of Injection/Recovery Ports
Table 1. Structural parameters in the 2-D immersion field model.
Parameter Symbol Value
Radius of immersion field R 65 mm
Height of immersion field h 1 mm
Width of injection port a 0.5, 1, 2, 3, 4, 5 mm
Width of recovery port b 0.5, 1, 2, 3, 4, 5 mm
Angle of inclination at injection port α 90°
Angle of inclination at recovery port β 90°
Total presure at injection port P1 200 Pa
Static pressure at recovery port P2 0 Pa
[image:3.595.69.532.287.333.2]Utilizing Eq. 6, the average flowing speed at the recovery port and the flux of the immersion field can be acquired, which are listed in Table 2.
Table 2. Average flowing speed and flux of immersion field under different port widths.
Width of the port (mm) 0.5 1 2 3 4 5
Average flowing speed (m/s) 0.140 0.113 0.0676 0.0464 0.035 0.028
Flux of immresion field (kg/s) 0.0701 0.113 0.135 0.139 0.140 0.140
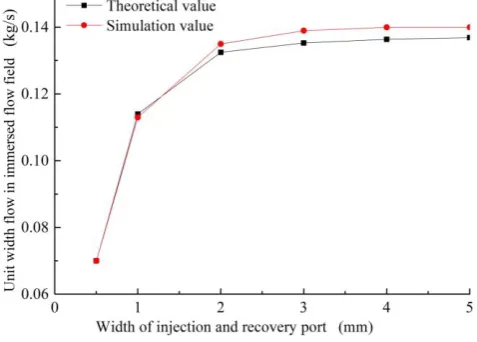
It can be seen that with the increase of the port width, the average flow speed at the recovery port keeps decreasing, whereas the flux of the immersion field converges at about 0.14 kg/s when the port width reaches at the 3 mm.
[image:3.595.188.427.441.612.2]Simulations are also conducted via the use of commercial software FLUENT to compare with the theoretical results. As seen in Fig. 2, the simulation results agree very well with theoretical values (with the relative error less than 3%).
Figure 2. Relationship between the field flux and the port width.
Effects of Angles of Inclination at the Injection/Recovery Ports
[image:3.595.95.502.717.797.2]Table 3 lists the values of structural parameters in the immersion field model as shown in Fig.1. Three different angles are chosen for port angles and two different values for the port widths.
Table 3. Structural parameters in the 2-D immersion field model.
Parameter Symbol Value
Radius of immersion field R 65 mm
Height of immersion field h 1 mm
Width of injection port a 1, 3 mm
Angle of inclination at recovery port β 30°, 60°, 90°
Total presure at injection port P1 200 Pa
Static pressure at recovery port P2 0 Pa
[image:4.595.173.444.247.440.2]The flux of the immersion field is then calculated using Eq. 6 for different injection/recovery port angles. Again, simulations are carrried out and the simulation results are compared with the theoretical values. Figure 3 illustrates the comparison between the simulation results and the theoretical values for the flux of the immersion field. It can be seen these two match quite well with the maximum relative error of 3.3% occurring at the port width of 1 mm and the port angle of 60°. With the same port angle, the field flux gets larger with the increase of the port width. Nevertheless, with the same port width, the field flux becomes smaller with the increase of the port angle.
Figure 3. Relationship between the port angle and the field flux.
Effects of Circumferential Opening Angles at the Injection/Recovery Ports
In order to investigate effects of circumferential opening angles at the injection/recovery ports, a 3-D Schematic diagram of immersion flow field model is needed (as shown in Fig. 4). The structural parameters in the 3-D immersion field model are listed in Table 4 in which the settings at the injection/recovery ports are identical. Five different values are chosen for the circumferential opening angles at the injection/recovery ports ranging from 30 to 150 degrees.
Due to the complexity of this 3-D immersion field model, Eq. 6 can no longer be used to solve for the circumferential opening angles at the injection/recovery ports. Therefore, a numerical model has been developed to obtain effects of circumferential opening angles at injection/recovery ports.
silicon wafer scanning motion
photoresist
injection port recovery port
Immersion liquid sealing structure
Immersion unit mirror frame
mirror frame circumferential opening
angle of injection port
θ1 θ2 circumferential opening angle of recovery port
Top view
Side view lens
[image:4.595.169.441.619.758.2]lens
Table 4. Structural parameters in the 3-D immersion field model.
Parameter Symbol Value
Radius of immersion field R 65 mm
Radius of exposure area r 25 mm
Height of immersion field h 1 mm
Width of injection port a 1 mm
Width of recovery port b 1 mm
Angle of inclination at injection port α 90°
Angle of inclination at recovery port β 90°
Opening angle at injection port θ1 30°, 60°, 90°, 120°, 150°
Opening angle at recovery port θ2 30°, 60°, 90°, 120°, 150°
Total presure at injection port P1 200 Pa
Static pressure at recovery port P2 0 Pa
Gravitational acceleration g 9.81 m/s2
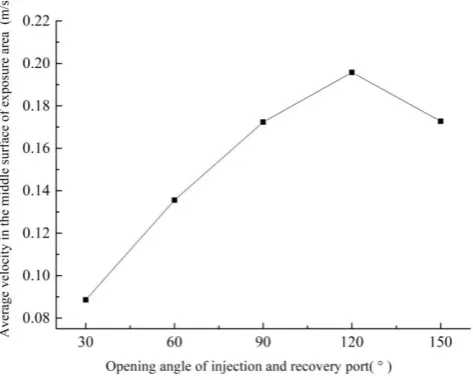
The effects of the circumferential opening angles at injection/recovery ports on the average velocity in the middle surface of exposure area are illustrated in Fig. 5, in which the average velocity in the middle surface of exposure area reaches the maximum value of 0.195 m/s when the circumferential opening angle is 120° at the injection/recovery port. Figure 6 reveals the relationship between the circumferential opening angles at injection/recovery ports and the standard deviation of the velocity in the middle surface of exposure area. It can be seen that the standard deviation of the velocity in the middle surface of exposure area also reaches the smallest value of 0.0035 m/s when the opening angle is 120°, which indicates that the field flow is most stable at this angle.
[image:5.595.192.429.417.607.2]Figure 6. Relationship between the circumferential opening angle at injection/recovery ports and the standard deviation of the velocity in the middle surface of exposure area.
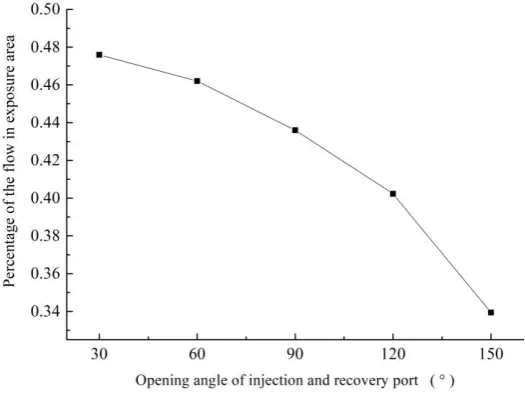
The effects of the circumferential opening angle at injection/recovery ports on the percentage of the flux in the exposure area are shown in Fig. 7. With the increase of the circumferential opening angle at injection/recovery ports, the percentage of the flux in the exposure area keeps decreasing.
Figure 7. Relationship between the circumferential opening angle at injection/recovery ports and the percentage of the flux in the exposure area.
Summary
[image:6.595.178.441.360.557.2]Acknowledgement
This research was supported by Shenzhen fundamental research program JCYJ20160505173700732.
References
[1] T. Hu, et. al., Demonstration of color display metasurfaces via immersion lithography on a 12-inch silicon wafer, Optics Express. v 26, n 15, p 19548-19554, July 23, 2018.
[2] L.-S. Dong, et. al., Optimization of the focus monitor mark in immersion lithography according to illumination type, Journal of Micro/Nanolithography, MEMS, and MOEMS, v 16, n 3, pp. (033505)1-10, July 1, 2017.
[3] Y. Hikida, et. al., Enhancement of ArF immersion scanner system for advanced device node manufacturing, Proceedings of SPIE—Optical Microlithography XXXI, v 10587, pp. X1-11, 2018.
[4] L. Ma, et. al., Development defect model for immersion photolithography, Journal of Micro/ Nanolithography, MEMS, and MOEMS, v 17, n 2, pp. (023502)1-9, 2018.
[5] X. Fu, et. al., Flow behavior control in immersion lithography, Flow Measurement and Instrumentation, v 53, Part B, pp. 190-203, March 2017.