International trade and economic
development: Can foreign direct
investment be predicted?
Seaman, Bruce A. and Moore, Robert E.
Georgia State University, Andrew Young School of Policy Studies,
Georgia State University, Fiscal Research Center, Economics
Department, Georgia State University
December 2003
Online at
https://mpra.ub.uni-muenchen.de/10510/
INTERNATIONAL TRADE AND
ECONOMIC DEVELOPMENT
STRATEGY: CAN FOREIGN
DIRECT INVESTMENT BE
PREDICTED?
Bruce A. Seaman Robert E. Moore
FRC Report No. 90
December 2003DIRECT INVESTMENT BE
PREDICTED?
Bruce A. Seaman Robert E. Moore
Fiscal Research Center
Andrew Young School of Policy Studies Georgia State University
Atlanta, Georgia
Acknowledgments
Research Assistants Sasatra Sudsawasd and Eric Sarpong provided very helpful
technical assistance. Bob Heightchew provided useful comments on earlier drafts.
Funding for this project was provided by the Georgia Department of Industry, Trade and
Table of Contents
Acknowledgments . . . ii
Executive Summary . . . iv
I. Introduction and Description of the Issues . . . 1
A. Types of Foreign Investment . . . 1
B. Purpose of the Study . . . 2
C. The Georgia Context . . . 3
D. Uses of the Results of the Study . . . 3
E. Research Questions . . . 4
II. A Brief Review of Past Research on Foreign Direct Investment . . . 6
III. Methodology: An Overview . . . 12
A. Basic Approach . . . 12
B. Measures of Foreign Direct Investment (The Dependent Variable) . . . 13
C. Measures of Explanatory (Independent) Variables . . . 15
IV. The Empirical Models and Results . . . 16
A. General Description . . . 16
B. Regression Equation Results . . . 17
V. Conclusions, Caveat and Summary . . . 21
A. Conclusions . . . 21
B. Caveats in Interpreting the Results . . . 24
C. Summary . . . 25
Appendix A: Description of Data and Technical Details of the Empirical Analysis . . . 26
Appendix B: Descriptive Statistics . . . 34
A
The home country is where the company has made the preponderance of its prior capital investment.
Executive Summary
It would appear obvious that not all countries and industries are equally good
business recruitment targets for the state’s economic development efforts. However,
partly due to data limitations, little detailed research has been done to clarify how a state
might direct its recruitment strategies to those industries and countries more likely to be
seeking foreign direct investment (FDI) opportunities within the United States. This
study, is a move toward rectifying this deficiency.
While the study found that overall non-industry specific macroeconomic
conditions are surprisingly weak predictors of a county’s propensity to make foreign
direct investments, the empirical findings suggest that Georgia pursue companies whose
home country industriesA are experiencing, in order of importance:
Factor Possible Mechanism
1. Declining levels of unemployment at home in that particular industry
Labor costs are expected to rise at home
2. A decline in the number of companies in the industry at home
Overall factors are squeezing this industry in the home country
3. An increase in exports to the U.S. from the home industry
The market for the industry’s products is good, and especially in the U.S.
4. An increase in the growth of wage payments at home in that industry
Labor costs are already rising at home, if those payments reflect higher wage rates more than an expanding industry
5. Strength in the industry as reflected by an increasing number of competitors in the U.S. and a low business failure rate
Beyond the country of origin, the report found that increasing total wage
payments in the relevant U.S. industry make it more likely that foreign companies from
that industry will move here, since increasing total wage payments can reflect expanding
employment and economic vitality in that particular industry (although higher wage rates
may also be a factor, thus limiting the importance of this indicator).
Despite the inability to generalize from the overall aggregate health of a
country’s economy, the more industry-specific findings are consistent with the following
expectations:
! Persistent unemployment in the European Union will make member countries less attractive targets, although specific industries that have suffered particularly large declines in the number of companies may be seeking FDI as an alternative growth strategy.
! Japan’s unemployment is low, which might suggest rising labor costs and good target industries seeking lower labor costs in the U.S. However, the overall poor financial condition of firms in those industries will limit the likelihood of their investing abroad in the near term future.
! Increasing exports from China to the U.S. would suggest that Chinese companies may be good FDI targets, limited only by financial constraints and the limited experience of Chinese companies.
! Completion of trade agreements with relatively stable countries like Chile will increase exports from Chilean companies to the U.S., and set the stage for future FDI into the U.S.
1Since “domestic” and “foreign” depend on the context, foreign investment into the state
of Georgia could originate in, e.g., Illinois. However, for this study foreign investment is defined as investment originating from outside the United States.
2See Quijano (1990).
I. Introduction and Description of the Issues
It is well established that investment is important to economic growth. While the focus of investment studies is often on domestic savings and the financial institutions that can translate such saving into actual capital creation, investment by foreign sources provides an alternative vehicle for injecting economic resources into a country or a region.1
A. Types of Foreign Investment
Foreign investment can take two primary forms:
! foreign portfolio investment (FPI), which is defined as the passive holdings of securities and other assets without active management or control, and yielding economic returns in the form of interest or non-voting dividends.
! foreign direct investment (FDI), which refers to the acquisition of assets that involves some degree of managerial control. (To be counted as FDI, the United States government agency that reports these data require at least a 10 percent ownership or control of an enterprise’s voting securities, or the equivalent interest in an unincorporated business).2
3A recent Georgia example is the Pirelli Tires headquarters and manufacturing
establishment in Rome, estimated to have been a $141 million “green” investment (Chapman 2002).
is limited to a change in the ownership of existing productive facilities, and hence contributes no new investment or jobs.3
During the 1980s, FDI into the United States increased substantially raising significant questions regarding its proper measurement, its determinants, and its effects. Despite the considerable research devoted to foreign direct investment, gaps remain in our understanding of these important questions. As Co (2000) writes, “....we do not yet completely understand what motivates firms to invest abroad and what the consequent effects of FDI are.” Despite remaining unresolved issues, states presume that an increase in FDI will have positive effects on employment by increasing the quantity and quality of jobs, and by contributing to a more diversified and stable business environment within the state. While the magnitude of such positive effects can vary considerably, this study presumes that the net effects of FDI are positive.
B. Purpose of the Study
This study addresses the following research question:
4Affiliates refer to separate plants or offices of the firm. 5See Uniworld Business Publications, Inc. (1999).
C. The Georgia Context
Georgia has been quite successful in attracting foreign direct investment, and recently has been experiencing increases in such investment, despite declines in the United States as a whole (Chapman, 2002). There are an estimated 193 foreign firms with operations within the state, including 232 separate affiliates.4 The parent companies
are located in 29 different countries representing every populated continent. Regarding specific regions, there are 141 firms with 177 affiliates from Europe, 29 Asian firms with 31 local affiliates, and 15 firms with 16 local affiliates from North America. Australia (5 firms), South America (2 firms), and Africa (1 firm) are clearly less well represented in Georgia. In terms of specific countries, England, Germany, the Netherlands, and Japan are the most prominent, but Italy and France have substantially increased their investments in recent years.5
Regarding specific industries, Georgia has exhibited special strengths in food processing, auto parts, software, biological technology, plastics, agricultural biology and telecommunications. While metropolitan Atlanta has been the primary locus for expansion and location of FDI activity in Georgia, other areas such as Athens, Augusta, Columbus, Macon, and Rome can justifiably be labeled “emerging metro areas” for attracting foreign direct investment to the state.
D. Uses of the Results of the Study
the country and industry-specific economic determinants of foreign firm direct investment into the United States. For example:
! Suppose that there is evidence that increases in employment, output or other economic measures in a foreign country or industry sector are good predictors of increases in overall FDI in the U.S. The GDITT and other state policy-makers could then use that information to focus attention on those countries and industry sectors that the analysis suggest are more likely to be seeking to expand FDI somewhere in the U.S. In this way the GDITT could be more targeted in its attempt to attract foreign investment to Georgia.
E. Research Questions
To further clarify the scope of this study, the most important research questions that are addressed in this study are:
! To what extent have past changes in U.S. imports from a particular foreign economic sector been a leading indicator of changes in FDI within the United States?
! To what extent do domestic economic conditions in specific foreign countries, or within specific industries in those countries, affect the magnitude of foreign direct investment in the United States?
! Which of the possible macroeconomic indicators within a country, or measures of microeconomic conditions within specific industries, are the most reliable predictors of FDI into the U.S.?
! How do economic conditions within specific industries in the U.S. compared to economic conditions within the same foreign industries affect FDI in the U.S.?
As discussed more fully below, data limitations precluded us from considering FDI into Georgia, and thus we focus on FDI into the U.S.
While data limitations made it impossible to go beyond the primary research questions listed above, there are a number of extensions of those issues that would clearly be of interest:
the U.S. auto industry than the same economic indicator applied to, say, Korea?
! Has the FDI predictive power of particular variables changed over time, and how would such changes affect the reliability of using such indicators for future targeting of FDI candidates?
! Is there any evidence that when direct flights to particular countries expand (as Georgia has recently done from Atlanta Hartsfield International Airport via Delta Airlines to Central and South America) FDI from those countries is stimulated? What is the time lag involved? And even if such a relationship could be established, is the direction of causality from anticipated future FDI to an expansion of direct flights, or the reverse link from an expansion of direct flights to an increase in FDI?
II. A Brief Review of Past Research on Foreign Direct Investment
While there is an extensive literature on foreign direct investment, much of it is of little assistance in answering the primary research questions posed above. The reason is that existing research has been largely motivated by slightly different questions. In particular, much of the existing research has focused upon the characteristics of the recipient region, country or market, as opposed to the characteristics of the investing region or market. This is in contrast to the primary focus of this study, which is the characteristics of the investing region.
Such studies (for example, Coughlin et al. 1991) typically find a number of characteristics that are associated with a country that attracts more foreign direct investment, including:
! higher per capita income;
! higher densities of manufacturing activity;
! a more extensive transportation infrastructure;
! lower taxes;
! lower wage rates and higher unemployment rates;
! higher unionization rates (a finding confirmed in some, but not all studies);
! larger “promotional” expenditures.
These factors apply to greenfield FDI (i.e. investment in new facilities) in contrast to mergers and acquisitions.
of FDI in any given country, rather than just explaining why investment is high in one country and low in another.
A recent study (Farrell et al. 2001) regarding FDI made by Japan between 1984-1995 (for 8 manufacturing industries and 16 countries) is noteworthy in this regard. The study found that the dramatic fluctuations in such investment over that period were strongly affected by both the size of the host country’s market, and by domestic macroeconomic conditions within Japan This latter finding is especially noteworthy in justifying our efforts to find domestic leading economic indicators of FDI that could be applied to the better targeting of potential foreign investors into the U.S. (and hence potentially into Georgia).
Another important finding of the Farrell et al. research concerns the role of exports from the investing country (i.e., imports into the host country) as a possible predictor of FDI in the U.S. They find that exports to Japan have a strong positive effect on Japanese FDI in the rest of the world. The authors interpret this as “evidence that FDI has in part been motivated by the desire to diversify and invest in industries in which Japan has comparative disadvantages.” Interestingly, exports from Japan (which are imports into the other countries like the U.S.) have a much more complex relationship to FDI, varying significantly with the industry and the country in question.
6An oligopolistic market is on in which there are few sellers.
7A concentration ratio is the fraction of the total industry sales that are accounted for by
the largest firms in the industry. The higher the ratio, the more potentially monopolistic is the industry, holding all other factors constant.
imports, entry barriers and profitability. That is, higher aggregate industry imports into, say, the U.S. textile industry (not linked only to one exporting country) may reflect the “openness” of the U.S. to competition in that industry, which can then serve to discourage future FDI if it implies low entry barriers and limited future profit opportunities from investing in production facilities in that particular highly competitive industry in that country (suggestive arguments can be found in Pugel et al., 1996; Kogut and Chang, 1996; and Belderbos and Sleuwaegen, 1996). In that situation, higher observed past imports into the U.S. would have a negative relationship with future observed FDI (especially in industries that have been viewed as open and competitive). However, as noted above, the relationship between imports and FDI is complex, and a positive relationship is also possible.
Other researchers have focused upon the quite different issue of the effect of the characteristics of the market structure of the FDI industries in both the home and host countries. This research finds that corporations make ‘horizontal’ investments, i.e., investments to produce abroad the same line of goods that they produce in the home market, when there is a “highly product differentiated” oligopolistic market structure in both the home and host countries.6 On the other hand, ‘vertical’ investments, that is
investments to “produce abroad an input into their production process at home” are more typically done by firms in relatively non-differentiated oligopoly industries in the home market (Caves, 1971). While this at least focuses attention on conditions in the home country, there are substantial difficulties in finding reliable data to proxy “differentiated” and “undifferentiated” oligopoly industries across many different countries that are necessary for sound empirical analysis.
When simple concentration ratios7 can be used to capture these effects, the data
(1991) find in the Japanese case that high industry concentration in the Japanese industry encourages direct investment in the United States, but that high industry concentration in the U.S. deters Japanese FDI into the U.S. A possible explanation for this asymmetric finding is that any higher profitability that might be suggested by a high concentration in a U.S. industry is outweighed by the challenges in competing against the small number of large, dominant U.S. firms in that industry. Regardless of the explanation, FDI is likely to be sensitive to market structure in the host and/or target country.
There have been a large number of industry specific case studies of FDI, many focused on the Japanese manufacturing sector. Some of these studies pose fundamental questions about the very existence of FDI, trying to determine “whether foreign direct investment is motivated by the home technological advantage or by the desire to source technology in the foreign market” (Kogut and Chang, 1991). Related research addresses the complex decision of multinational firms to invest domestically versus internationally (e.g., Stevens and Lipsey, 1988). Since these alternative investment opportunities compete for financing, the choice is sensitive to the comparative expected rates of return for domestic and international investment. This again points to the importance of economic conditions in the home (i.e., investing) and host countries.
The Japanese case studies (often of the electronics industry) also analyze the relative importance of domestic (Japanese) specific technological assets vs. firm-specific marketing assets (often linked to entry barrier issues). The role of “intangible assets based on research and development,” and inter-firm ties within horizontal and business groups have also received attention (Pugel et al., 1996; Belderbos and Sleuwaegen, 1996; Kogut and Chang, 1996). Unfortunately, data limitations prevent us from incorporating into this study measures of variables such as technological assets. While a case study of a particular national industry (Japanese electronics) might be able to construct such an idiosyncratic database for that limited case, there are simply no comparative publicly available data that could be used in the broader analysis undertaken in this study.
8For example, Chapman (2002) cites Heinrich-Peter Rothmann, the German consul
general in Atlanta, as attributing much of the U.S. decline in FDI to the weakening of the dollar. However, the specific quotation from Mr. Rothmann suggests that broader economic weakening (both in the United States and abroad) is the primary cause, and not merely the value of the dollar: “They’re investing less because the overall business climate, has gone down; and there is less money available in Europe, which also has accounting problems, so everybody is being more careful and holding back, checking their own performances, and not venturing out.” In fact, it would be difficult to target the weaker value of the dollar for declines in FDI from 2000 to 2002 since the dollar was actually quite strong over most of this period, weakening measurably only in the second quarter of 2002.
(measured as exports and imports), or international movement of financial resources (measured as foreign portfolio investment or foreign direct investment), can be affected by changes in currency exchange rates. In fact, recent reductions in aggregate FDI in the United States have been explained in part by recent decline in the value of the dollar.8
However, currency values are fundamentally linked to overall economic conditions, so that macroeconomic indicators such as gross domestic product and employment growth will capture part of the effect of exchange rates. Nevertheless, exchange rates are another potential determinant of foreign direct investment.
In summary, while there is a vast research literature on foreign direct investment, much of it is of limited use in providing guidance in answering the primary research questions posed here. However, the literature does strongly suggest that:
! Macroeconomic conditions in the home (investing) country will affect the amount of FDI in the U.S.
! There will be industry specific factors that should be taken into account that would require more dis-aggregated data at the industry level
III. Methodology: An Overview
A. Basic Approach
The purpose of this study is to provide guidance to the GDITT for better targeting of foreign industry sectors as potential candidates for foreign direct investment in Georgia. The basic approach is regression analysis through which we use variations in a set of explanatory variables to explain variations in FDI across countries, industries, and time. The result is that we can identify variables that can be used to suggest what country and industry is likely to be as source of FDI.
For both conceptual and data considerations the analysis of FDI focuses on the entire United States, not Georgia. Conceptually, one can think of the decision to invest in Georgia as a two-step process:
(1) A firm in industry X of country Y decides to gain or expand access to the North American consumer market by engaging in some form of foreign direct investment (primarily greenfield FDI); and
(2) That firm then conducts an analysis of the optimal geographic location within the U.S. for such production facilities. In making that decision, the firm considers the many factors that make a state an attractive place to do business (e.g., access to consumer markets, input costs, transportation infrastructure, state tax, regulatory, and firm relocation incentives, etc.).
9These sources are discussed in more detail in Zeile (2001).
focus on the U.S. extends the analysis beyond those particular industries that have historically made decisions to invest in Georgia.
This distinction between foreign direct investment in the United States and foreign direct investments made specifically in Georgia, has been especially dramatic from 2000 to 2002. In 2001 (and projected for 2002) aggregate American FDI has dropped to about 50 percent of what it had been in 2000, while FDI in Georgia has approximately doubled (Chapman, 2002). This, of course, can easily occur if the industries in a country (say Italy) are reducing their overall investment in the United States, but have chosen Georgia instead of, say, South Carolina or Illinois, for those projects that they are continuing to finance (such as the Pirelli plant in Rome, GA). This illustrates the importance of focusing more broadly on the United States, since the state-by-state variance in FDI is likely to be much greater than is the overall nationwide investment. For the purposes of targeting foreign industries, it is vital to know that aggregate investments, say from Italian firms, were likely to decline, making the competition with states like South Carolina and Illinois for the declining amount of Italian investment especially intense.
B. Measures of Foreign Direct Investment (The Dependent Variable)
The Bureau of Economic Analysis (BEA) collects three broad types of data on foreign direct investment in the United States via annual surveys:9
1. Financial and operating data of U.S. affiliates of foreign firms. An affiliate is a U.S. business enterprise in which a single foreign entity (broadly defined to include individuals, corporations, branches, partnerships, estates and trusts etc. residing outside the 50 states and all U.S. territories and possessions) owns or controls, directly or indirectly, at least 10 percent of the voting securities of an incorporated U.S. business enterprise or an equivalent interest in unincorporated enterprises.
investors (new investment data), reflecting the financial outlays by such investors.
3. International transactions (balance of payments) and direct “investment position” data, covering any U.S. affiliate’s transactions and positions with its foreign parent (or parent group), thus focusing on the foreign parent’s share or interest in the affiliate rather than on the affiliate’s overall size or level of operations.
Balance of payments and direct investment position estimates are available from 1980-1999 (related to FDI positions in the U.S. on a historical cost basis). The data are dis-aggregated by country and industrial sector. However, while there are approximately 40 major FDI countries, the industrial (manufacturing) sectors are merged into just 5 categories. Correspondence directly with William Zeile of the BEA confirmed that legal obligations to avoid disclosure of the data of individual companies greatly limits the country-by-industry detail that the BEA is able to publicly disclose.
The BEA provides data on another measure of FDI that seems more appropriate to this study: the number of foreign-owned establishments in the U.S. (i.e., those with at least 10 percent foreign ownership). However, such data are only available from 1987-1992. Despite these limitations, this is one of the data sources used in this study as a measure of FDI. However, while variations in this measure of FDI could be explained reasonably well by the regression models described below, another measure of FDI was much more successfully explained by the regression analysis.
10
Two other candidates for measuring FDI were payroll, defined as the “dollar value of total payroll in foreign owned establishments in the U.S.,” and “millions of dollars of FDI,” based on historical, not replacement cost. Data availability was especially limited for these measures and was particularly inconsistent across time periods and industries (measured by SIC codes). Thus, they were dropped from the analysis at a fairly early stage.
establishments”, it is not available beyond 1992. As further described below, this measure of FDI (denoted by EMP) was used in our analysis for 1990, 1991 and 1992.10
C. Measures of Explanatory (Independent) Variables
While there was some guidance provided by the past research on FDI , the choice of explanatory (i.e., predicting or independent) variables was also influenced by data availability, and the need for congruence with the time periods for which for the dependent variable (i.e., EMP) was available. As noted above, those employment data were only reliable for 1990-1992.
The three most important general types of explanatory variables are:
(1) Overall measures of the macroeconomic condition of the investing country. Examples of such variable include the level and growth rate of gross domestic output, the level and growth rate of gross domestic investment, the aggregate unemployment rate, aggregate employment, or various measures of income or average wage rate. While exchange rates could potentially be important, the use of essentially cross-section industry-specific data applied to a very limited number of years means that there is little variation in the variable and thus greatly reduces the usefulness of that particular macroeconomic indicator.
(2) Variables, similar to those listed in (1) but tailored more precisely to specific industries in those investing countries, as well as other variables measuring the size and vitality of those specific industries. These include variables such as the number and growth rate of the establishments, total wages paid, the wage rate, and the level of employment, all measured for a specific industry.
imports as a key determinant of FDI. So, it is unclear whether imports would be a good predictor of FDI. However, there is an intuitive appeal to the hypothesis that imports from, say, the German auto industry are a potential predictor of foreign direct investment in the U.S. by the German auto industry. Furthermore, data on imports are more widely available than data on many other potential independent variables. In addition to the possible measures of economic conditions in the investing countries, variables measuring economic conditions within the recipient country (other than imports) should be explored as determinants of FDI. Thus, it would be desirable to include variables such as:
(1) overall macroeconomic or industry-specific measures of economic conditions within the U.S.;
(2) proxies for the risk of investing in the U.S., such as failure rates of businesses in specific industries.
IV. The Empirical Models and Results
A. General Description
The data analyzed in this study apply to 28 industry sectors and 8 foreign (investor) countries with FDI in the United States. This provides 224 (i.e., 8 x 28) total potential observations for any year. The countries are Canada, France, Germany, the Netherlands, Switzerland, the United Kingdom, Australia and Japan. Therefore, despite restricting the analysis to those 8 countries, they do represent geographically dispersed major trading partners of the United States, and except for Italy, the major countries that have been investing in Georgia.
Furthermore, while different lag structures are used for the independent variables (e.g., one-year growth rate vs. five-year growth rate, or the level of an explanatory variable for, say, 1990 applied to the 1991 level of the dependent variable), the data on FDI are available for only 1990-1992 for comparable specific industries. Thus, the underlying number of years in the analysis are typically limited to three. Hence, there are potentially 672 observations in the pooled database (3 x 224).
change in U.S. employment in foreign-owned establishments” as a result of a “one percent change in the value of imports in the prior year.”
B. Regression Equation Results
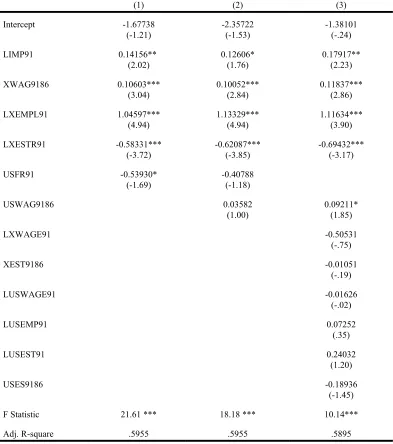
Numerous regression equations were estimated using alternative measures of FDI and different explanatory variables. We report only the best-performing regression results. In particular we report on three regressions that used EMP as the measure of FDI and that relied on industry-specific data (as opposed to overall country-wide macroeconomic indicators). Appendix A contains the technical details of the analysis and the empirical results. In this section we summarize the results of the regression analysis.
It is clear from the regression results that six explanatory variables can be identified as reliable predictors of FDI in the United States.
Increases in the following are associated with an increase in FDI: 1. Imports to the U.S. in the prior year;
2. The change in total wages (the wage rate x employment) over the previous 5 years in the foreign investor country;
3. The level of employment in the foreign investor country in the prior year;
4. The change in total wages (the wage rate x employment) over the previous 5 years in the United States (the host country).
Decreases in following variables are associated with an increase in FDI:
1. The number of business establishments in the foreign investor country in the prior year;
2. The business failure rate in the U.S. in the prior year
foreign-owned establishments by 10.4 percent.” Similarly, the effect of the other variables on FDI are as follows (see Equation 1 of Table 1):
! a 10 percent increase in the value of prior year imports is predicted to increase FDI in U.S. by 1.42 percent;
! a 10 percent increase in the previous 5-year growth rate in total wages in the home country is predicted to increase FDI in the U.S. by 1.06 percent;
! a 10 percent decrease in the number of establishments in the foreign sector in the prior year is associated with an increase in FDI of 5.83 percent;
! a 10 percent decrease in the U.S. business failure rate would increase foreign direct investment by 5.39 percent.
When other independent variables were added to the regression equation, the only variable that contributed to the explanatory power of the equation was the “5 year growth rate in the total wages in the United States.” The regression coefficient implies that a 10 percent increase in the five-year growth rate of U.S. total wages would increase foreign direct investment by 0.92 percent, i.e., less than 1.0 percent (see equation (3) of Table 1).
There is stability across all of the regression equations in the relative rankings of the five variables that appear in all equations. The absolute magnitudes of the parameters change only slightly as other independent variables are added, or as the dependent variable is changed to FDI in 1991 rather than 1992 (see “Effect of Modifying the Dependent Variable” in Appendix A). Therefore, there is no compelling evidence that focusing solely on the prior one year, or the previous five years, changes the story regarding the importance of these variables in predicting foreign direct investment in the U.S. Apparently, there is significant information contained in the concurrent measures of these variables.
1. The level of employment in the foreign investor countries (positive); 2. The number of establishments in the foreign investor countries
(negative);
3. The U.S. business failure rate (negative);
4. The dollar value of imports into the U.S. from the foreign investor countries (positive);
5. The five-year percentage change in total wages paid (earned) in the foreign investor countries (positive);
6. The five-year percentage change in total wages paid (earned) in the United States (positive).
There are two general categories of other independent variables included in at least one regression equation: (1) other versions of foreign (investor country) economic indicators, and (2) an array of similar U.S. (host country) independent variables. Only one of the additional variables (the “5 year percentage change in total wages in the U.S.”) provided useful results, as noted above.
V. Conclusions, Caveats and Summary
A. Conclusions
The purpose of this study was to identify variables that would improve the targeting of specific industries and countries that are likely to expand foreign direct investment within the United States. Even without understanding the reasons why the variables behave as they do, the evidence from those findings seem clear, focus special attention on those specific foreign industries with the following characteristics:
1. Increasing exports to the United States (reflected hence as “imports” into the U.S.) in the preceding year;
2. A relatively high growth rate over the past five years in the total wage payments made to workers;
3. Increasing employment in the current or preceding year;
4. A declining number of business establishments abroad in the preceding year.
Furthermore, special attention should be paid to American industries which exhibit: 1. A lower business failure rate in the preceding year;
2. A relatively high growth rate over the past five years in the total wage payments made to workers.
11 The UNIDO database (CD-ROM), discovered relatively late in the research process,
played a critical role in generating these results. Unfortunately, it also created the challenge of translating across databases using 2-digit vs. 3-digit SIC (or ISIC) codes. Furthermore, the use of this very rich 1963-1999 database was severely limited by the unavailability of data within the United States on foreign direct investment, which was limited to only 1990-1992.
imports as a critical determinant of FDI, our findings confirm the contrary view that imports should not be ignored when trying to predict trends in FDI.
Past research identifies macroeconomic conditions within the investing country as potentially important determinants of FDI, and our findings do confirm that view. However, it was more difficult than expected to find specific macroeconomic indicators that would significantly add to the explanatory power of our FDI equations. No doubt this was due in part to the serious data limitations that always accompany empirical studies of FDI. And, the poor performance of some of the potential macroeconomic indicators can be explained by their being inadequately focused upon specific industries. Hence, general measures of a country’s economy, such as the aggregate unemployment rate and the level or growth rate in nationwide gross domestic product, would naturally be weakened by the fact that not all industries grow or contract at the same rate, so that while some sectors are thriving, others are weakening. Therefore, it is a logical finding that once better data were found at the foreign industry level, the empirical results improved substantially.11 Nevertheless, it was surprising that industry output measures
never performed as well as the employment or total wages. Also, attempts to use wage rates, in contrast to total wages paid (in both foreign industries and within the U.S.) were uniformly unsuccessful in explaining variations in FDI.
with the expectation that industries that have been experiencing significant expansion, as measured by a combination of employment and higher wage rates, would be good candidates for increased foreign direct investment. This is especially the case since the strongest predictor variable is total employment in the foreign industry (either lagged one year or concurrent). Total foreign employment and the five-year change in total foreign wages paid are related measures of a strong and growing foreign industry, which could logically be expected to be seeking expansion into other markets, including via foreign direct investment. The fact that there is at least some evidence that the five-year growth in wages paid in that same industry within the U.S. is also a positive predictor of FDI, would seem to suggest that those foreign industries would then seek to expand where there is also exhibited growth occurring in the potential host country. This interpretation is bolstered by the finding that a lower business failure rate within the host United States would also lead to more foreign direct investment.
Perhaps the most complex variable to interpret is the “number of establishments within the foreign industry,” which is both a statistically and economically significant negative predictor of FDI in the United States. That is, while a growing foreign industry, as measured by total wages paid and total employment, would predict an expansion of foreign investment in the U.S., the seemingly similar measure of foreign industry vitality, “number of total establishments” would predict a decline in FDI in the U.S. This latter finding suggests that expanding productive facilities in the United States is a substitute for expanding productive facilities in the home country.
12The correlation coefficients are 0.73 and 0.30 respectively, both statistically significant
at the 0.003 level or higher.
to the “five year change in total foreign wages”.12 Despite these observations, it is not
an illogical finding that a foreign industry that is growing, as measured by employment and total wages paid, could seek to expand investment abroad at the same time that the number of establishments in that industry is declining. Such a decline could occur due to mergers and consolidation, or as argued above, could reflect decisions to substitute toward production facilities within host countries such as the United States as a particular location strategy (especially if the host markets are themselves growing).
B. Caveats in Interpreting the Results
Despite the relative success in answering the primary research questions posed in the introduction, care must be taken in interpreting the results. The following caveats are especially noteworthy:
1. Since there were no usable country specific FDI data at the industry level for more recent years, the equations could not be subjected to the test of determining their ability to predict actual FDI in time periods beyond 1990-1992. Thus, while there is no particular reason to believe that the relationships identified in this study were particularly unique to the early 1990's, the possibility that structural changes have occurred over the past decade that would limit the usefulness of these findings cannot be dismissed. In this context, however, it is of interest that the early 1990's were a period of overall economic weakness within the United States, while the early 2000's are also a period of recession and economic weakness. Thus, the results may be especially useful in targeting direct investment candidates in the current recessionary situation.
represent only a subset of all of the potential investors into the United States. The limitation of the industries to the manufacturing sector is a more fundamental weakness, inasmuch as the service and information sectors are becoming such significant parts of the modern world economy. Yet, recent economic developments confirm that the “new economy” is itself fragile, and the so-called “old economy” continues to be a fundamentally critical part of any economy.
3. Clearly, with only five countries represented, it was impossible to explore the possibility of regional differences in the determinants of FDI. Thus, any use of these results to target industries and countries must presume that these variables are equally effective in Asia, Europe, and Oceania.
4. Finally, while efforts were made to derive specific numerical interpretations from the parameter estimates, that was primarily in the context of attempting to derive a qualitative ranking of the independent variables from most important to least important. The data are simply not rich enough to derive specific forecasting or simulation models from these findings. The findings are best used to target certain industries and countries who would have a greater propensity to expand foreign direct investment.
C. Summary
Appendix A
Description of Data and Technical Details
of the Empirical Analysis
Data Challenges:
The model we wish to estimate is: FDI = f (independent variables)
The primary challenge is finding data for both the dependent variable measures
of FDI in the U.S. and data for the many possible independent variables for comparable
time periods. In this study, there were many more years of available data for the
independent variables than for the dependent variables.
A secondary challenge is finding independent variable data for a large number
of countries, since there are many missing variables over non-comparable years, which
eliminate some countries from the database due to a lack of sufficiently complete data.
Finally, for those major countries for which a sufficiently complete database is
available, the dependent and independent variable data are only complete at the
industry-specific level for a subset of the 2-digit standard industry classifications (SIC). That is,
for some independent variables such as “gross domestic product,” or “employment in the
foreign investor country,” reliable data are available for nearly all of the approximately
100, 2-digit SIC codes. However, data regarding the independent variable “imports into
the United States” and for the potential dependent variables, “# of foreign-owned
establishments in the U.S., “ or “employment in foreign-owned establishments in the
U.S.,” are typically available for only 28 of those SIC codes. Also, since the important
United Nations database, “Industrial Statistics Database” for 1963-1999 (available on
CD-ROM) reported data for 3-digit ISIC (International Standard Industrial
Classification), translations had to be made between databases to ensure the
comparability of theindustry-specific data. Examples of 3-digit ISIC designations are:
chemicals (351), plastic products (356), fabricated metal products (381), transport
equipment (384), and professional and scientific equipment (385).
Empirical Results
It is important to note that in the specific equations reported in Table 1, missing
values for critical variables led to the elimination of some of the industry sectors and also
a few of the countries that were in the “full” database. Therefore, the specific countries
included in the data used to estimate the equations in Table 1 include: Australia, Canada,
Japan, the Netherlands, and the United Kingdom. Finally, while the full database
included 28 industrial sectors, data limitations again required some reduction in the
sectors included in the Table 1 estimates, with all remaining countries having 20
industrial sectors represented, except for Australia (19). Thus, the total “potential”
number of observations (and resulting “degrees of freedom”) cited earlier is greater than
the actual number of observations in the estimates reported below. Given those
reductions, it is even more noteworthy that the statistical significance of the critical
values is quite high.
The three equations reflect the performance of the key independent variables
explaining variations in the “employment 1992" measure of FDI in the various industry
sectors within the U.S., as measured by the “adjusted R-square” and the “F-statistic,” all
three equations perform very well in predicting variations in US foreign direct
investment (“explaining” nearly 60 percent of such dependent variable variation in
equations which are statistically significant at the .0001 level based on their F statistics).
However, equations (1) and (2) are preferable to equation (3) based on their higher
adjusted R-squares and F-statistics, as well as their exclusion of the last six independent
TABLE 1. REGRESSION RESULTS
---Dependent Variable:
LEMP92---(1) (2) (3)
Intercept -1.67738 (-1.21) -2.35722 (-1.53) -1.38101 (-.24) LIMP91 0.14156** (2.02) 0.12606* (1.76) 0.17917** (2.23) XWAG9186 0.10603*** (3.04) 0.10052*** (2.84) 0.11837*** (2.86) LXEMPL91 1.04597*** (4.94) 1.13329*** (4.94) 1.11634*** (3.90) LXESTR91 -0.58331*** (-3.72) -0.62087*** (-3.85) -0.69432*** (-3.17) USFR91 -0.53930* (-1.69) -0.40788 (-1.18) USWAG9186 0.03582 (1.00) 0.09211* (1.85) LXWAGE91 -0.50531 (-.75) XEST9186 -0.01051 (-.19) LUSWAGE91 -0.01626 (-.02) LUSEMP91 0.07252 (.35) LUSEST91 0.24032 (1.20) USES9186 -0.18936 (-1.45) F Statistic 21.61 *** 18.18 *** 10.14*** Adj. R-square .5955 .5955 .5895
[image:35.612.147.540.152.596.2]Dependent Variable (Measure of FDI)
Variable Definition
EMP: Employment of foreign-owned establishments in the U.S. (manufacturing sector), for various years designated as EMP90, EMP91 and EMP92. (Source: Foreign Direct Investment in the United States, Bureau of Economic Analysis; available at http://www.bea.doc.gov/bea/ uguide.htm#_1_23).
LEMP: The natural logarithm of EMP
Independent Variables (note that “X” designates “external” to the U.S.)
Variable Definition
XESTR Number of establishments, in numbers, in the investing countries, for various years designated as XESTR90 etc. (Source: United Nations Industrial Development Organization (UNIDO), “Industrial Statistics Database, 3-digit level of ISIC Code, 1963-1999, CD-ROM, 2001).
LESTR: The natural logarithm of XESTR.
USEST: Number of establishments, in numbers, in the United States (host country), for various years designated as USEST90, etc. (Source: UNIDO, 2001).
LUEST: The natural logarithm of USEST.
USES: The percentage change in the number of foreign-owned U.S. establishments over some time period, usually five years, so that USES9186 would represent the five year percentage change in such establishments from 1986 to 1991.
XEMPL: Employment, in numbers, in the investing countries by industrial sector, for various years designated as XEMPL90 etc. (Source: UNIDO, 2001).
USEMPL: Employment by industrial sector, in numbers, in the United States (host country), not limited to foreign-owned established as measured by EMP (the dependent variable), for various years designated as USEMPL90, etc. (Source: UNIDO, 2001).
LUSEMPL: The natural logarithm of USEMPL
XWAGE: Total wages and salaries by industrial sector, in millions of $US (i.e., wage rates x employment) in the investing countries, for various years designated as XWAGE90 etc. (Source: UNIDO, 2001).
LXWAGE: The natural logarithm of XWAGE.
XWAG: The percentage change in the total wages and salaries (in $) in investing countries over some time period, typically five years, designated as XWAG9186, e.g., if it is the five year percentage change in wages from 1986 to 1991.
USWAGE: Total wages and salaries by industrial sector, in millions of $ US (i.e. wage rates x employment) in the United States (host country). (Source: UNIDO, 2001).
LUSWAGE: The natural logarithm of USWAGE
USWAG: The U.S. equivalent to XWAG, representing the percentage change in total wage and salaries in the United States over some time period, typically, five years, designated as USWAG9186, e.g., if it is change in wages from 1986 to 1991.
IMP: U.S. general imports data by industrial sector (in $ US), for various years designated as IMP90 etc. (Source: http://dataweb.usitc.gov/ scripts/user_set.asp).
LIMP: The natural logarithm of IMP
Effect of Modifying the Dependent Variable
If equation (1) is rerun with the dependent variable defined as LEMP91 instead
of LEMP92 using identical independent variables except for LIMP90 instead of
LIMP91, the results are largely unchanged. The coefficient estimates and t-values are
as follows:
Intercept -2.67112 (-1.54) LIMP90 0.15954* (1.80)
XWAG9186 0.07594* (1.75)
LXEMPL91 1.13177*** (4.31) LXESTR91 -0.57946*** (2.96)
USFR91 -0.6926* (-1.76)
F Statistic: 15.36*** Adj. R-square: .5064
This modified equation does not change the relative ranking of the importance
of the independent variables, and had only minor effects on the magnitudes of the
parameter estimates, since except for the imports variable, the independent variables in
this fourth equation are not lagged one year. Furthermore, the five year “percentage
change in total wages” continues to be over the period 19861991, thus including 1991
-the year of -the measured FDI. Therefore, -there is no compelling evidence that focusing
solely on the “prior” one year, or the previous “five years” is critical for using these
variables to assist in the prediction of U.S. foreign direct investment. Apparently, there
is also significant information contained in the “concurrent” measures of these variables.
Other Variables Considered and Rejected
While results using an FDI dependent variable for 1990 are not reported in Table
1 (e.g. EMP90), the results are similar to those reported, but are less statistically robust
and are more sensitive to equation specification than those for 1992 or 1991. Thus,
chosen over the period 1990-1992, there is no doubt that the equations are most capable
of explaining FDI in 1992 and least capable of doing so in 1990.
Furthermore, as previously noted, an alternative measure of FDI was “number
of foreign-owned establishments in the U.S.,” which sometimes performed well in the
regression analysis, but was clearly a less successful measure of FDI than was the related
“employment” in those foreign-owned establishments.” The greater success in the
ability of the independent variables to “explain” FDI measured as “employment” rather
than the “number of establishments” is not surprising, inasmuch as changes in economic
activity are often reflected more accurately by employment, which can change more
flexibly than the actual number of firms or production plants.
As noted in footnote 6 in the text, a “payroll” measure of FDI and a proxy for the
“dollar value of FDI” revealed serious missing data problems, and performed very
poorly in any equations in which they were used as the dependent variable. Also the
dollar values of FDI that are commonly reported at the aggregate (not industry specific)
level in the press, related to historical and not replacement cost measures of FDI, and are
thus difficult to reliably compare across different time periods.
Regarding alternative independent variables, it is interesting that obvious
candidates such as “gross domestic product,” “unemployment rates,”or various measures
of industry-specific “output” or “changes in output,” performed poorly compared to the
“employment” or “number of establishment” measures reported in Table 1. It is
especially noteworthy, and predictable, that country-wide macroeconomic indicators that
do not reflect conditions in specific industry sectors always perform more poorly than
the industry-specific variables. Clearly, it is possible that the overall economy of, say,
the Netherlands could be fairly strong even though a specific sector such as “textiles”
could be very weak, and another sector such as “furniture” could be extremely strong.
Thus, the more “micro-economic” specific sector measures of the variables
should perform better, since they are much more accurate reflections of conditions in the
foreign industries who are potential investors in the United States. One possible variable
13In that context, it is widely believed that simple concentration measures such as CR4
(the percentage of total output or revenue accounted for by the largest four firms) are inferior to alternative measures such as the “Herfindahl-Hirschmann Index (HHI), which is a much less generally reported measure of concentration than simple concentration figures (referring to the sum of the squared market shares of all firms in an “industry”).
14
For the record, the exchange rate variability (relative to the dollar) of the five countries’ currencies between 1991 and 1992 was approximately 0 percent for Canada, a 2.25 percent depreciation for Australia, an 8.1 percent appreciation for Japan, a 3.7 percent depreciation for the Netherlands, and a 4.2 percent depreciation for the United Kingdom. Thus, there is some variability over time and across countries in exchange rates over the period of the analysis.
FDI literature) was a measure of “industry concentration.” However, the necessity of
translating some of the data from 2-digit SIC codes to 3-digit ISIC codes greatly
complicated the problem of finding accurate data for such concentration.
Furthermore, the degree of aggregation of those “industries” put into doubt the
practical meaning of any such measures, since any “competitive” implications of
concentration measures diminish as the “industry” is more broadly defined into a
“sector,” rather than a well-defined “product market.”13 Thus, this variable was not
included in the equations.
Finally, exchange rates were not included in the equations because the dependent
variable was defined as “FDI in 1992" or “FDI in 1991,” which would eliminate
variation over time in such currency prices, and because the primary source of
independent variable fluctuations were industry-specific variations within countries,
where the same exchange rate would apply to all industries within any one of the
Appendix B:
Descriptive Statistics
TABLE 2. SIMPLE DESCRIPTIVE STATISTICS
Variable # Obs Mean Std Dev Minimum Maximum
EMP92 560 6,875 13,630 0 150,000
IMP91 ($) 251 1.01E+10 3.38E+10 6,258 3.13E+10
XWAG9186 (%) 140 6.59009 4.6141 -14.65572 15.20121 XEMPL9186 172 279,585 393,929 2,582 1,954,000
XESTR91 120 5,844 10,237 5 52,369
USFR91 (%) 171 1.3642 .3208 .98 2.23
USWG9186 180 3.41898 3.30848 -2.74932 15.20121
TABLE 3. PEARSON CORRELATION COEFFICIENTS
EMP92 IMP91 XWAG XEMPL XESTR USFR91
References
Barrell, Ray and Nigel Pain (1995). “An Econometric Analysis of U.S. Foreign Direct Investment.” The Review of Economics and Statistics: 200-7
Belderbos, Rene and Leo Sleuwaegen (1996). “Japanese Firms and the Decision to Invest Abroad: Business Groups and Regional Core Networks.” The Review of Economics and Statistics 78(2):214-20.
Bureau of Economic Analysis (BEA) (various years). “Foreign Direct Investment in the United States.” Washington, D.C.: United States Department of Commerce. Caves, Richard (1971). “International Corporations: The Industrial Economics of
Foreign Investment.” Economica (New Series) 38(149): 1-27.
Chapman, Dan (2002). “State Pulls in Foreign Investment.” Atlanta Journal Constitution, August 7, p. F1.
Co, Catherine Y. (2000). “R&D, Foreign Direct Investment and Technology Sourcing.” Review of Industrial Organization 16: 385-97.
Coughlin, Cletus C., Joseph V. Terza and Vachira Arromdee (1991). “State Characteristics and the Location of Foreign Direct Investment Within the United States.” The Review of Economics and Statistics: 675-83.
Deloitte Research (2001). Global Investment Trends of U.S. Manufacturers: Building the Global Network. New York: Deloitte Consulting and Deloitte and Touche.
Farrell, Roger, Noel Gaston and Jan-Egbert Sturm (2001). “Determinants of Japan’s
Foreign Direct Investment: A Panel Study, 1984-1995.” Unpublished
Manuscript, Australia-Japan Research Centre, Australian National University, January.
Kogut, Bruce and Sea Jin Chang (1991). “Technological Capabilities and Japanese Foreign Direct Investment in the United States.” The Review of Economics and Statistics: 401-13.
Kogut, Bruce and Sea Jin Chang (1996). “Platform Investments and Volatile Exchange Rates: Direct Investment in the U.S. by Japanese Electronic Companies.” The Review of Economics and Statistics: 221-31.
Pugel, Thomas A, Erik S. Kragas and Yui Kimura (1996). “Further Evidence on Japanese Direct Investment in U.S. Manufacturing.” The Review of Economics and Statistics: 208-13.
Quijano, Alicia M. (1990). “A Guide to BEA Statistics on Foreign Direct Investment in the United States.” Survey of Current Business February: 29-37.
Washington, D.C.: U.S. Department of Commerce.
Stevens, Guy V.G and Robert E. Lipsey (1988). “Interactions Between Domestic and Foreign Investment.” NBER Working Paper Series, Working Paper No. 2714, National Bureau of Economic Research, September.
United Nations Industrial Development Organization (UNIDO) (2001). “Industrial Statistics Database: 3-Digit Level of ISIC Code, 1963-1999.” (CD-ROM). Vienna, Austria: Statistics and Information Networks Branch.
Uniworld Business Publications, Inc. (1999). Directory of Foreign Firms and Operations in the United States, 10th
Edition - State Edition for Georgia. New York: Uniworld Business Publications, Inc.
About the Authors
Bruce A. Seaman is an Associate Professor of Economics and Senior Associate in the Policy Research Center of the Andrew Young School of Policy Studies at Georgia State University. He has a Ph.D. in Economics from the University of Chicago, has worked as an antitrust economist for the Federal Trade Commission, is a former Chair of the Economics Department at GSU, and is Immediate-Past President of the Association for Cultural Economics, International. His research includes industrial organization and antitrust economics, cultural and sports economics, and public finance and impact study methodology. He has previously provided expert assistance to the State of Georgia regarding the issues of severance taxes, an excise tax on auto rentals and the regional impact of the Phillips arena, public services and taxation in Atlanta-in-DeKalb, and financing options for the Fernbank Museum of Natural History.
Robert E. Moore is Associate Dean of Andrew Young School of Policy Studies and Associate Professor of Economics. He received his MA and Ph.D. in economics from Cornell University. He previously taught at Wells College and Colgate University. His primary research interests fall broadly within the areas of international trade and development with a focus on trade policy between developed and developing countries and income inequality. Secondary research interests include issues related to labor supply and other aspects of household economics.
About the Fiscal Research Center
The Fiscal Research Center provides nonpartisan research, technical assistance, and education in the evaluation and design of state and local fiscal and economic policy, including both tax and expenditure issues. The Center’s mission is to promote development of sound public policy and public understanding of issues of concern to state and local governments.
The Fiscal Research Center (FRC) was established in 1995 to provide a stronger research foundation for setting fiscal policy for state and local governments and for better informed decision making. The FRC, one of several prominent policy research centers and academic departments housed in the Andrew Young School of Policy Studies, has a full-time staff and affiliated faculty from throughout Georgia State University and elsewhere who lead the research efforts in many organized projects.
FISCAL RESEARCH CENTER STAFF
David L. Sjoquist, Director and Professor of Economics Margo Doers, Administrative Support
Alan Essig, Senior Research Associate John W. Matthews, Research Associate Lakshmi Pandey, Senior Research Associate William J. Smith, Senior Research Associate Dorie Taylor, Associate to the Director Jeanie J. Thomas, Senior Research Associate
Arthur D. Turner, Microcomputer Software Technical Specialist Sally Wallace, Associate Director and Associate Professor of Economics
ASSOCIATED GSU FACULTY
James Alm, Chair and Professor of Economics Roy W. Bahl, Dean and Professor of Economics Kelly D. Edmiston, Assistant Professor of Economics
Martin F. Grace, Professor of Risk Management and Insurance Shiferaw Gurmu, Associate Professor of Economics
Amy Helling, Associate Professor of Public Administration and Urban Studies Julie Hotchkiss, Associate Professor of Economics
Ernest R. Larkin, Professor of Accountancy
Gregory B. Lewis, Professor of Public Administration and Urban Studies Jorge L. Martinez-Vazquez, Professor of Economics
Theodore H. Poister, Professor of Public Administration and Urban Studies
Michael J. Rushton, Associate Professor of Public Administration and Urban Studies Benjamin P. Scafidi, Assistant Professor of Economics
Bruce A. Seaman, Associate Professor of Economics Geoffrey K. Turnbull, Professor of Economics Mary Beth Walker, Associate Professor of Economics
Katherine G. Willoughby, Professor of Public Administration and Urban Studies
PRINCIPAL ASSOCIATES
Mary K. Bumgarner, Kennesaw State University Richard W. Campbell, University of Georgia Gary Cornia, Brigham Young University Dagney G. Faulk, Indiana University Southeast Catherine Freeman, U.S. Department of Education Richard R. Hawkins, University of West Florida L. Kenneth Hubbell, University of Missouri Julia E. Melkers, University of Illinois-Chicago Jack Morton, Morton Consulting Group Ross H. Rubenstein, Syracuse University Francis W. Rushing, Independent Consultant Saloua Sehili, Centers for Disease Control Stanley J. Smits, Workplace Interventions, Inc. Kathleen Thomas, University of Mississippi Thomas L. Weyandt, Atlanta Regional Commission Laura Wheeler, Independent Consultant
RECENT PUBLICATIONS
(All publications listed are available at http://frc.aysps.gsu.edu or call the Fiscal Research Center at 404/651-2782, or fax us at 404/651-2737. )
International Trade and Economic Development Strategy: Can Foreign Direct Investment Be Predicted? (Bruce A. Seaman and Robert E. Moore)
This study identifies factors that might be used by the state to better target foreign industries and countries that are more likely to be seeking investment opportunities in the U.S. FRC Report/Brief 90 (December 2003).
The Economics of Cigarette Taxation: Lessons for Georgia(Bruce A Seaman)
This report provides estimates of the fiscal effects of increasing taxes on cigarettes. FRC Report 89 (December 2003).
Single Factor Sales Apportionment Formula in Georgia. What Is the NET Revenue Effect? (Kelly D. Edmiston)
This report computes the net revenue effect of changing Georgia's corporate income tax apportionment formula to a sales only formula, considering both corporate income tax and personal income tax revenue implications. FRC Report 88 (October 2003)
Financing Georgia's Schools: A Primer(Ross Rubenstein and David L. Sjoquist)
This report provides an explanation of how K-12 education is financed in Georgia. FRC Report 87 (October 2003)
Getting Serious About Property Tax Reform in Georgia (David L. Sjoquist)
This report lists problems with the property tax in Georgia and outlines a set of policy options for reforming the property tax. FRC Report 86 (August 2003)
The Commercial Music Industry in Atlanta and the State of Georgia: An Economic Impact Study(Kelly D. Edmiston and Marcus X. Thomas)
This report measures the commercial music industry’s economic impact on Atlanta and the State of Georgia. FRC Report/Brief 85 (August 2003)
Twelve Years of Budget Growth: Where Has the Money Gone? (Alan Essig)
This report analyzes the growth in the state budget over the past 12 years and identifies specific policy decisions that caused and resulted in changes in the budget. FRC Report/Brief 84 (July 2003)
Local Government Competition for Economic Development (Kelly D. Edmiston and Geoffrey D. Turnbull)
This report examines the factors driving community tax incentives for industry recruitment. FRC Report 83 (July 2003)
This report looks at current aid alternative methods of disbursing state funds to county health departments. FRC Report/Brief 82 (July 2003).
An Analysis of a Proposed New Economic Development Incentive. (Kelly D. Edmiston, David L. Sjoquist and Jeanie Thomas)
This report evaluates the likely impact of changing Georgia’s economic development tax incentive program. FRC Report/Brief 81 (January 2003)
The Bush Economic Stimulus Plan: What Does It Mean for Georgia. (Sally Wallace)
This brief provides a summary of the President’s economic stimulus proposal. FRC Brief 80 (January 2003)
The Effect of State Income Tax Structure on Interstate Migration. (Sally Wallace)
This report analyzes the effect of state income taxes on individual migration among states. FRC Report/Brief 79 (December 2002)
Georgia’s Corporate Income and Net Worth Taxes. (Martin F. Grace)
This report examines the Georgia Corporate Income tax and Net Worth Tax and examines some possible reforms. FRC Report/Brief 78 (December 2002)
Racial Segregation in Georgia Public Schools, 1994-2001: Trends, Causes and Impact on Teacher Quality. (Catherine Freeman, Benjamin Scafidi and David L. Sjoquist)
This report looks at recent trends in segregation and its impact on teacher quality in the state of Georgia. FRC Report/Brief 77 (November 2002)
Job Creation by Georgia Start-Up Businesses. (Lakshmi Pandey and Jeanie Thomas)
This report examines the success rate of start-up companies in Georgia by industry and by region between 1986 and 2000. FRC Report 76 (November 2002)
Local Tax Base Sharing: An Incentive for Intergovernmental Cooperation. (Geoffrey Turnbull)
This report develops and explains the principles for designing effective tax base sharing among local governments as a means of coordinating development incentives. FRC Report/Brief 75 (October 2002)