http://dx.doi.org/10.4236/epe.2014.611028
The Measuring System for Estimation of
Power of Wind Flow Generated by Train
Movement and Its Experimental Testing
Oleksandr Mokin, Borys Mokin, Vadym Bazalytskyy
Department of Renewable Energy and Transport Electrical Systems and Complexes, Vinnytsia National Technical University, Vinnytsia, Ukraine
Email: [email protected]
Received 14 July 2014; revised 16 August 2014; accepted 2 September 2014
Copyright © 2014 by authors and Scientific Research Publishing Inc.
This work is licensed under the Creative Commons Attribution International License (CC BY).
http://creativecommons.org/licenses/by/4.0/
Abstract
The measuring system for estimation of power of wind flow generated by the train movement has been created. The advantages of the proposed system are the cheapness and simple design. With its simplicity of design and easy build-up of channels, designed measuring system can be used for a wide range of technical problems. This paper describes the design process, validation and con-ducting the first field test of this measuring system.
Keywords
Power Generation, Wind Turbine, Wind Flow, Sensor, Measurement
1. Introduction
Anyone staying on the platform of the station during the freight train passing could fully realize that the speed of wind flow generated by the moving trains can reach significant values and in the case with high-speed trains the wind flow may reach the speed of storm winds. Today the energy of the wind flow is dissipated in the atmos-phere without any benefit while it can be used to generate electricity by using wind power plants located close to the railway tracks.
It is known [1]that power Pwf
( )
W of the wind flow with a density ρ(
kg m3)
received by the wind tur-bine with vertical axis of rotation and axial sectional area of the wind wheel( )
20 m
S and power factor ε, is proportional to that area
( )
20 m
S and the cube of the speed νwf (m/s) of the wind flow, that is:
3 0
2
wf wf
S
In paper [2], the authors of this paper had made a quantitative assessment of the power of the wind flow gen-erated by the train during movement with using the data presented in paper [3], which states that the sensors for measuring speed of the wind flow generated by the train movement were installed on the wall along the railway track. Obviously, the speed of the wind flow fixed by the sensors on the walls is not adequate to the speed of wind flow generated by the same train in the free space.
In order to make quantitative assessment of the speed of wind flow generated by train, in Vinnytsia National Technical University a measuring system that allows making quantitative assessment of the speed of wind flow in the field conditions has been created. The basic structural element of the measuring system is a digital sensor. In this paper, the development of this measuring system and its digital sensors has been considered and the re-search of their applicability for the field conditions has been made.
2. Characteristics of the Developed Digital Sensor
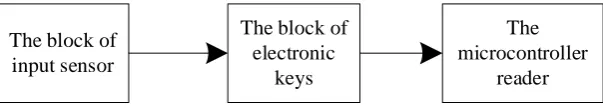
Block diagram of the digital sensor, developed by the authors, is shown inFigure 1.
Schematic representation of the measuring system and its digital sensors placed in the frame which is clear for wind is shown in Figure 2, where the wind speed sensors 1 - 12 are miniature wind wheels with Hall effect sensors.
[image:2.595.163.465.355.409.2]These sensors are based on the ordinary computer fans. Chip FTC S276 [4] are placed on the rotor and its work is based on the principle of Hall effect. This chip crosses the magnetic reels, placed on the stator during the rotation of the rotor. The result of the Hall effect which is manifested in the potential difference is amplified and supplied to a control system of electronic keys which opens the corresponding one. Since one circuit was suffi-cient for our experiment, we used only one of the outputs of the chip.
Figure 1.Block diagram of the digital sensor of speed of the wind flow generated by moving train.
Figure 2. Schematic representation of the placement points measuring sensors for studies of wind flow generated by the train movement.
The block of input sensor
The block of electronic
keys
The microcontroller
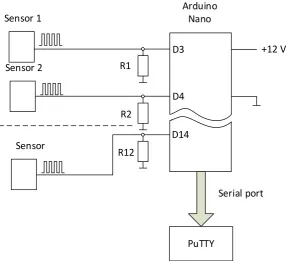
[image:2.595.164.461.443.697.2]Sensor works as follows: when a sensor chip with Hall effect sensor passes through the magnetic field of the stator winding, there appears a difference of potentials which then enters an amplifier and commands to open one of the keys. This ensures operation of the digital sensor which upon rotation generates two discrete pulses per revolution in accordance with the number of coils corresponding polarity. This pulse sequence is applied to the digital inputs of the hardware platform based on Arduino Nano microcontroller ATmega 328 with digital inputs D2-D13 on which signals from speed sensors 1 - 12 are applied. And through the serial port COM3 the data is transmitted to a computer where a program designed for reading data from serial port, collects and records this data every second (Figure 3).
Each sensor calibration was performed in a laboratory wind tunnel using a reference anemometer.
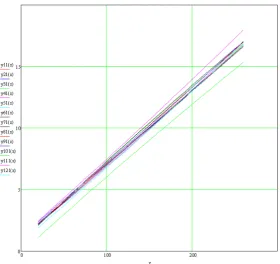
For each speed sensor 1 - 12 by using the method of least squares [5] there was determined the dependence of the rotational speed from the wind speed (Figure 4).
Channel 3 has somewhat different characteristics because it uses sensor with the other ratio of wind speed to the number of turns. But it does not affect the result for each sensor due to using different transformation ratio.
3. Description of Conditions and Locations of the Experiment and the
Characteristics of the Measured Values
After the calibration of all the measuring sensors and having determined the conversion factor for each sensor there was performed the experimental verification of their efficiency.
To carry out an experiment on measuring the speed of the wind flow generated by moving train using the de-signed digital sensor, there had been chosen a segment of a railroad tracks not far from Vinnytsia on the closed railway crossing in the village of Parpurivtsi. This location was chosen with the permission of the railway ad-ministration since it is convenient for mounting the measuring frame with the input sensors, there is the service road and the speed of the trains is relatively high. As the safe distance from the railway track according to the regulatory documents is 3 meters, the experimental measuring system with sensors was placed exactly at this distance perpendicularly to the railway track that is perpendicularly to the axis of the wind flow moving parallel to the train
[image:3.595.168.455.428.689.2]The sensors were placed in three columns at 3, 4, 5 meters from the railway track with four sensors in each
Figure 3. Schematic diagram of the sensors that used to determine the speed characteristics of the wind flow. Sensor 1
Sensor 2
Sensor
Arduino Nano
D3
D4
D14
+12 V R1
R2
R12
PuTTY
Figure 4. Graphs of the speed of wind flow as a function of the number of pulses for each sensor 1 - 12.
according to the scheme shown inFigure 2.
The data was being recorded on a computer simultaneously for each of the sensors with time interval of 1 second as a pulse burst, each of which contained a number of pulses proportional to the angular velocity of the sensor’s rotor.
The experimental data were fixed when freight train with locomotive VL80k and the mixed composition of rail cars with the number of 56 of them was passing by. The speed of the train was 66 kilometers per hour and the time of passing by the measuring system was 45 seconds.
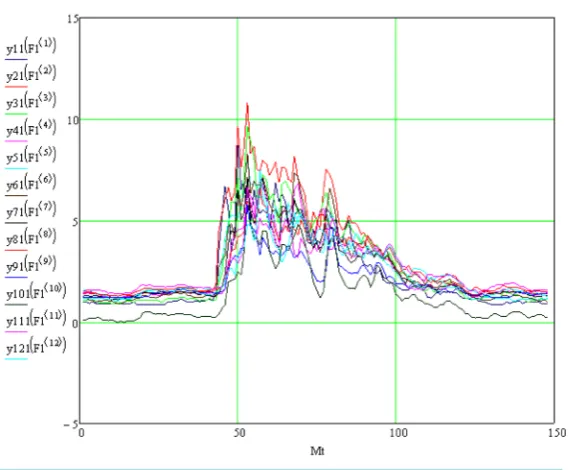
Figure 6 represents the graphs that show the speed change measured by each sensor in the coordinates: x-axis— seconds, vertical axis—meters per second.
FromFigure 5 clearly seen point in time
(
Mt =43 s)
at which the train reaches the measuring system as well as the fact that the wind flow increases several times in comparison to the values of natural wind speed. An interesting fact is that after passing of the train(
Mt =88 s)
, for some more time which is about 35 seconds (up to *88 s t
M = ) for the train with the speed of 66 kilometers per hour, there remains the excess of speed of the wind flow over its value in the unperturbed state.
4. Processing of the Experimental Results
In order to determine the power of the wind flow which crosses the area of the frame of measuring system there had been used an expression (1) which for each sensor would look like
3
, 1, ,12, 2
i i
S V
P = ⋅ ⋅ε ρ ⋅ i= (2)
where S—area of the circle with a diameter equal to the diameter of wheel of the wind speed sensor.
Using the speed curves presented inFigure 5 and cubic splines of Mathcad for the implementation of (2) we get
( )
interp cspline(
(
,)
, , 1,)
i t i t
P u = M P M P u (3)
Figure 5. The graphs of speed of the wind flow measured by each sensor.
These graphs show that the values of the wind flow power differ depending on the location of the sensor. For greater clarity, let us show it on a three-dimensional graph that displays the volume of the received capacity for each measuring channel according to the location of sensors in the frame of the measuring system. For this pur-pose, we integrate each of the dependencies which determines the power of the wind flow for each measuring channel within the time of Mt =43 s to Mt* =121 s and divide the integration interval
(
Mt*−Mt)
and thus find the average power 1, 2, ,12j
s
P = of the wind flow for each measuring channel.
( )
121 43
1
d , 1, 2, ,12 121 43
i i
Ps = P u u i=
−
∫
(4)The average power Psi, i=1, 2,,12 of the wind flow for each measuring channel calculated by the ex-pression (4) can be expressed as matrix-like exex-pression
9.924 12.263 9.276 22.357 12.338 18.399 35.016 17.96 4.468 15.495 14.71 4.511 Ps = (5)
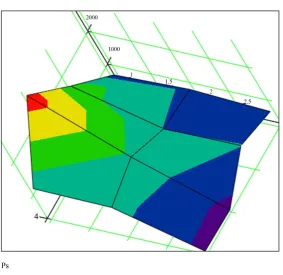
Figure 7 presents the spatial graphs of average power calculated by the expression (4).
To estimate the total power of the wind flow passing through the sensor frame of the measuring system during perturbation of air masses caused by train movement we calculate the sum of values of power for all measuring channels and find
( )
12 1 176.715 W i i PsΣ Ps=
=
∑
= (6)5. Conclusions
1. The structure and block diagram of the digital sensor of the speed of the wind flow generated by the train movement which measures this parameter of the wind flow with sufficient accuracy for practical purposes has been suggested. Using this digital sensor allowed to design a measuring system applicable to measure the real-time parameters of the wind flow on area of 20 m2.
Figure 6. Graphs of power of the wind flow as a function of time for each measuring channel.
Figure 7. The surface of the average power of the wind flow measured by measuring system with displaying the fraction of each measuring channel.
3. It had been determined that the powerful wind flow at an authorized three-meter distance from the railway track could be created only by freight trains with different forms of rail cars moving at speeds above 60 kilome-ters per hour.
0 50 100
100 200 P1 u( )
P2 u( )
P3 u( )
P4 u( )
P5 u( )
P6 u( )
P7 u( )
P8 u( )
P9 u( )
P10 u( )
P11 u( )
P12 u( )
[image:6.595.174.453.82.346.2] [image:6.595.172.456.375.650.2]References
[1] Mkhitaryan, N. (1999) Energy Alternative and Renewable Sources. Experience and Prospects. Naukova Dumka, Kiev, 320 p. (in Ukrainian)
[2] Mokin, B.I., Mokin, O.B. and Bazalytskyy, V.P. (2011) Evaluation of Power, Which Can Be Obtained from the Wind Stream Caused by Traffic Railway Train. Visnyk of Vinnytsia Politechnical Institute, 81-84.
[3] MacNeill, A. and Holmes, S. (2002) Measurement of the Aerodynamic Pressures Produced by Passing Trains. Pro-ceedings of the 2002 ASME/IEEE Joint Rail Conference, Washington DC,23-25 April 2002, 1-8.
[4] (2003) FTC s276, 2-Phase DC Motor Drive IC. Data Sheets, Felling Technology.