Load Shedding using Window Aggregation Queries on
Data Streams
S. Senthamilarasu
Dept. of Computer Science Karpagam University
M.Hemalatha
Dept. of Computer Science Karpagam University
ABSTRACT
The processes of extracting knowledge structures for continuous, rapid records are known as the Data Stream Mining. The main issue in stream mining is handling streams of elements delivered rapidly which makes it infeasible to store everything in active storage. To overcome this problem of handling voluminous data we exposed a novel load shedding system using window based aggregate function of the data stream in which we accept those tuples in the stream that meet a criterion. Accepted tuples are conceded to another process as a stream, while further tuples are dropped. This proposed model conceivably segregates the data input stream into windows and probabilistically decides which tuple to drop based on the window function. The best window aggregate function used for dropping tuples is identified with the three prediction models used in data mining they are Decision Tree, Naïve Bayes and Logistic Regression. The result shows that the cumulative distance and density rank functions outperforms the remaining methods. Distinct to prior methods, our method preserves uniformity of windows all over a query plan, and constantly distributes subsets of the original query responds with insignificant denial in the excellence of the consequence.
Keywords
Data stream mining, Windows functions, Load Shedding Scheme
.
1.
INTRODUCTION
A wireless sensor network (WSN) is a special kind of network that has the capacity of sensing and processing of information. Recent trends in pervasive computing in a data stream management system (DSMS), together with new (wearable) technology as sensors, and wearable computers strongly support novel kinds of applications such as environmental, industrial, military, agriculture and medical [1] [32]. The Sensor devices are used to monitors the data such as temperature, vibration, pressure, motion etc. The data in the wireless sensor networks (WSN) are usually processed [21] [22] [33] [27] within an online fashion is unrestricted and there is uncontrolled in the inception order of the elements to be processed. Nowadays many commercial applications have their data presented within the form of continuously transmitted, this characteristic of the data is called data stream. However, there is a discrepancy between traditional stream and sensor stream. Traditional streaming techniques are not appropriate to sensor streaming. The sensor streams are only a mock-up of the entire population, usually erroneous and noisy, and typically of moderate size. On the other hand, the intact population is usually available in traditional streaming [24]; the data is precise, error-free and huge [23]. In sensor stream, we meet the WSN requirements by sinking data traffic and assuring a quality of the data that allows shrinking energy consumption [25] and delay. While transmitting data through the WSN we can face some problem such as data quality, data reduction and its losses and benefits.
There are two main types of applications for WSNs: actuating and monitoring applications. In monitoring applications, the sensing data processed only by the sensor nodes. In actuating applications, nodes can interfere in the monitored environment [27], [28]. In both circumstances, we can apply data stream techniques in the sensor stream for monitoring and we can compose stream queries in actuating case. These applications are concerned with how queries can be answered [29], [30], [31].
In such environments, data are generated at some end nodes or remote sites and received by a local system (to be processed and stored) with continuous transmission. It is usually desirable for decision makers to find out valuable information hidden in the stream. Data-stream mining is just a technique to continuously discover useful information or knowledge from a large amount of running data elements [11]. Data stream mining is one of the most challenging fields of data mining. Identifying and discovering the recent knowledge and pattern can provide valuable information for the analysis of the data stream [34]. DSMSs are effective tools for building sensing applications. DSMSs greatly simplify the development of monitoring applications because developers or end-users only need to declaratively express the events they are interested in monitoring and the DSMS takes care of the rest [13].
In general, monitoring data in network domains are which rely on the presence of (hardware and/or software) sensors. These sensors turnout vast amounts of data that must be processed analyzed and managed online and during a reliable manner. Thus, we have an appropriate management is needed for processing the data stream. Sensor data and data stream management also greatly affects data which we are collected from source. Data generated by processing streams of sensor information (e.g., after aggregating data over a certain time window or outliers with special semantics which have been detected in a stream) has to be added to a storage.
Data stream management systems could be processed the higher input rates and it performs with their available system resources (e.g., CPU, memory). When input rates exceed the resource capacity the system becomes overloaded. So, we get query answers are delayed. Load shedding[36] could be a technique to get rid of excess load from the system in order to keep query processing up with the input arrival rates. As a result of load shedding, the system delivers approximate query answers with reduced latency [10]. In
data stream
applications
, the unpredicted fluctuation of the arrival rate along with continuous processing of posts queries; is one of the main problems that may result in an overloaded system. Load shedding technique that handles the overloading problem when considering input queries'. Unlike most of theshedding
techniques that assume all queries are equally important, or even give priority to theshedding
techniques that are based on dropping input tuples according to the regions' priorities of an input query as a whole.in sensor data, network traffic, click stream. In many application the distribution underlying the instances (or) the rules that labeled may amendment over time i.e. Goal prediction. Data stream Load shedding can also be used to deals with memory limitations. Its focused stream joins, where the maximum subset measure is used as the approximation metric [6]. The supervision process of the DSMS has been often difficult (or impossible) to run because the amount of data to analyze is too large to be stored in a database before being processed, due in particular to its historical dimension [2]. The recent trends of researches within the data stream encompass problem in the modeling of the KDD process, change detection and modeling in the data set evolving with time, clustering of Data stream, ensembles, support vector machine, application of the data stream algorithm for analysis biology and astronomy and other different data. Data streams generated from sensors and other wireless data sources create a real challenge to transfer these huge amounts of data elements to a central server to be analyzed [16].
The Major Challenges of data stream, the data generation rates might vary some data sources become faster than ever before. This rapid generation of a continuous stream of information has challenging our storage capacity, concept drift detection and communication capabilities of the computing system for query processing [17]. Another one, cluster validity has high tended the need for determining apposite criteria to validate results. New challenges of Data stream is so far as adaptability becomes trickier to find what data stream contains noise. It shares the foremost of the difficulties with stream query processing. Discovering the patterns are hidden and much more general than querying and data stream is ability to permanently maintain the accurate decision model. This paper organized as section 2. Related Work 3. Classification model 4. Problem Definition 5. Proposed Methodology 6. Dataset Description. 7. Empirical Result 8. Conclusion and future scope.
2.
RELATED WORK
Rather than trying to cover the large body of interesting previous work on data streams, Load shedding has been improved from different aspects of a variety of specific problems. The most important variation of load shedding in the data stream includes giving priority of the query for the continuous data stream [3], sketching data stream [4], semantic approximation of windows spilt and joins [6], Windows aggregation queries [9] and Sliding window-join aggregation queries [10]. We continuously evaluate the data stream on the query network, the limit exceeds above the capacity of memory at the same time the insertion, deletion and updating of data stream information could affect the query results. Different methods are applied to load shedding over data stream management has been used for this ratiocinate ,sketching data stream [4], Zhang Longbo , Many data sources are prone to dramatic spikes in volume and data items arrived in a bursting fashion. Loading and processing all the arrived data items are exceed the availability. It becomes essential to shed load by dropping some fraction of the unprocessed data items during a spike. The load shedding strategy is to partition the domain of the join attribute into certain sub-domains, and filter out certain input tuples based on their join values by maintaining statistics of the streaming data [10].
Analyze the behavior of the sketch estimator when computed over a sample of the stream, not the entire data stream, from the size of the join and the self-join size problems. Based on analysis is developed a generic sampling process and instantiate the results of the analysis for all three major types of sampling - Bernoulli sampling which is used for load shedding, sampling with replacement which is used to generate i.e. Samples from a distribution, and sampling without replacement which is used by online aggregation engines[4].
The Novel feedback control-based load shedding scheme for data stream processing is to identify system identification to establish a dynamic model to describe a data stream management system (DSMS), which enables us to analyze DSMS quantitatively [5].To deal with resource constraints by shedding load in the form of dropping tuples from the data streams. Defining the problem space by discussing architectural models for data stream join processing and surveying suitable measures for the quality of an approximation of a set-valued query result and examine in detail a large part of this problem space [6]. Kuen-Fang Jea, load Controlled mining system with an E-deficient mining is decided to execute to preserve a fraction of unprocessed data [7]. Chao-Wei Li, deals with the overload handling for frequent-pattern mining in online data streams, to deal with the frequent item sets which need to be enumerated and counted by the mining. Therefore, load shedding scheme involves the maintenance of a smaller set of item sets, so the workload can be conical accordingly [8].Babcock, B, Data streams is often bursty and data characteristics may vary over time. So we focus on aggregation queries that determine at what points in a query plan load shedding should be performed and what amount of load should be shed at each point in order to minimize the degree of inaccuracy introduced into query answer [9].
3.
CLASSIFICATION MODEL
3.1 Decision Tree
In statistics, data mining and machine learning uses a decision tree as a predictive model which maps annotations about an entry to conclusions about the entries target value [15].Decision tree is a classifier in the form of a tree structure Decision node: specifies a test on a single attribute
Leaf node: indicates the value of the target attribute Arc/edge: split of one attribute
Path: a disjunction of test to make the final decision
3.2 Logistic Regression
trial are modeled, as a function of explanatory variables, using a logistic function. In statistical regression analysis, one is concerned with partitioning variance via the total number of squares calculations - variance in the criterion is basically divided into variance accounted for by the predictors and residual variance.
3.3 NaiveBayes
The Naive Bayes Classifier technique is based on the Bayesian theorem and is particularly suited when the dimensionality of the inputs is high. Despite its simplicity, Naive Bayes can often outperform more sophisticated classification methods [18]. An advantage of the naive Bayes classifier is that it requires a small amount of training data to estimate the parameters necessary for classification. Because independent variables are assumed only the variances of the variables for each class need to be determined, not the entire covariance matrix.
4.
PROBLEM DEFINITION
Conceptually, the load can be shed whenever DataStream exceeds the limit S > C. Let here S represents the stream information and C represents the capacity of the data process. The load can be discarded at any point in the query plan. Dropping a load at earlier points avoids wasting work Q(S); however, as a result of shared operators in the query plan, an early drop might adversely affect the accuracy of too many query answers. Just enough of the load at the chosen point(s) in the query plan must be shed so that the total resource demand gets below the available capability with minimal total loss in accuracy. The data items to be discarded ought to be chosen based on the approximation model and the properties of the operators in the query plan.
5.
PROPOSED METHODOLOGY
This proposed approach handles the problem of handling continuousdata stream by dropping thetuples whicharenot plays a vital role in learning process. This proposed work used the windows based aggregate function instead of regular aggregate function. Many applications need to process streams, for example, financial data analysis, network-traffic monitoring, telecommunication monitoring, and transportation-traffic data. Database researchers are building Data Stream Management systems (DSMS) so that applications can issue queries to get timely information from streams. Managing and processing streams gives rise to challenges that traditional database systems do not have. An important class of queries over data streams is window aggregate queries. The regular aggregate queries just summarize the query result. But the window aggregate functions let manipulate multiple levels of aggregation in the same query.
The proposed algorithm has two steps.
Decide for each query the effectual sampling rates in such a way that will distribute error consistently along with all queries.
In the data flow diagram find out where load shedding should be performed to attain the suitable rates and satisfy the load equation
The major goal of this proposed work is to overcome the problem of overloading in the data stream. The load shedding process is carried out by dropping tuples based on the four different window aggregate function[19] rank(), row_rank() , dense_rank(),cumu_dist(),Percent_rank() and ntile(). The incoming data stream is partitioned based on these functions and the best ones are considered for further processing. The resultant dataset is further applied to the prediction processing tocheck the quality of datasets using three different prediction model decision tree, naïve bayes and logistic regression. The queries used for dropping tuples are as follows: row_number() – number of the current row within its partition, counting from 1.
Syntax:
Select Row_number() over (Query_partition_clause order_by_clause) from table.
Fig 1.Workflow of Dropping tuples based on Window Aggregate Functions
ROW_NUMBER is a logical function. It assigns a distinctive number to each row to which it is functional (either each row in the partition or each row returned by the query), in the ordered sequence of rows specified in the order_by_clause, beginning with 1.By nesting a subquery using ROW_NUMBER within a query that retrieves the ROW_NUMBER values for a specified range, it is possible to find a precise subset of rows from the results of the inner query. Use of this function lets to implement top-N, bottom-N, and inner-N reporting. For consistent results, the query must ensure a deterministic sort order.
rank () - rank of the current row with gaps; same as row_number of its first peer.
Syntax:
Select Rank () over (Query_partition_clause order_by_clause) from table.
This query returns the rank of all rows within the sliding window of a result set. The rank of a row is one plus the number of ranks that come previous to the row in question. As an aggregate function, RANK-WISE(RW) computes the rank of a hypothetical row recognized by the arguments of the function with respect to a specified sort specification. The arguments of the function must all assess to stable expressions
Collecting Incoming
Data
Applying Window Aggregation
Functions
Dropping Tuples Based on the Functions Outcome Applying Prediction
within each aggregate group, because they recognize a single row within each group. The constant argument expressions and the expressions in the ORDER BY clause of the aggregate match by position. Therefore, the number of arguments must be the same and their types must be compatible.As an logical function, RANK calculates the rank of each row returned from a query with respect to the other rows returned by the query, based on the values of the value_exprs in the order_by_clause.
dense_rank() - rank of the current row without gaps; this function counts peer groups.
Syntax:
Select Dense_Rank () over (Query_partition_clause order_by_clause) from table
This method returns the rank of rows inside the partition of a result set, without any gaps in the ranking. The rank of a row is one plus the number of distinctive ranks that come before the row in query.
As an aggregate function, DENSE_RANK (DR) analyze the dense rank of a hypothetical row identified by the arguments of the function with respect to a given sort specification. The arguments of the function must all evaluate to constant expressions within each aggregate group, because they identify a single row within each group. The expressions in the order_by clause of the aggregate function and constant argument expressions must match by position. Therefore, the number of arguments must be the same and types must be compatible.As an logical function, DENSE_RANK calculates the rank of each row returned from a query with respect to the further rows, based on the values of the value_exprs in the order_by_clause.
cume_dist() - relative rank of the current row:(number of rows preceding or peer with current row) / (total rows) CUME_DIST (CD) computes the cumulative distribution of a value in a group of values. The range of values returned by CUME_DIST is between 0 - 1. Tie values always evaluate to the same cumulative distribution value .CUME_DIST calculates the relative position of a precise value in a group of values. For a row r, assuming ascending ordering, the CUME_DIST of r is the quantity of rows with values lower than or equal to the value of r, divided by the quantity of rows being evaluated (the entire query result set or a partition).
Syntax:
Select CUME_DIST () over (Query_partition_clause order_by_clause) from table.
Percent_rank()-relative rank of the current row:(rank-1) / (total rows-1)
PERCENT_RANK(PR) is similar to the CUME_DIST (cumulative distribution) function. The range of values
returned by 0 to 1 inclusive. The first row in any set has a PERCENT_RANK of 0..
Syntax:
Select PERCENT_RANK () over (Query_partition_clause order_by_clause) from table.
As an aggregate function, PERCENT_RANK evaluate, for a hypothetical row r identified by the arguments of the function and a corresponding sort specification, the rank of row r minus 1 divided by the number of rows in the aggregate group. This evaluation is made as if the hypothetical row r were inserted into the group of rows over which Database is to aggregate. So the number of arguments must be the same and their types must be compatible.
NTILE()- is an analytic function divides an ordered data set into a number of buckets indicated by expression and assigns the appropriate bucket number to each row. The buckets are numbered 1 through expression. The expression value must resolve to a positive constant for each partition.
Syntax:
Select NTILE (num_buckets) over (Query_partition_clause order_by_clause) from table.
The number of rows in the buckets can differ by at most 1. The remainder values (the remainder of number of rows divided by buckets) are distributed one for each bucket, starting with bucket 1.If expression is greater than the number of rows, then a number of buckets equal to the number of rows will be filled, and the remaining buckets will be empty.
After applying the six different window aggregate functions the resultant tuples classified using the prediction models to identify which window aggregate function contributes the best correct prediction value. The dataset which was produces the highest accuracy rate is considered for the further processing in the data stream handling process. So the prediction models are used to identify which set of tuples are best suited for further investigation.
6.
DATASET DESCRIPTION
6.1
PostgreSQL
PostgreSQL is an object-relational database management system (ORDBMS) and open-source descendant. It supports a large part of the SQL standard and offers many modern features. Also, PostgreSQL can be extended by the user and it can be used, modified, and distributed by anyone free of charge for any purpose, be it private, commercial, or academic [19].
7.
EMPRICAL RESULTS
For experiments used PostgreSql of dropping the tuples based on window aggregate function and for analyzing the prediction model rapid miner is used. In this experiment dropping of tuples is performed using four different functions rank(), row_number(), dense_rank() , cume_dsit() , Percent_rank() and NTile().After dropping the tuples based on the above discussed window aggregate function . The partition tuples are tested for data quality using three prediction methods Decision Tree, Naïve Bayes and Logistic Regression. In rank() function give the priority to each tuple based on the query result as well as the results enhanced with the rank() wise order of each tuple.In row_number() function presents the consequence of each tuple .The query results enhanced with the logical order row number of each tuple in table. The significance dense_rank() function provides the total density of each row and column. The resultant of the user query input showed with the density of the each tuple in table. cume_dist() function provides the relation .i.e. cumulative distance of each tuple and the query result attaché with the cumulative distance. The importance of Percent_rank() provides the percentage of each row. The resultant of the user query input showed with the percentage of the each tuple in table.The significance of Ntile() displays buckets give by user The resultant of the user query input showed with the allocated bucket size of the each tuple in table. The classification models can be evaluated using accuracy, precision and recall of each prediction models. The Naïve bayes algorithm outperforms the remaining ones and the aggregate function best suited of dropping tuples are dense_rank(),cume_dist().
7.1 Confusion Matrix
[image:5.595.341.515.381.561.2]One of the methods to evaluate the performance of a classifier is using confusion matrix the number of correctly classified(CC) instances is sum of diagonals in the matrix; all others are incorrectly classified(ICC)[20]. The following terminology is often used when referring to the counts tabulated in a confusion matrix [12].
Table 1. A Confusion matrix for a binary Classification problem
in which the classes are not equally important
Standard Metrics
Predicted Class
CC ICC
Actual class
CC TP FN
ICC FP TN
True Positive (TP): corresponds to the number of positive examples correctly predicted by the classification model.
False Negative (FN): corresponds to the number of positive examples wrongly predicted as negative by the classification model.
False Positive (FP): corresponds to the number of negative examples wrongly predicted as positive by the classification model.
True Negative (TN): corresponds to the number of negative examples correctly predicted by the classification model.
The counts are a confusion matrix can also be expressed in terms of percentages. The true positive rate (TPR) or sensitivity is defined as the fraction of positive examples predicted correctly by the model
TPR = TP / (TP + FN)
Similarly, the true negative rate (TNR) is defined as the fraction of negative examples predicted correctly by the model
TNR = TN / (TN + FP)
False positive rate (FPR) is defined as the fraction of negative examples predicted as a positive class the model, i.e.,
FPR = FP / (TN + FP)
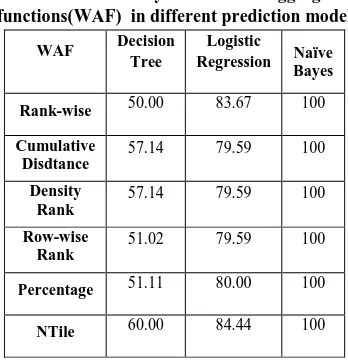
Table 2. Accuracy of Windows aggregate functions(WAF) in different prediction model
WAF Decision
Tree
Logistic
Regression Naïve Bayes
Rank-wise 50.00 83.67 100
Cumulative Disdtance
57.14 79.59 100 Density
Rank
57.14 79.59 100 Row-wise
Rank
51.02 79.59 100
Percentage 51.11 80.00 100
NTile 60.00 84.44 100
Finally the false negative rate (FNR) is the fraction of positive examples predicted as a negative class. i.e.,
FNR = FN / (TP + FN) Accuracy,Precision,Recall:
The Accuracy, Precision, Recall values are calculated as follows,
Accuracy, ACC = (TP+TN) / (TP+TN+FP+FN)
[image:5.595.78.260.661.770.2]Table 3. Precision of Windows aggregate functions in different prediction model
WAF Decision
Tree
Logistic
Regression Naïve Bayes
Rank-wise 50.0 100 100
Cumulative Disdtance
0.0 0.0 100 Density
Rank
0.0 0.0 100 Row-wise
Rank
51.02 0.0 100
Percentage 51.11 100 100
[image:6.595.76.259.283.460.2]NTile 0.00 100 100
Table 4. Recall of Windows aggregate functions(WAF) in different prediction model
WAF Decision
Tree
Logistic
Regression Naïve Bayes
Rank-wise 100 20 100
Cumulative Disdtance
0.0 0.0 100 Density
Rank
0.0 0.0 100 Row-wise
Rank
100 0.0 100
Percentage 100 10.00 100
NTile 0.00 30.00 100
The evaluation results for the above four windows functions reveals that the performance using our prediction model approaches i.e classification methods. And the noticeable improvement is that Naïve bayes produces a very significant change in its performance which outperforms the other classification methods.
[image:6.595.57.277.604.725.2]The following figure, it is observed that among the six window aggregate functions rank(), Rowrank(), dense_rank () ,cume_dist(), percentage_rank() and ntile() per performs better in dropping tuples in the datastream to overcome the problem of handling continuous flow of data.
Figure 2: Experimental result based on Accuracy
The prediction models are applied to find the efficency of each models and the naïve bayes predicted the performance of each function in a significant way.
8.
CONCLUSION AND FUTURE SCOPE
In this proposed work the load shedding is based on the concept of dropping tuples during datastream overloading. The tuples are dropped using the different window aggregate function. Then to check the quality of the dataset the prediction models are applied and the result gives the accuracy, precision and recall value of each models. The Naivebayes method outperforms remaning models. The ranking method best performed for tuple dropping is dense_rank () and cumulative distance function.
In future, we plan to handle replications to avoid the rededunt tuples that exist in the table & therby incresing the accuracy and network quality respectively.
9.
ACKNOWLEDGMENTS
I thank the Karpagam University for the motivation and encouragement for giving me the opportunity to do this research work as successful one.
10.
REFERENCES
[1] Gert Brettlecker, Heiko Schuldt , Peter Fischer , Hans-Jörg Schek ,: Integration of Reliable Sensor Data Stream Management into Digital Libraries:.
[2] Georges HEBRAIL.: Data stream management and mining. In: Mining Massive Data Sets for Security : version 1 - 30 Apr 2010, pages 89-101.
[3] Helmy, Y.M. El Zanfaly, D.S. ; Othman, N.A. .:Prioritized query shedding technique for continuous queries over data streams. In: IEEE, Computer Engineering & Systems, 2009. ICCES 2009. International Conference on 14-16 Dec. 2009, Page (s): 418 - 422 .
[4] Rusu, F. Dobra, A. .:Sketching Sampled Data Streams. In: Data Engineering, 2009. ICDE '09. IEEE 25th International Conference on March 29 -April 2 2009. Page (s): 381 – 392.
[5] Yunyi Zhang , Deyun Zhang ; Chongzheng Huang .: A Novel Adaptive Load Shedding Scheme for Data Stream Processing. In: IEEE, Future Generation Communication and Networking (FGCN 2007) on 6-8 Dec. 2007 Volume: 1 , Page (s): 378 - 384 .
[6] Das, A. Gehrke, J. ; Riedewald, M.:Semantic approximation of data stream joins Knowledge and Data Engineering. In: IEEE Transactions on Jan. 2005 Volume: 17, Issue: 1, Page (s): 44 - 59 .
[7] Kuen-Fang Jea, Chao-Wei Li, Chih-Wei Hsu, Ru-Ping Lin, Ssu-Fan Yen.:A load-controllable mining system for frequent-pattern discovery in dynamic data streams In: IEEE, Machine Learning and Cybernetics, International Conference on 11-14 July 2010, Vol. IV, Page (s): 2466-2471.
Fuzzy Systems and Knowledge Discovery, Eighth International Conference on 26-28 July 2011, Vol. II, Page (s): 1294- 1299 .
[9] B. Babcock, M. Datar, R. Motwani.:Load shedding for aggregation queries over data streams. In: IEEE, Data Engineering, Proceedings. 20th International Conference on 30 March-2 April 2004, page (s): 350-361.
[10]Zhang Longbo,Li Zhanhuai,Wang Zhenyou,Yu Min.:Semantic Load Shedding for Sliding Window Join-Aggregation Queries over Data Streams. In: IEEE, Convergence Information Technology, 2007. International Conference on 21-23 Nov. 2007, Page (s): 2152-2155.
[11]Chao-Wei Li, Kuen-Fang Jea, Ru-Ping Lin, Ssu-Fan Yen, Chih-Wei Hsu.: Mining frequent patterns from dynamic data streams with data load Management. In: The Journal of Systems and Software 85 (2012) 1346– 1362.
[12]Manganaris S., Christensen M., Zerkle D., Hermiz K.: A data mining analysis of RTID alarms: Computer Networks, 34, 2000, page(s). 571-577.
[13]Shengliang Xu ,Magdalena Balazinska.: Sensor Data Stream Exploration for monitoring applications: DMSN’2011.
[14]Department of Transporation Coordinated Highways
Action Respose Team,Maryland,
http://www.chart.state.md.us/default.asp.
[15]Carlos H. C. Teixeira, Gustavo H. Orair, Wagner Meira Jr., Srinivasan Parthasarathy.: An Efficient Algorithm for Outlier Detection in High Dimensional Real Databases. [16]Mohamed Medhat Gaber, Shonali Krishnaswamy,
Arkady Zaslavsky: Adaptive mining Techniques for Data Stream Using Algorithm Output Granularity.
[17]Mohamed Medhat Gaber, Arkady Zaslavsky and Shonali Krishnaswamy .:Mining Data Streams: A Review.In: SIGMOD Record, Vol. 34, No. 2, June 2005,Page(s)18-26.
[18]Jia WU, Zhihua CAI.: Attribute Weighting via Differential Evolution Algorithm for Attribute Weighted Naive Bayes (WNB).: Journal of Computational Information Systems 7:5 (2011) page(s) 1672-1679. [19]PostgreSQL Documentation, http://www.postgresql.org. [20]Knowledge Discovery in Databases- Confusion Matrix,
http://www2.cs.uregina.ca.
[21]F. Akyildiz, W. Su, Y. Sankarasubramaniam, and E. Cayirci, .A survey on sensor networks,. IEEE Communications Magazine, vol. 40, no. 8,pp. 102.114, August 2002.
[22]T. Arampatzis, J. Lygeros, and S. Manesis, .A survey of applications of wireless sensors and wireless sensor networks,. in Mediterranean Control Conference (Med05), 2005.
[23]E. Elnahrawy, .Research directions in sensor data streams: Solutions and challenges,. Rutgers University, Tech. Rep. DCIS-TR- 527, May 2003.
[24]E. Elnahrawy and B. Nath. Cleaning and querying noisy sensors. In Submitted for review, 2003.
[25]S. Tilak, N. B. Abu-Ghazaleh, and W. Heinzelman, .A taxonomy of wireless micro-sensor network models,. ACM SIGMOBILE Mobile Computing and Communications Review, vol. 6, no. 2, pp. 28.36, April 2002.
[26]A. Lins, E. F. Nakamura, A. A. Loureiro, and C. J. Coelho Jr., .Beanwatcher: A tool to generate multimedia monitoring applications for wireless sensor networks,. in Management of Multimedia Networks and Services, ser. Lecture Notes in Computer Science, A. Marshall and N. Agoulmine, Eds., vol. 2839. Belfast, Northern Ireland: Springer-Verlag Heidelberg, September 2003, pp. 128.141.
[27]LIns.A,Semi automatic Generation of monitoring applications for wireless networks. In: Proceedings of the 9th IEEE International Conference on Emerging Technologies and Factory Automation (ETFA 2003).Vol (1), pp.506-511.
[28]D. J. Abadi, W. Lindner, S. Madden, and J. Schuler,: An integration framework for sensor networks and data stream management systems. In: Proceedings of the Thirtieth International Conference on Very Large Data Bases. VLDB 2004, September 2004, pp. 1361.1364. [29]B. Babcock, S. Babu, M. Datar, R. Motwani, and J.
Widom, .Models and issues in data stream systems,. in Proceedings of the twentyfirst ACM SIGMOD.SIGACT.SIGART symposium on Principles of database systems, June 2002, pp. 1.16.
[30]S. R. Madden, M. J. Franklin, J. M. Hellerstein, and W. Hong, .Tinydb: An acquisitional query processing system for sensor networks,. ACM Transactions on Database Systems (TODS), vol. 30, no. 1, pp. 122.173, March 2005.
[31]Y. Yao and J. Gehrke, .Query processing for sensor networks,. in First Conf. on Innovative Data Systems Research (CIDR), January 2003.
[32]T. Arampatzis, J. Lygeros, and S. Manesis, .A survey of applications of wireless sensors and wireless sensor networks,. in Mediterranean Control Conference (Med05), 2005.
[33]A. Lins, E. F. Nakamura, A. A. Loureiro, and C. J. Coelho Jr., .Beanwatcher: A tool to generate multimedia monitoring applications for wireless sensor networks,. in Management of Multimedia Networks and Services, ser. Lecture Notes in Computer Science,vol. 2839. Belfast, Northern Ireland: Springer- Verlag Heidelberg, September 2003, pp. 128-141.
[34]Hua-Fu Li , Suh-Yin Lee.: Mining frequent itemsets over data streams using efficient
[35]Window sliding techniques: Expert Systems with Applications 36 (2009) page(s).1466- 1477.
AUTHOR'S PROFILE
S. Senthamilarasu, completed MCA, Pursuing Ph.D Research in Computer Science, under the guidance of Dr. M. Hemalatha, Professor and Dept. Computer Science at Karpagam University, Coimbatore, Tamilnadu. Presented two papers in national conferences and one International conference. Area of my Research is Data Stream in Data mining.
Dr. M. Hemalatha completed M.Sc., M.C.A., M. Phil., Ph.D (Ph.D, Mother Terasa women's University, Kodaikanal). She is Professor & Head and guiding Ph.D Scholars in Department
of Computer Science at Karpagam University, Coimbatore. Twelve years of experience in teaching and published more than hundred papers in International Journals and also presented more than eighty papers in various national and international conferences. Area of research is Data Mining, Software Engineering, Bioinformatics and Neural Network. She is a Reviewer in several National and International Journals.