Volume 45– No.3, May 2012
A Proposed Relational Fuzzy C-Means
Algorithm Applied to 2D Gel Image
Segmentation
Shaheera Rashwan
Informatics Research Institute, City for Science
and Technology, Borg ElArab, Alexandria, Egypt
Amany Sarhan
Computers and Automatic Control Engineering Department, Faculty of Engineering, University of
Tanta, Tanta, Egypt
Bayumy.A.Youssef
Informatics Research Institute, City for Science
and Technology, Borg ElArab, Alexandria, Egypt
ABSTRACT
One of the new and promising algorithms appeared in the area of image segmentation is the Fuzzy C-Means algorithm. This algorithm has been used in many applications such as: data analysis, pattern recognition, and image segmentation. It has the advantages of producing high quality segmentation compared to the other available algorithms. Our work in this paper will be based on the Fuzzy C-Means algorithm and by adding the relational fuzzy notion to it so as to enhance its performance especially in the area of 2-D gel images. The simulation results of comparing the Fuzzy C-Means (FCM) and the proposed algorithm Relational Fuzzy C-Means (RFCM) on 2D gel images acquired from: Human leukemias, HL-60 cell lines and Fetal alcohol syndrome (FAS) show the improvement achieved by the proposed algorithm in overcoming the over-segmentation error.
Keywords
Fuzzification, image segmentation, Protein spot detection, 2D gel images
1. INTRODUCTION
Two-dimensional gel electrophoresis (2-D Gel) enables separation of mixtures of proteins due to differences in their isoelectric points (pI), in the first dimension, and subsequently by their molecular weight (MWt) in the second dimension. Other techniques for protein separation exist, but currently 2-D Gel provides the highest resolution allowing thousands of proteins to be separated. The great advantage of this technique is that it enables, from very small amounts of material, the investigation of the protein expression for thousands of proteins simultaneously.
In this paper, the most important issues and challenges related to digital image analysis of the gel images will be addressed, namely the segmentation of the images. This segmentation is very crucial in images such as the 2D gel images as it is used to conclude the existence (or not) of malicious cells in the patient's protein sample. Image segmentation is the process of dividing images into regions according to its characteristic e.g., color and objects present in the images. These regions are sets of pixels and have some meaningful information about object. The result of image segmentation is in the form of images that are more meaningful, easier to understand and easier to analyze. Correct segmented results are very useful for the analysis, predication and diagnoses.
Fuzzy C-Means (FCM) is a method of clustering which allows one piece of data to belong to two or more clusters. This method (developed by Dunn in 1973 [1] and improved by Bezdek in 1981[2]) is frequently used in pattern recognition. It also has been in image analysis processes such as segmentation [3].
Clustering involves the task of dividing data points into homogeneous classes or clusters so that items in the same class are as similar as possible and items in different classes are as dissimilar as possible. Clustering can also be thought of as a form of data compression, where a large number of samples are converted into a small number of representative prototypes or clusters. Depending on the data and the application, different types of similarity measures may be used to identify classes, where the similarity measure controls how the clusters are formed. Some examples of values that can be used as similarity measures include distance, connectivity, and intensity.
In non-fuzzy or hard clustering, data is divided into crisp clusters, where each data point belongs to exactly one cluster. In fuzzy clustering, the data points can belong to more than one cluster, and associated with each of the points are membership grades that indicate the degree to which the data points belong to the different clusters.
However, one disadvantage of standard FCM is not to consider any spatial information in image context, which makes it very sensitive to noise and other imaging artifacts. Recently, many researchers have incorporated local spatial information into the original FCM algorithm to improve the performance of image segmentation [8]. Some research developed a Sugeno-type rule-based system that imposed spatial constraints in order to enhance the results of fuzzy clustering.
Volume 45– No.3, May 2012 In this paper we present a relational Fuzzy C-Means
algorithm built around the Fuzzy C-Means algorithm. The proposed algorithm focuses on the solution of over and under segmentation problem of low contrast images by applying preprocessing on the input image. The algorithm will be applied here on 2D gel images and can also be applied to any type of images.
This paper is organized as follows. This section gives the introduction to the area of interest of the research then the basics of the Fuzzy C-Means algorithm and the fuzzy relation are introduced in section 2. The details of the proposed algorithm are given in section 3. The idea of fuzzification of parameter β is discussed in section 4. In section 5, the algorithm parameters are obtained experimentally. Section 6 gives the simulation results and discusses them. Section 7 concludes the work done in this paper. Finally a list of references is given.
2. FUZZY C-MEANS and FUZZY
RELATIONS
Fuzzy clustering belongs to the group of soft computing techniques (which include neural nets, fuzzy systems, and genetic algorithms). In real applications there is very often no sharp boundary between clusters so that fuzzy clustering is often better suited for the data. Membership degrees between zero and one are used in fuzzy clustering instead of crisp assignments of the data to clusters.
The resulting data partition improves data understanding and reveals its internal structure. Partition clustering algorithms divide up a data set into clusters or classes, where similar data objects are assigned to the same cluster whereas dissimilar data objects should belong to different clusters. The detection of special geometrical shapes like circles and ellipses can be achieved by so-called shell clustering algorithms [5,8].
Using this way of clustering in image segmentation, we will have a three-dimensional feature space, in which each pixel of the image (pi ) will be represented by its x and y coordinates and its luminance l:
T i i i
i x y l
p ( )
where: x [0...W1]
i ; W is the image width;
y [0...H 1]
i ; H is the image height;
[0... 1]
max
L
li ; Lmaxis the maximum
luminance level, e.g. 256.
All the three components of the feature vector have integer values. Thus, for the WH sized image, the dataset to be partitioned is P ={p1, p2, …, pWH}.
This dataset will form the universe of discourse, to be partitioned in C classes. In our particular application, although the classes are background and spots, sometimes is more advantageous to partition the spots into two regions (to ensure their convexity) which leads to a number of C=3 classes instead of C=2.
The partition matrix containing the membership degrees to the C classes (C=2 or C=3), U=
u
ijof sizeH W
C , and the set of class centers, V ={
c
v
v
1,...,
}, result finally as output of the Fuzzy C-means algorithm. Here, each vi is a vector of threecomponents vi = (vxi vyi vii)T comprising an x
coordinate, y coordinate and a luminance value.
The partition matrix should satisfy the same constraints as in standard Fuzzy C-means. With the use of the Euclidean distance, the cost function to be minimized becomes:
m c x u J N i C j j j m ijm ,1
2
1 1
(1)
where m is any real number greater than 1, uij is the
degree of membership of xi in the cluster j, xi is the ith of
d-dimensional measured data, cj is the d-dimension center
of the cluster, and ||*|| is any norm expressing the similarity between any measured data and the center.
In the standard use of Fuzzy C-means, the weighting coefficient (m) is to set to m=2. The FCM algorithm runs iteratively in the following steps:
Step 1: Initialize U=[
u
ij] matrix, U(0) Step 2: At k-step: calculate the centers vectors C(k)=[c
j] with U(k)
1 1 . i m ij N i i m ij j u x u c (2)Step 3: Update U(k) , U(k+1)
C k m R j j i ij c x c x u 1 1 2 1 (3)Step 4: If || U(k+1) - U(k)||< threshold then STOP;
otherwise return to step 2.
Remark: the computation of the updated membership function is the condition for the minimization of the objective function. With Fuzzy C-Means, the centroid of a cluster is computed as being the mean of all points, weighted by their degree of belonging to the cluster. The degree of being in a certain cluster is related to the inverse of the distance to the cluster. By iteratively updating the cluster centers and the membership grades for each data point, FCM iteratively moves the cluster centers to the "right" location within a data set.
A classical relation can be considered as a set of tuples, where a tuple is an ordered pair. A binary tuple is denoted by (u, v), an example of a ternary tuple is (u, v,w) and an example of n-ary tuple is (x1, . . . , xn).As an demonstrating example, let X be the domain of man {John, Charles, James} and Y the domain of women {Diana, Rita, Eva}, then the relation‖married to‖ on X
Y is, for example {(Charles, Diana), (John, Eva), (James, Rita)}.Let R be a binary relation in X
Y. Then the characteristic function of R is defined as:otherwise R v u if v u xR ) , ( 0 1 ) , (
Volume 45– No.3, May 2012 X. A fuzzy relation R is a relation measures the degree by
which x is related to y.
Let R be a binary fuzzy relation on R. Then R(u, v) is interpreted as the degree of membership of the ordered pair (u, v) in R.
As a demonstrating example, let R be a binary fuzzy relation on U = {1, 2, 3}, called ‖approximately equal‖ can be defined as:
R(1, 1) = R(2, 2) = R(3,3) = 1
R(1, 2) = R(2, 1) = R(2, 3) = R(3,2) = 0.8 R(1, 3) = R(3,1) = 0.3
The membership function of R is given by:
R(u, v) =
| v -u | if 0.3
| v -| if 0.8
v u if 1
u
3. THE PROPOSED RELATIONAL
FUZZY C-MEANS ALGORITHM
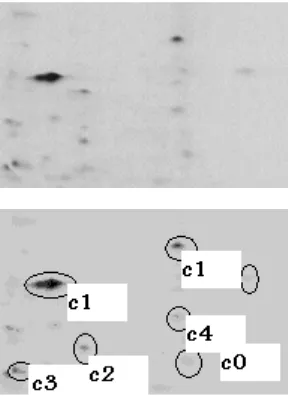
[image:3.595.123.268.364.562.2]In the proposed algorithm, we will modify the FCM algorithm [1,2] by first setting the number of clusters (C) to more than two clusters. This setting is intended so as not to ignore the detection of the lighten protein spots from the background. A simple application of such assumption is shown in Figure 1. From the figure, we can observe that even the lighten Protein spots were detected at cluster C4.
Figure 1: Part of 2-D Gel Electrophoresis image when C=6
However, this is not sufficient to detect proteins spots and quantify them. A more robust method must exist to differentiate protein spots from the background varying gel rather than increasing the number of clusters only. This reveals the need of introducing the notion of fuzzy relations into the FCM algorithm which will be the second modification of the algorithm. We called the proposed algorithm the Relational Fuzzy C-means as it builds on the traditional Fuzzy C-Means algorithm but modifies it by introducing the notion of fuzzy relations to it in order to differentiate spot pixels from the varying background.
The RFCM algorithm is composed of 4 steps where the first step of it to apply the FCM to the image to produce preliminary clusters where number of clusters is greater than two as discussed above. Then these clusters
are then internally refined to identify the inner spots by separating the background pixel from the contained pixel in the cluster by applying steps 2 to 4 of the proposed algorithm on the clusters. A summary of the steps of the proposed algorithm is given below.
In step 2 of the RFCM algorithm, R(x,y) represents the degree of closeness between intensities of pixels x and y . In step 3, gv represents the gray value of the corresponding pixel x or y. In step 4, the marking of spots
is performed by assigning the spot pixels to the maximum value of centers of clusters and the background -non spot pixels- to the minimum value of centers of clusters.
Figure 2 shows a representation of a fuzzy relation, R(x,y), between two points (x,y) in two different clusters: Cluster1 and Cluster2. The arrows represent the degree of closeness between two pixels from different clusters. The dark arrow marks a strong closeness between the two pixels while the light arrow marks a weak closeness. The proposed algorithm with the above added features has the following advantages:
1. It handles the problem of the missing value.
2. The number of spots detected in the image is increased by increasing the number of clusters to which the pixels in the image must be partitioned in the original Fuzzy C-means algorithm.
3. The problem of the collected protein spots in the same area will be solved since we search for luminance in the image- degree of level intensity. In this case, the quantification of protein spots will be much easier.
Algorithm RFCM
RelationalFuzzyCMeans (Original image, No of clusters, Beta)
Input: Original image, No of clusters,
Output: Segmented image
1:Apply the FCM algorithm with C > 2
The output is the partitioning of image pixels into C
clusters, each having a center value v.
2: For each two pixels x, y belonging to two different
clusters,
Create a Fuzzy Relation between x and y: R(x,y)=
absolute (gv(x)- gv (y));
3: if absolute R(x, y ) >
thenpixel representing max((gv(x), gv(y )) is a spot
pixel
end if
4: Mark spot pixels and differentiate them from the
Volume 45– No.3, May 2012
Figure 2: Representation of the fuzzy relation between pixels in two clusters.
4. In the proposed algorithm, we don't care about the neighborhood pixels when investigating the pixel if it is a spot pixel or not. This means that even very small spots can be detected.
5. However, the performance of the proposed RFCM algorithm relies on two main parameters which are: C= number of clusters and β = degree of closeness between the two pixels. Both values will be selected by software in the following sections before using the proposed algorithm.
4. FUZZIFICATION OF PARAMETER
(
)
The determination of the proper value of the parameter (β) that represents the threshold between the difference of the two pixels in different clusters is very important and critical to the performance of the algorithm. In order to estimate it, we used the trapezoidal fuzzy function shown in Figure 3.
To illustrate the need for such function, let k represents the absolute difference between the two pixels x and y. If k is high, then max(x,y) is a spot pixel. While if k is low and one of them is a spot pixel, then the other is a spot pixel. Now the objective is to define the membership functions low and high of this function.
The membership function low will be defined by four points: (x0, x1, x2, x4). However, in order to have a real trapezoid, we need a four point at the left of x1 (any negative one, e.g x0) following the same reasoning, the MF high will be defined by four points: (x3, x5, x6, x7) (x7 any positive > x6, being x6 the higher possible value for x). In case when the membership function is trapezoid (or pseudo-trapezoid which in this case will be ‗low‘ and ‗high‘), the membership function can be defined as:
max min ,1, ,0 ) , , , ; ( 2 4 4 0 1 0 4 2 1 0 x x x x x x x x x x x x x
ylow (4)
max min ,1, ,0 ) , , , ; ( 6 7 7 3 5 3 7 6 5 3 x x x x x x x x x x x x x
yhigh (5)
Figure 3: Sample of membership functions
5. CHOICE OF ALGORITHM
PARAMETERS
We have two parameters that affect the performance of the algorithm which are: number of clusters (C) and degree of closeness between the two pixels β. Both values will be computed experimentally. We will use a case study for data of human leukemia [10] to obtain these values.
5.1 Choice of (β)
In order to determine the value of β, we performed the simulation on the data sample with variable values of both C and β as shown in Figure 4 and Table 1. The quality of the algorithm under these values was evaluated using the error metric Eintra [7,9], which represents the proportion of misclassified pixels in an image or called the intra-region color error. A misclassified pixel is defined as a pixel whose color error (in L*a*b space) between its original color and the average color of its region is higher than a pre-defined threshold. Eintra is computed by [7,9]:
I I
p Lab
s x o x tra in S TH p C p C
E
( ( ) ( ) ** ) . (6)
where Cox(p) and Csx(p) are pixel feature value(color components in CIE L*a*b space) for pixel p on original and segmented image, respectively, TH is the threshold to judge significant difference, and μ(t) = 1 when t > 0, otherwise μ(t) = 0.
Figure 1 shows the 2D gel electrophoresis image of sample of Patient- Human Leukemia and the segemented image at different values of C and β. For each of these images , we computed the Eintra as shown in Table 1 and drawn in 3D chart in Figure 5.
From these results, we can choose the proper values of β used in the membership function, shown in Figure 3, as follows:
when 19,27, the error (Eintra) is high, while
when β is in the range from 20 to 24, the error is low. So, the proper value of β can be taken between 20 and 24.
High
Low
6
x
x
5 [image:4.595.328.507.66.215.2]Volume 45– No.3, May 2012
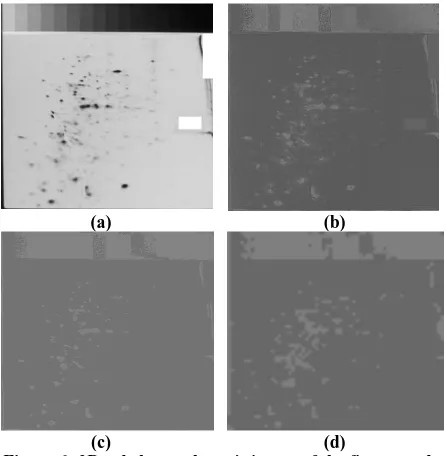
Figure 4: 2D gel electrophoresis image of sample of Patient- Human Leukemia (a) Original image, (b) Gradient image, (c) Gradient image after applying FCM when C=2, (d) when C=6 ,20, (e) when C=8 ,20, (f) when C=10 ,20, (g) when C=6 ,
19, (h) when C=6 ,
21, (i) when C=6 , 22, (j) when C=6 , 23, (k)when C=6 , 24, (l) when C=6 , 27
[image:5.595.94.284.443.742.2]
Table 1: The intra region error (Eintra) at different values of RFCM parameters C and β
Test Case
no. RFCM Parameters Eintra
1 C=6, β =20 0.9824
2 C=8, β =20 0.1067
3 C=10, β =20 0.137
4 C=6, β =19 0.7329
5 C=6, β =21 0.1662
6 C=6, β =22 0.1423
7 C=6, β =23 0.2445
8 C=6, β =24 0.2297
9 C=6, β =27 0.9145
Figure 5: The intra region error (Eintra) at different values of RFCM parameters C and β
5.2 Choice of (C)
Taking β= 20, the choice of parameter C which represents the number of clusters is the second step. We used seven data samples of 2D gel images and appled the RFCM algorithm using different values of C and at β= 20. We computed the % improvement encountered in each case for C between (4-10). Two numerical measures were used: Eintra and Einter. The Einter is given by [7,9]:
Einter (7)
where wij denotes the jointed length between Ri and
Rj, TH is the threshold to judge significant difference,
and Z is a normalization factor. SI is the number of
[image:5.595.322.518.627.716.2]data samples in the image
Table 2: The degree of improvement of the RFCM algorithm for different values of C on seven data
samples
Number of Clusters
(C)
Eintra Improvement
(%)
Einter Improvement
(%)
4 71% 100%
6 57% 42%
8 100% 100%
10 100% 100%
The results are shown in Table 2. From these results, we can see that the values C=8 and C=10 give improvement for all seven cases under investigation in both Eintra and Einter. However, C=8 is better than
N
i N
i j j
I ij b a L s x o
x p C p w S Z
C TH
1 1, **
Volume 45– No.3, May 2012
C=10 in the terms of the execution time and complexity of the algorithm. So, the proper value of the number of clusters is 8.
6. SIMULATION RESULTS
In this section, we aim to evaluate the performance of the proposed algorithm against the Fuzzy C-Means. We will use seven data sample chosen from the data set for Human leukemias (Eric Lester, Peter Lemkin), HL-60 cell lines (Eric Lester, Peter Lemkin) and Fetal alcohol syndrome (FAS) - serum (James Myrick, Mary Robinson, Peter Lemkin) in [10] to show the effectiveness of the proposed algorithm.
We will use two different methods to judge the performance of the algorithm: the visual acceptance of the segmented image and the numerical measures that compute both over and under-segmentation error. Figure 6 shows the results of applying the Fuzzy C-Means segmentation algorithm on one of these images (2D gel electrophoresis image of the first sample of Patient- Human leukemias) at C=2, and the results of applying the proposed Relational Fuzzy C-Means (RFCM) segmentation algorithm on at C = 8 and β= 20, for illustration.
(a) (b)
[image:6.595.319.520.129.435.2]
(c) (d)
Figure 6: 2D gel electrophoresis image of the first sample of Patient- Human leukemias (a) Original image, (b) Gradient image, (c) Gradient image after applying FCM
segmentation algorithm, and (d) Gradient image after RFCM segmentation algorithm
From figure 6, visually we can see that the segmented image using the proposed RFCM algorithm (Figure 6 (d)) is much clearer and the spots in the original image (Figure 6 (a)) were detected much accurate; even the light spots in the image appeared. While in Figure 6 (c) when applying the FCM algorithm, those light protein spots disappeared totally which affects the spot quantization step.
However, the visual acceptance is not enough thus we will use the both Einter (which evaluates the over-segmentation error) and the Eintra (which evaluates the under-segmentation error) to evaluate the performance of the proposed algorithm the relational Fuzzy C-Means algorithm (RFCM) versus the Fuzzy C-means algorithm (FCM). We set the
threshold TH = 10 and the normalization factor Z = 100. The results are summarized in Figures 7 and 8.
Figure 7: The intra region error (Eintra) of the FCM algorithm andthe RFCM algorithm on the
seven data samples
Figure 8: The inter region error (Einter) of the FCM algorithm and the RFCM algorithm on the
seven data samples
From the results obtained, we found out that for the Eintra evaluation metric (which evaluates the under-segmentation error), the RFCM algorithm enhanced the results on the 7 data samples (100% of the samples). However, the % of improvement varies from one case to the other. The minimum improvement was in data sample 3 where the intra region error decreases by 71.6%. The maximum improvement was achieved in two data sample which are 2 and 4 where the Eintra was improved by (90.6%) and (83.8%) respectively.
According to the Einter evaluation metric (which evaluates the over-segmentation error), the RFCM algorithm enhanced the results on the 7 data samples (100% of the samples). The error was eliminated totally (i.e. =0) in 3 of the 7 data samples and was improved in the other 4 cases with average improvement of 98%.
We can also observe that in the first five data samples which are data for the human leukemia and human blood lymphocytes where exist the problems of ghost (weak) spots and noisy background, the proposed RFCM algorithm, compared to the original algorithm, succeeded in reducing the problem of under-segmentation and identifying weak spots as in all data samples.
0 0.2 0.4 0.6 0.8 1 1.2
1 2 3 4 5 6 7
Ei
n
tr
a
Data sample
FCM
RFCM
0 0.05 0.1 0.15 0.2 0.25 0.3
1 2 3 4 5 6 7
Ei
n
te
r
Data sample
FCM
[image:6.595.82.305.322.550.2]Volume 45– No.3, May 2012
For the last two data samples, which are the Fetal Alcohol Syndrome, where exist the problems of contamination of gels and overlapped spots, the proposed RFCM algorithm, compared to the F C-Means algorithm, succeeded in reducing the problem of under-segmentation and identifying the overlapped spots.
7. CONCLUSION
The Fuzzy C-Means algorithm has been used in many applications such as: data analysis, pattern recognition, and image segmentation. It has the advantages of producing high quality segmentation compared to the other available algorithms. Segmentation of 2D gel images is very important as it is used by experts to decide whether the patient has health problems or not and thus the proper treatment.
The proposed work in this paper, the Relational Fuzzy C-Means segmentation algorithm, adds the notion of fuzzy relations to Fuzzy C-Means algorithm to enhance its performance especially in the area of 2D gel images. The previous algorithms have the problem of either over or under segmentation. We aim to overcome both problems by the proposed algorithm.
Two parameters of the proposed algorithm, which are the number of clusters and the degree of closeness, were experimentally chosen. Comparing the proposed algorithm to the Fuzzy C-Means algorithm on different data sample using both visual and numerical measures indicated the improvement occurred due to the modification. Both the over and under-segmentation errors were minimized with high percentage that reached 100%.
8.
REFERENCES
[1] J. C. Dunn, "A Fuzzy Relative of the ISODATA Process and Its Use in Detecting Compact Well-Separated Clusters", Journal of Cybernetics 3: 32-57, 1973.
[2] J. C. Bezdek, "Pattern Recognition with Fuzzy Objective Function Algorithms", Plenum Press, New York, 1981.
[3] Mihaela Gordan, Constantine Kotropoulos, Apostolos Georgakis, Ioannis Pitas," A New Fuzzy C-Means Based Segmentation Strategy Applications to Lip Region Identification", 2002 IEEE-TTTC International Conference on Automation, Quality and Testing, Robotics, Cluj-Napoca, Romania, May 23-25, 2002.
[4] Meyer, F., "Topographic distance and watershed lines", Signal Process. 38, 113–125, 1994. [5] B. Macgibbon and M. Preus, ―The Distorted Shell
Method of Clustering for Syndrome Classification,‖ Am J Hum Genet 31:498- 507, 1979.
[6] Malik Sikandar, Hayat Khiyal, Aihab Khan, Amna Bibi and Fatima Jinnah, "Modified Watershed Algorithm for Segmentation of 2D Images," Issues in Informing Science and Information Technology Volume 6, 2009. [7] S. Chabrier, B. Emile, H. Laurent, C.
Rosenberger, and P. Marche, ―Unsupervised evaluation of image segmentation application to multispectral images,‖ Proc. of the 17th
international conference on pattern recognition, 2004.
[8] Weiling Cai, Songcan Chen, Daoqiang Zhang, ―Fast and Robust Fuzzy C-Means Clustering Algorithms Incorporating Local Information for Image Segmentation,‖ Pattern Recognition, Vol. 40, 825—838, 2007.
[9] Hui Zhang, Jason E. Fritts, and Sally A. Goldman,