Study on Associative Relationship Impact on Water
Quality Index Attributes
Anni Prabakaran
Research Scholar
Mother Teresa Women’s University Kodaikanel, South India
B. Poorna,
PhD. PrincipalSSS Shasun Jain College for Women Chennai, South India
ABSTRACT
The computational approach is adopted and customized, as per the demand and requirement of scientific applications. The computational process is used for weather forecasting, land change detection and many more environmental applications. The Water Quality Index (WQI) computations are a process to determine the level of water in line to the purity determination and water sharing and utilization process. The WQI determination processes depend on the combinational factors of physical, chemical and biological attributes. The WQI attributes are identified and the computation is made on the selected variables to identify the dependency and association factors. The associative relationship impact on WQI computation process is derived and executed with the observed data and the result is presented in this paper.
General Terms
Data Mining, Geographical Information System, Water Quality Rating.
Keywords
Associative Relationship, Computational Standards of WQI, WQI attribute Analysis.
1.
INTRODUCTION
The modern computing process influenced all the global applications for accuracy and predictions. The global forecasting process is achieved by observing and analyzing the Geographical Information System (GIS) data. GIS applications cover weather forecasting, mapping, location identification and climatic changes etc. The GIS outcomes are arrived in two approaches namely descriptive and predictive. In descriptive approach, the observed data is analyzed and represented. In predictive approach, the future changes are predicted from the observed data. The major process of GIS is to handle a large volume of geographical data for decision support as well as prediction. Analysis of reasonably large volume of data sets is normally processed with the help of data mining techniques. This approach is normally used to analyze and determine the factors based on the domain applications. This paper intends to identify the relationship between the Water Quality Index (WQI) attributes and its impact.
The calculations involved in characteristic analysis process and forecasting applications are carried out using the GIS tool; the calculation procedures are predefined and template-based. The GIS analysis does not take the domain and external factors into account. Therefore, the predictions are unable to address all the factors related to the domain such as temperature variations in cultivation, water, minerals
combinations etc. The observable level of data is also predefined. Therefore, the researcher determined the associative computational impact on the WQI that pollutes the environment leading to changes in the geographical structure. As part of this research, the work is defined with the following specific scope and objectives.
2.
SCOPE AND OBJECTIVES
The study identifies the associative relationship of one water quality attribute with another and its influence on WQI computation. The observed water quality attribute differs with respect to nature of soil in water resources. But the relationship factors are un-deterministic [6]. The physical, chemical and biological attributes ensures the purity level of the water. This combination of attributes and its impact on WQI are considered for further analysis. To obtain this, the fundamental factors of WQI and its computational methodology are illustrated. The data taken from different areas in South India are analyzed.
Different researcher’s that are along the same line of this study are briefly mentioned below.
3.
REVIEW OF LITERATURE
Computational methods are used to represent and present the data and to predict the knowledge from the data set. The computing techniques are applied to increase the efficiency of applications in all businesses and other domains. Its impact ranges from a man’s day to day activities like communication, computation, transport and business to a high-end space research. Various researchers have identified effective computational methods to control air, water and land pollutions to provide a safe environment. The computational accuracy aids to control pollution by taking necessary actions. The computational values give caution to the society and to sustain the environment. Therefore, the researcher detects the computational methodology and converts the computational approach to a better descriptive analysis. Before discussing, the computational complexity of water quality index, the basics of WQI and relational attributes are described below. The water quality assessment model is derived from multiple approaches with different computational models such as graphical, statistical and data mining techniques. In statistical model [8], variance analysis, regression, correlation, time series and test are applied. The support vector machine (SVM) [10], neural network [3], classification and clustering approaches are used in the data mining techniques.
values are compared with the standard values [11]. The various combinations of physical, chemical and biological properties are considered for computing the WQI. The obtained WQI and the results are used to map physical attribute changes using approximation method.
Kant & Vohra [4] have rightly observed that the arrangement of any aquatic ecosystem must deal conservation of fresh water habitat with an intention to maintain water quality or to rehabilitate the physical, chemical and biological quality of water.
A graphical method was used to simplify the WQI computation [2] considering the parameters Dissolved Oxygen (DO), Biological Oxygen Demand (BOD), Chemical Oxygen Demand (COD), Ammoniocal Nitrogen (AN), Suspended Solid (SS) and pH. The graphical method is useful for calculating WQI without a computer or any complex equations. There was a good agreement between the conventional and the graphical method.
The Neural Network model, used to estimate WQI in the Langat River Basin, Malaysia [3] showed that it is possible to reduce the number of parameters in predicting water quality without much loss of information in the DO, BOD, SS, AN, COD and pH components. The parameters COD and pH are showing very less variance and can be omitted.
The Régression model [8] has been used for predicting water quality parameters and for computing the WQI in the study area Tumkur Amanikere watershed, Karnataka. The experimental result shows physical, chemical and biological analysis of water. Samples of 16 parameters from the watershed were taken; eight parameters namely iron, nitrate, TDS, hardness, fluoride, bicarbonate, magnesium, and manganese showed higher values and the WQI values also increased accordingly.
The Bhargava method of computing WQI [5] was applied with the parameters of DO, BOD, MPN, Turbidity, TDS and pH. As per his findings, the maximum probable number (MPN) value exceeded the tolerable limit and observed that the main cause of deterioration in water quality was due to the lack of proper sanitation, unprotected river sites, high anthropogenic activities and direct discharge of industrial effluent.
The research works are implemented in different models such as neural network, machine learning etc. An optimal neural network model [8] was developed based on the two optimization algorithm namely Akaike’s Information Criterion and Golden Section Optimization [1] and obtained better result in optimal Neural Network Model. As a result, the model is less expensive in terms of cost and/or money and very few parameters were used namely total dissolved solids (TDS) and electrical conductivity (EC). Extensive computational work was carried out for comparing the models.
Most of the attributes accounted for WQI computing are similar and modified with the existing parameters. The observation ends with the option to continue the research to determine the associative relationship of water quality attributes because the WQI computation is not similar. The physical, chemical and biological attributes namely the pH, turbidity, specific conductance, total alkalinity, total hardness, chloride, sulphate, dissolved oxygen (DO) and faecal coliform bacteria have been taken into account for mapping the relationship with water quality index.
4.
COMPUTATIONAL PRINCIPLES OF
WQI
The computation process is generalized for all processes based on the input, process and output. The same computational approach is adopted to calculate the WQI. In this adaptation, the WQI attributes are assigned with the weight values as per the Table – 1 reference.
Table 1. Attributes and its weight values
Attributes/
Parameters (units) Standards Weights
Unit Weight Wi
pH 7.0 – 8.5 4 0.16
Turbidity 5 4 0.16
Specific
Conductance 40 2 0.08
Total Alkalinity 120 3 0.12
Total Hardness 100 – 500 2 0.08
Chloride 201 – 600 2 0.08
Sulphate 200 – 400 1 0.04
Dissolved Oxygen 6 4 0.16
Faecal Coliform 1 3 0.12
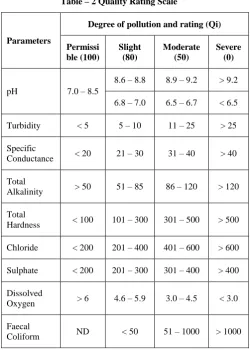
[image:2.595.309.560.395.746.2]The Quality Rating Scale (Qi) is the relative reference value of each observed attributes standard value presented in Table-2.
Table – 2 Quality Rating Scale
Parameters
Degree of pollution and rating (Qi)
Permissi ble (100)
Slight (80)
Moderate (50)
Severe (0)
pH 7.0 – 8.5
8.6 – 8.8 8.9 – 9.2 > 9.2
6.8 – 7.0 6.5 – 6.7 < 6.5
Turbidity < 5 5 – 10 11 – 25 > 25
Specific
Conductance < 20 21 – 30 31 – 40 > 40
Total
Alkalinity > 50 51 – 85 86 – 120 > 120
Total
Hardness < 100 101 – 300 301 – 500 > 500
Chloride < 200 201 – 400 401 – 600 > 600
Sulphate < 200 201 – 300 301 – 400 > 400
Dissolved
Oxygen > 6 4.6 – 5.9 3.0 – 4.5 < 3.0
Faecal
Wi is the weightage value of the WQI attributes. The Qi * Wi produced the WQI values which leads the water quality attribute level determination. Water quality refers to the composition of physical, chemical, and biological attributes ratio in the water. Evaluation of water quality attributes are assisting to understand the component level mix and its utilization. In order to identify the component which influences the water quality, the attribute analysis is designed and implemented.
WQI [9] numerically summarizes the information from multiple water quality attributes into a single value. WQI value is an indication of purity level of water quality is relative to one parameter. (100 – Very Good, 50 – Medium, 0 – Very bad).
The WQI value can be used to compare the water distinctiveness from several sites. It can be used to look at trends over time on a single site. WQI is calculated using the formula given below.
where ‘n’ refers to the number of parameters. Qi value is the indication of water quality relative to 100 of one parameter.
Wi is the weighting factor sets the relative importance of the attributes to overall water quality. Water Quality Range and Rating was used for the classification based on the five classes of water quality stated in Table – 3.
Table – 3 Water Quality Range and Rating
WQI Range Water Quality Rating
90 – 100 Excellent
70 – 89 Good
50 – 69 Medium
25 – 49 Bad
0 – 24 Very Bad
There are some hidden factors involved in the WQI calculation. Different weights are assigned to calculate the WQI in different measures due to the soil nature. The attributes are same but the weights are differing. This issue creates the complexity of WQI computation, therefore the researcher attempted to identify the associative relational factors rather than to determine the WQI impacts. The data observation, analysis and its associative relationship are discussed below.
4.1
Data Source
The water system is classified as lentic and lotic system. Lentic systems are those which contain stagnant water or closed system. Lotic systems are those systems which contain flowing waters. The current work was carried out in the lentic systems. The properties of lentic system and the various
attributes considered are pH, turbidity, specific conductance, total alkalinity, total hardness, chloride, sulphate, dissolved oxygen (DO) and faecal coliform bacteria.
Data has been taken from the doctoral thesis of Mohanraj Ebenezer [6], the four lentic systems of Tirunelveli and Tuticorin districts. The researcher adopts the common water resources classification of lentic and lotic. The data observed from four lentic systems are below. Station I (SI) is the Udayarpatty Brathy pond which is situated in the heart of Tirunelveli Corporation and subjected to a high degree of modification due to local conditions. The area of the pond is about 1.5 acres.
Station II is the Marthandeswar pond which is situated in a nearby village called Karungulam. It covers an area of 54 ha and 33 acres. Station III is a rocky pool, which the public is prohibited to use. It covers an area of 15 cents. Station IV is a large rocky pool and it covers an area of about 49 cents. The physical, chemical and biological attributes pH, turbidity, specific conductance, total alkalinity, total hardness, chloride, sulphate, dissolved oxygen (DO) and faecal coliform bacteria were observed for two year period 1998 to 1999 for every month.
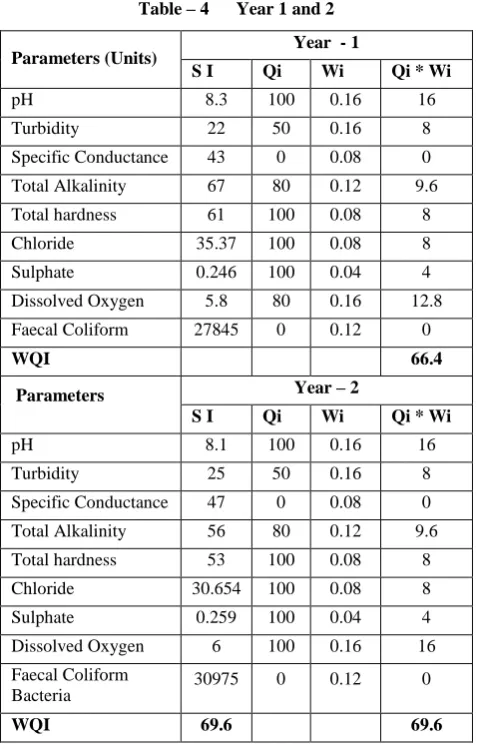
[image:3.595.310.549.387.762.2]As per the data collection description, the source data is collected from four locations for two years with four seasons. The SI shows the corresponding observed data of the station I. As a sample, first station data (SI) table-4 is presented below along with the attributes and calculated WQI as per the above specified formula.
Table – 4 Year 1 and 2
Parameters (Units) Year - 1
S I Qi Wi Qi * Wi
pH 8.3 100 0.16 16
Turbidity 22 50 0.16 8
Specific Conductance 43 0 0.08 0
Total Alkalinity 67 80 0.12 9.6
Total hardness 61 100 0.08 8
Chloride 35.37 100 0.08 8
Sulphate 0.246 100 0.04 4
Dissolved Oxygen 5.8 80 0.16 12.8
Faecal Coliform 27845 0 0.12 0
WQI 66.4
Parameters Year – 2
S I Qi Wi Qi * Wi
pH 8.1 100 0.16 16
Turbidity 25 50 0.16 8
Specific Conductance 47 0 0.08 0
Total Alkalinity 56 80 0.12 9.6
Total hardness 53 100 0.08 8
Chloride 30.654 100 0.08 8
Sulphate 0.259 100 0.04 4
Dissolved Oxygen 6 100 0.16 16
Faecal Coliform Bacteria
30975 0 0.12 0
The stations WQI attributes of pH, Turbidity (NTU), Specific Conductance (mS/cm),Total Alkalinity (mg/l),Total hardness (mg/l), Chloride (mg/l), Sulphate (mg/l), Dissolved Oxygen (mg/l) and Faecal Coliform Bacteria are considered for the computation. The computational results are discussed below with all possible results.
4.2 Data Preprocessing
In the observed data, in station I and II there was no water during the month of June therefore the data has been removed. The impacts of the various physical, chemical and biological attributes on water are described below.
pH is a measure of hydrogen ion activity which is used to express the intensity of acidic or alkaline condition of a solution. It is also important in water analysis since it enters into the calculation of acidity, alkalinity and processes like coagulation, disinfection and corrosion control.
Turbidity is a principal physical characteristic of water and is an expression of the optical property that causes light to be scattered and absorbed by particles and molecules rather than transmitted in straight lines through a water sample. Turbidity is a measure of the degree to which the water loses its transparency due to the presence of suspended particulates. Specific conductance is a measure of the ability of water to carry an electric current. Generally, rainwater has a very low conductivity. However, as runoff flows through a watershed, the slightly acidic nature of rainwater can release ions (negatively or positively charged particles) from soil and rock which dissolve in water and increase specific conductance. These ions are commonly referred to as inorganic salts. The concentration of these salts or salinity can differ from one watershed to another depending upon the parent rock of the drainage basin. The most common inorganic salts include calcium, magnesium, sodium, potassium, bicarbonate, carbonate, sulfate, and chloride. Specific conductance is often used as a way to indirectly measure the salinity of water. Total alkalinity is the total concentration of bases. These bases are usually bicarbonates (HCO3) and carbonates (CO3), and they act as a buffer system that prevents drastic changes in pH. For example, in waters with low alkalinity, pH might fluctuate from 6 or lower to as high as 10 or above; while in high alkalinity waters, pH might fluctuate from about 7.5 to 8.5.
Total hardness of water is water that contains high levels of dissolved calcium, magnesium, and other mineral salts such as iron. The greater the amount of dissolved minerals in the water, the harder it is. Total hardness is measured in grains per gallon (gpg) or parts per million (ppm). If water contains less than 3.5 gpg, it is considered soft water. If it contains more than 7 gpg, it is considered hard water.
Chloride is one of the major anions found in water and are generally combined with calcium, magnesium or sodium.
Sulphate is a naturally occurring substance that contains sulphur and oxygen. It is present in various mineral salts that are found in soil. Sulphate may be leached from the soil and is commonly found in most water supplies. Magnesium, potassium and sodium sulphate salts are all soluble in water. Calcium and barium sulphates are not very easily dissolved in water. Decaying plant and animal matter may release sulphate into water. Numerous chemical products including ammonium sulphate fertilizers contain sulphate in a variety of forms. The treatment of water with aluminum sulphate (alum)
or copper sulphate also introduces sulphate into a water supply. Human activities such as the combustion of fossil fuels and sour gas processing release sulphur oxides to the atmosphere, some of which is converted to sulphate. Sulphate is generally considered to be non-toxic. The consumption of drinking water containing high amounts of magnesium or sodium sulphate may result in intestinal discomfort, diarrhea and consequently dehydration.
DO is the fundamental requirement for the maintenance of life of all living organisms in water. A water body is said to be polluted when the DO level falls below a certain minimal concentration necessary for sustaining a normal biota for that water. Oxygen demanding substances can remove large amounts of DO from water, causes changing in their flora and fauna.
Total coliform bacteria are a collection of relatively harmless microorganisms that live in large numbers in the intestines of man and warm and cold blooded animals. They aid in the digestion of food. A specific subgroup of this collection is the fecal coliform bacteria, the most common member being Escherichia coli. These organisms may be separated from the total coliform group by their ability to grow at elevated temperatures and are associated only with the faecal material of warm-blooded animals.
The presence of faecal coliform bacteria in aquatic environments indicates that the water has been contaminated with the fecal material of man or other animals. At the time this occurred, the source water may have been contaminated by pathogens or disease producing bacteria or viruses which can also exist in fecal material. The presence of fecal contamination is an indicator that a potential health risk exists for individuals exposed to this water. Faecal coliform bacteria may occur in ambient water as a result of the overflow of domestic sewage or nonpoint sources of human and animal waste.
The water quality attributes are differing from station to station. The attribute values are expected to lie within the range of standards [11].
4.3
Observation
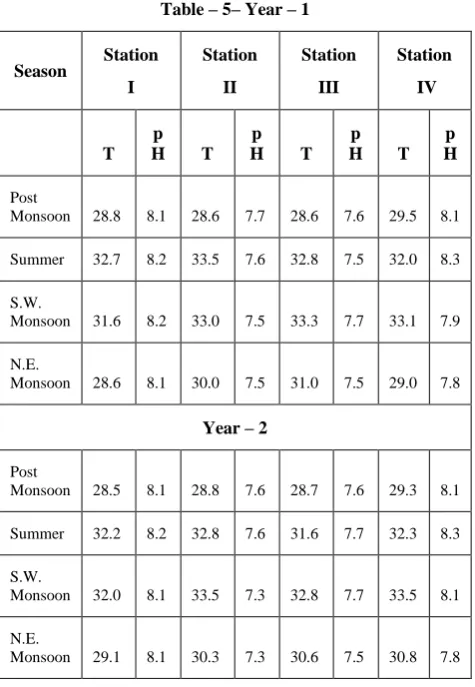
The observed data of four stations and four seasons for two years of pH and temperature are listed in table-5. As per the observation of the comparative graph generated for difference of pH with temperature for the four stations produced shows similar impact.
The first three months of the year, temperature slowly increased and crossed the pH intermediate value. The second season also showed the increase of temperature and reaches its maximum over the period of six months. The next half of the year, the values are decreased and reached near to the initial observed value. This value is the starting value of the second year observation. The variations look similar in the second year.
The station I temperature is increased from 28 C to 31.6 C from the Post Monsoon to South West Monson and it decreased to 28.6 C in the North East monsoon.
Table – 5– Year – 1
Season Station
I
Station
II
Station
III
Station
IV
T p
H T
p
H T
p
H T
p H
Post
Monsoon 28.8 8.1 28.6 7.7 28.6 7.6 29.5 8.1
Summer 32.7 8.2 33.5 7.6 32.8 7.5 32.0 8.3
S.W.
Monsoon 31.6 8.2 33.0 7.5 33.3 7.7 33.1 7.9
N.E.
Monsoon 28.6 8.1 30.0 7.5 31.0 7.5 29.0 7.8
Year – 2
Post
Monsoon 28.5 8.1 28.8 7.6 28.7 7.6 29.3 8.1
Summer 32.2 8.2 32.8 7.6 31.6 7.7 32.3 8.3
S.W.
Monsoon 32.0 8.1 33.5 7.3 32.8 7.7 33.5 8.1
N.E.
Monsoon 29.1 8.1 30.3 7.3 30.6 7.5 30.8 7.8
[image:5.595.317.549.150.498.2]The station II temperature is increased from 28.67 C to 33.5 C in the Post Monsoon to Summer then it decreased in the remaining South West and North East monsoon and reached the value of 30 C. The station III is similar to station I. The temperature is increased from 28.6 to 33.3 in the post monsoon to South West monsoon and decreased in the North West Monsoon. The same type of variation follows in the station IV too. The obtained results are evaluated below. The seasonal variances are represented in the graph (Fig. 1).
Fig. 1 Station I
5.
RESULT ANALYSIS
The water quality index is computed for the four selected area from the collected sample in different seasons. But the WQI is unstable for the seasonal factor and locations. The computed WQI are presented in table -6.
Table – 6 - WQI Range for first year
Season
Year 1
S I
Year 1
S II
Year 1
S III
Year 1
S IV
Summer 74.4 72 86.8 66.4
Post Monsoon 63.2 72 90 76.8
North East
Monsoon 69.6 72 82 72
South West
Monsoon 66.4 83.2 90.8 83.2
Table – 7 - WQI Range for second year
Season
Year 2
S I
Year 2
S II
Year 2
S III
Year 2
S IV
Summer 69.6 72 86.8 61.6
Post
Monsoon 63.2 72 86.8 72
North East
Monsoon 69.6 72 85.6 72
South West
Monsoon 66.4 78.4 94.4 80
[image:5.595.316.542.536.683.2]The following chart shows the variation of WQI of different sampling stations. (Fig. 2)
Fig – 2
The calculation procedure is same but the attribute values are differing from one sample location to another due to the physical, chemical and biological attributes of the water. According to the obtained result (table – 6 & 7), the WQI is low for the stations I and IV, the station II is nominal and the WQI of station III is high because it is a private rocky pool which is observed from the diagram given below.
1 2 3 4 5 6 7 8 9 10 11 12 13 14 15 16 17 18 19 20 21 22 Temp - - - 1 3 2 1 0 - - - - 4 2 1 1 - - -
pH 0 - 0 - 0 0 0 0 0 - - - - 0 0 0 0 0 - - - 0
-4.00 -2.00 0.00 2.00 4.00 6.00
Var
iation
s
Months
[image:5.595.56.279.573.748.2]The WQI is low in summer season due to water level. The water level is low and it reflects on the WQI. The low level influences the less purity level. The computed WQI values are not common.
6.
CONCLUSION
As per the observation, the temperature is not a constant value in all the stations. It is a cyclic value within the range. According to the temperature (physical) attribute, pH (Chemical) value also changed. These attributes are interrelated one with another. But the WQI values are not significant to determine the change as well as the relationship between the attribute values of WQI.
The WQI attributes are interrelated between physical, chemical and biological attributes. But the observed data is unable to represent the interrelated attributes ratios. The interrelated dependent level prediction will ensure the purity and the behavior of WQI. The represented standard values are producing the complex level result that will affect the decision making and prevention activities. Therefore the research is continued to determine the attribute complexity comparison and its influences as further enhancement work.
Therefore further research could be focused to design a computational model and procedure to determine the rational level behavior between the water quality attributes.
7.
REFERENCES
[1] Asha Gowda Karegowda, M.A.Jayaram, A.S. Manjunath, Combining Akaike’s Information Criterion (AIC) and the Golden-Section Search Technique to find Optimal Numbers of K-Nearest Neighbors International Journal of Computer Applications, IJCA Journal, Number 1 - Article 11, 2010, 609-859
[2] Gatot Eko Susilo and Rina Febrina, “The siplification of Doe Water Quality Index calculation procedures using Graphical Analysis”, Australian Journal of Basic and Applied Sciences, 5(2):207 – 214, 2011
[3] Hafizan Juahir, Sharifuddin M Zain, Mohd. Ekhwan Toriman, Mazlin Mokhtar, Hasfalina Che Man “Application of Artificial Neural Network models for
predicting Water Quality Index, Journal Kejuruteraan Awam 16(2): 42 – 45, 2004
[4] Kant, S. and Vohra, S., Lakes: The management and conservation. In management of aquatic ecosystem, Ed. Y.P. Agarwal, B.N. Desai and S.A.H. Abidi, Society of Bioscience, Muzaffarnagar, 155 – 168, 1990
[5] Kavitha Parmar and Vineetha Parmar, “ Evaluation of Water Quality Index for drinking purposes of river Subernarekha in Singhbhum District”, International Journal of Environmental Sciences, Vol 1, No. 1, 2010 [6] Mohanraj Ebenezer, “A comparative study on the
ecography of tropical lentic systems of varied origin” , PhD Thesis, 2001
[7] Munirah Abdul Zali, Ananthy Retnam, Hafizan, Sharifuddin M Zain, Mohd Fadhil Kasim, Baharuddin Abdullah and Syaiful Bahren Saadudin, “Sensitivity analysis for Water Quality Index prediction for Kinta river, Malaysia”,World Applied Sciene s Journal 14 (Exploring pathways to sustainable living in Malaysia: Solving the current environmental issues): 60-65, 2011 [8] D S Rajendra Prasad , C Sadhashivaiah, C Ranganna, “ A
comparative study of techniques of water quality parameters”, International Journal of Earth Sciences and Engineering, Volume 04, No. 06 SPL, p 423 – 428, October 2011
[9] Torrey Lindbo, Jan Miller,. Water Quality Index. SWRP
Clean Water Services. Role of the Water Quality Index.
www.swrp.esr.pdx.edu/teacher_info/presentations/wqi.pp t.
[10] Yue LIAO, Jian-yu XU, Zhu-wei WANG, “Application of biomonitoring and support vector machine water quality assessment”, Journal of Zhejiang University- SCIENCE B (Biomedicine & Biochemistry), 2011 [11] Water Quality Standards. The Water Quality Standards