Munich Personal RePEc Archive
Borderplex Economic Outlook:
2005-2007
Fullerton, Thomas M., Jr. and Tinajero, Roberto
University of Texas at El Paso
5 November 2005
Price $10
The University of Texas at El Paso
Border Region
Modeling Project
Business Report SR05-2
The University
of Texas at El Paso
Borderplex Economic Outlook
2005-2007
Business Report SR05-2
UTEP Border Region Modeling Project
This business report is a publication of the Border Region Modeling Project and the Department of
Economics & Finance at the University of Texas at El Paso. For additional
Border Region
information,
please visit the www.utep.edu/coba/eco_fin section of the UTEP web site.
Please send comments to Border Region Modeling Project - CBA 236, Department of Economics &
Finance, 500 West University, El Paso, TX 79968-0543.
UTEP does not discriminate on the basis of race, color, national origin, sex, religion, age, or
disabil-ity in employment or the provision of services.
University of Texas at El Paso
Diana Natalicio, President
Richard Jarvis, Provost
Roberto Osegueda, Vice Provost
UTEP College of Business Administration
Robert Nachtmann, Dean
Janice Joplin, Interim Associate Dean
Tim Roth, Templeton Professor of Banking & Economics
UTEP Border Region Econometric Modeling Project
Corporate and Institutional Sponsors:
El Paso Electric Company
Colony Development
Hunt Building Corporation
Wells Fargo Bank of El Paso
National Science Foundation
Federal Reserve Bank of Dallas
Universidad Autónoma de Ciudad Juárez
UTEP College of Business Administration
UTEP Department of Economics & Finance
UACJ Instituto de Ciencias Sociales y Administración
UTEP Center for Transportation Infrastructure Systems
Southwest Center for Environmental Research & Policy
Special thanks are given to the corporate and institutional sponsors of the UTEP Border Region
Econometric Modeling Project. In particular, El Paso Electric Company and The University of Texas
at El Paso have invested substantial time, effort, and financial resources in making this forecasting
project possible. Econometric research assistance for the current edition of the borderplex outlook
was provided by Marycruz De Leon and Brian Kelley.
Continued maintenance and expansion of the UTEP business modeling system requires
ongo-ing financial support. For information on potential means for supportongo-ing this research effort, please
Executive Overview
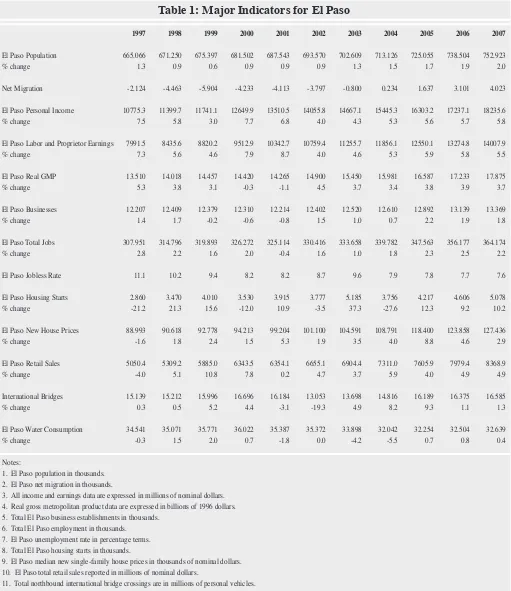
Economic conditions remain healthy in the
bor-derplex. That assessment is reflected by growth
in output, business receipts, and personal incomes
(Table 1). Greater numbers of jobs allow the El Paso
unemployment rate to trend downward as the local
labor market strengthens. Although consumer
in-debtedness remains high, improved income and jobs
performance generate additional retail activity, with
total sales surpassing $8.3 billion in 2006.
Expan-sion at Fort Bliss causes strong levels of positive net
migration and accelerated population growth. That
translates into greater volumes of residential
con-struction in all years of the forecast. Because of the
decision to allow real water rates to erode for a year
or more, aggregate water consumption in El Paso
is expected to increase following four consecutive
years of declines. Additional detail obtained from
simulations of the UTEP Border Region
Economet-ric Model is presented below.
El Paso Demographics
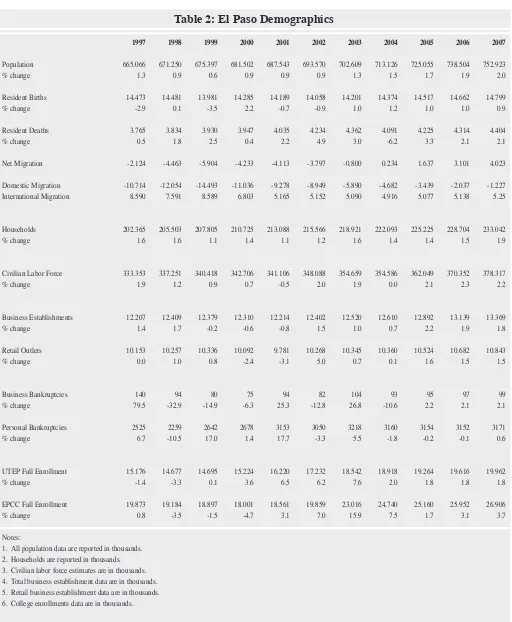
Although population growth continues to be
deter-mined primarily by natural increase, net migration
into El Paso is projected to move sharply upwards
(Table 2). That projection is based on several
distinct factors. Better labor market conditions in
El Paso will induce fewer persons to relocate to
other metropolitan areas. International migration
from Mexico is expected to remain strongly
posi-tive. Strategic decisions by the Base Realignment
and Closure Commission (BRAC) are also expected
to add large numbers of troops to Fort Bliss. The
latter development should eventually cause the rate
of household formation to accelerate and create new
business opportunities. Because of more robust
business conditions, lower levels of both business
and personal bankruptcies are expected to be
ob-served in El Paso over the course of the forecast
period.
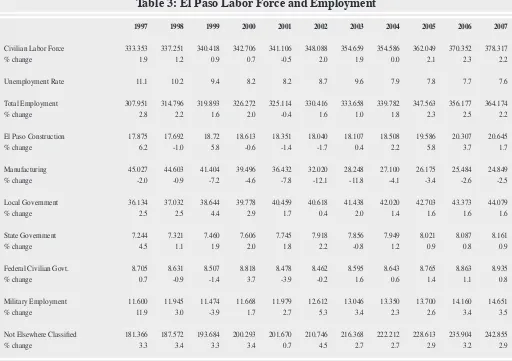
Employment & the El Paso Labor Market
Job creation accelerated in 2004 and is projected
to remain healthy during the next few years (Table
3). Growth in the employment base translates into
a lower metropolitan jobless rate. Increased
lev-els of fixed investment cause construction payrolls
to eclipse the 20 thousand workers mark by 2006.
Manufacturing employment is expected to continue
declining as labor-intensive activities move offshore.
The BRAC process is forecast to cause federal
mili-tary jobs to exceed 14 thousand in El Paso for the
first time since 1994. Although that will help busi
-ness vitality, questions remain with respect to the
timing of the eventual relocation of the Air Defense
Artillery School to Fort Sill. Service sectors of the
economy should continue to grow rapidly. Health
care, retail, business services, telecommunications,
and transportation are among the specific sectors
anticipated to do well. Important structural changes
still confront the local economy. To take advantage
of an increasingly services-oriented labor market,
improved high school graduation rates plus greater
Borderplex Economic Outlook:
2005- 2007
Thomas M. Fullerton, Jr. and Roberto Tinajero
Department of Economics & Finance
enrollment levels in post-secondary educational
programs represent the key to stronger border region
job and income performance.
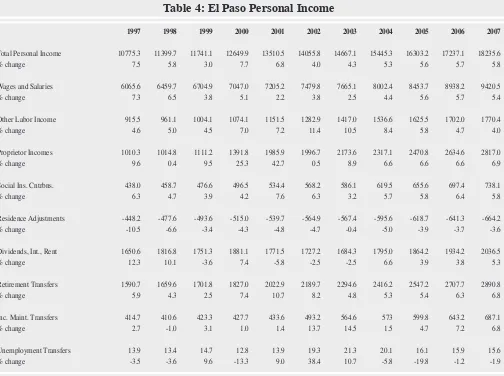
El Paso Personal Income
Better economic conditions allow El Paso personal
income to grow in real per capita terms throughout
the forecast period. As shown in Table 4, wage and
salary disbursements increase as a consequence of
higher employment levels. Not surprisingly, better
labor market conditions also contribute to
ongo-ing declines in unemployment transfers. Moderate
corporate profitability, higher money market yields,
and healthy real estate markets permit dividends,
interest, and rental payments to increase to just over
$2 billion by 2007. Transfer payments to retirees
are expected to reach nearly $2.9 billion in 2007. El
Paso will also continue to draw workers from
sur-rounding counties in Texas and New Mexico, as well
as from Ciudad Juárez. Consequently, residence
adjustments are anticipated to exceed $600 million
per year.
Retail Sales in El Paso
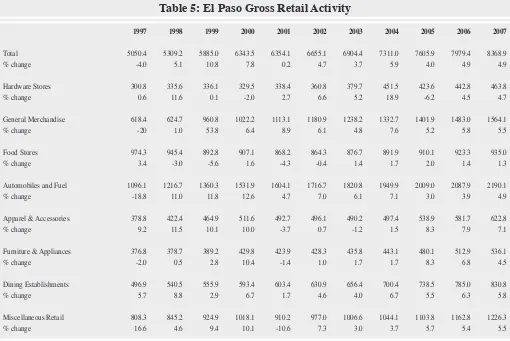
Steady rates of growth are forecast for most
catego-ries of retail sales in El Paso (Table 5). In fact, the
only category for which a negative rate of change is
observed is hardware stores in 2005. The apparent
setback is misleading, however, because it follows a
year in which extremely rapid sales growth occurred.
The only area of sustained weakness is food store
sales, where inflation adjusted per capita declines
are forecast. The latter category continues to be
af-fected by changing household demographic patterns
that reduce time available for in-home meal
prepa-ration. As a consequence, dining establishments
observe annual increases of more than 5.5 percent
per year during the forecast period. Heightened
levels of construction activity also cause furniture
and appliance sales to grow rapidly throughout the
forecast period. Higher oil prices have strengthened
the peso, improving the effective purchasing power
for customers from Mexico who visit El Paso. The
latter development also contributes to fairly robust
sales projections for general merchandise, as well as
apparel and accessories.
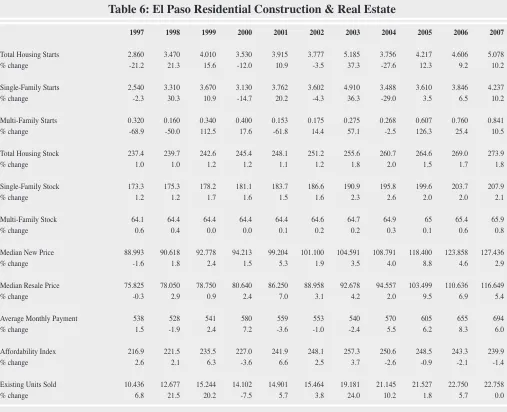
El Paso Residential Construction & Real Estate
The BRAC related expansion of Fort Bliss is
ex-pected to cause substantial increases in net
migra-tion to El Paso. If it materializes as expected, that
development will lead to notable gains in residential
construction during the forecast period (Table 6).
Gradual acceleration is predicted for single-family
housing starts, a surprising simulation result that
defies the increments in mortgage rates currently
forecast for the United States. Even more
impres-sive is the growth projected for multi-family starts.
The latter are forecast to reach their highest level
since 1996. Median prices for both new and
exist-ing sexist-ingle-family units are expected to grow rapidly.
Mortgage rate increases combine with those price
hikes to raise average monthly payments to nearly
$700 by 2007. In response, housing affordability
declines by moderate amounts in every year of the
forecast period. Although affordability is expected
to erode, population and income growth are
suf-ficiently strong that sales of existing homes are
projected to remain in excess of 20 thousand units
per year throughout the forecast period.
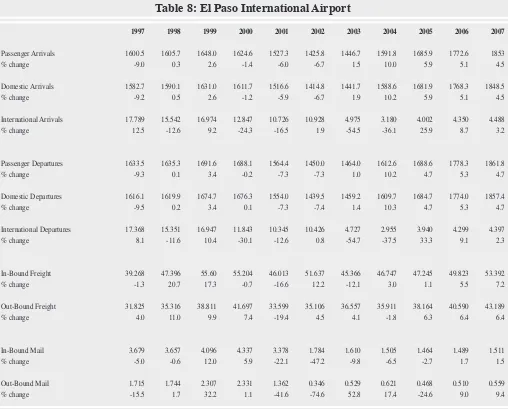
El Paso Air Transportation
com-munications and alternative delivery options
avail-able to customers.
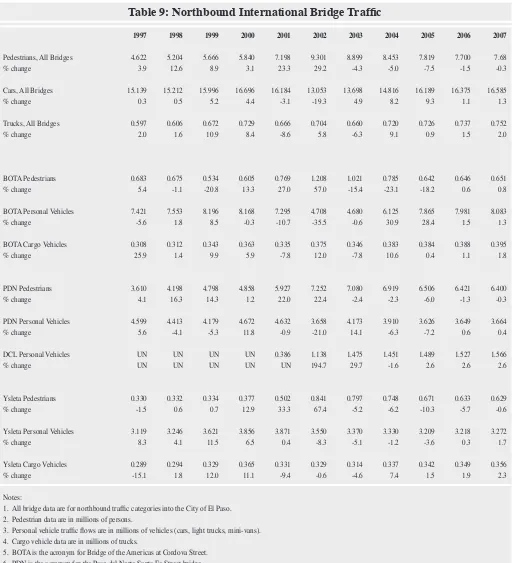
International Bridge Activity
Increases in borderplex economic activity cause
northbound personal and cargo vehicle bridge flows
from Ciudad Juárez into El Paso to swell over the
course of the forecast period. As security concerns
are better addressed via new infrastructure and safety
procedures, pedestrian traffic at the Paso del Norte
and Ysleta bridges is expected to decline. Those
decrements are not forecast, however, to fall below
the levels observed prior to 2001 at those arteries
(Table 9). Total cargo vehicle traffic is expected
to exceed 750 thousand trucks by 207. Personal
vehicle traffic across the Bridge of the Americas has
increased in response to more reduced wait times.
The rapid growth observed in 2004 should subside
by 2006 and be followed by moderate growth again
in 2007.
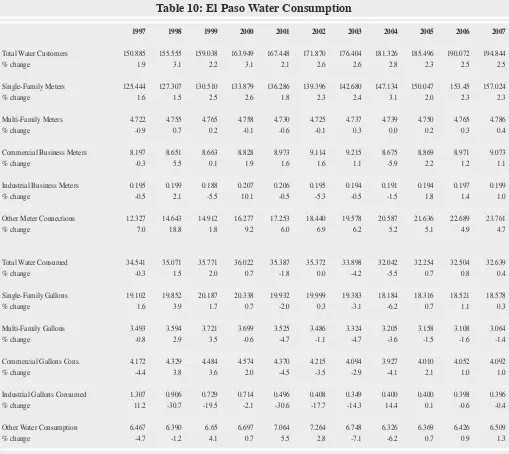
El Paso Water Consumption
Relatively sharp rate increases in 2003 and 2004
caused aggregate water usage to decline sharply in
El Paso during those years (Table 10). That pattern
will be partially reversed as a consequence of the
de-cision to deliberately allow water rates to decline in
real terms in 2005. Given the rapid growth projected
in the number of hook-ups, the policy of allowing
rates to again lag behind the overall rate of infla
-tion carries with it the risk of encouraging per capita
consumption levels begin climbing again. Such a
development may, however, be less problematic than
in years past due to reduced industrial water
require-ments and new desalination capacity being
devel-oped at Fort Bliss.
Ciudad Juárez Economic Activity
Total employment reversed three consecutive years
of declines in Ciudad Juárez in 2004. The catalyst
for that welcome reversal was better economic
conditions in the United States. The latter translated
into increased orders for the maquiladora sector
and substantial increases in the numbers of workers
hired (Table 12). It will take time to reverse the job
losses tallied between 2001 and 2003, but new plant
openings and greater investment from abroad have
initiated that process. Because the outlook for the
peso is relatively steady in real terms, in-bond
manu-facturing hourly earnings should climb to
approxi-mately $3.90 dollars per hour by 2007. Significant
deregulation and market-oriented reforms in Mexico
are not likely in 2006 due to the looming presidential
election. Consequently, further erosion in
competi-tiveness with Central American and Far East Asian
countries such as China is likely. Given that, the
maquiladora sector will probably operate at less than
full capacity for the foreseeable future. In spite of
that, rapid population growth is still projected in
Ciudad Juárez as new workers migrate from other
regions within the country (Table 11). That, plus
incomes growth cause the demand for municipal
water service to remain very high. Consequently,
the number of hook-ups is expected to surpass 378
thousand in 2007 with aggregate water consumption
exceeding 175 million cubic meters that year.
Chihuahua City Economic Activity
to exceed 247 thousand by 2007. Real rate increases
are expected to lower per capita consumption, but
not by enough to prevent total water usage from
growing to more than 71.6 million cubic meters in
2007.
Las Cruces Economic Conditions
Similar to El Paso, improving in business conditions
encourages the rate of business formation to
ac-celerate in Las Cruces. Significant declines in both
business and personal bankruptcies are also forecast
in this metropolitan economy (Table 13). Relatively
rapid rates of in-migration, especially by retirees, are
expected to increase construction payrolls in Doña
Ana County. Buoyed by stable public finances, state
and local government payrolls are expected to
con-tinue slowly expanding (Table 14). The fastest rates
of jobs growth are projected for service segments in
this region of Southern New Mexico. Total
employ-ment is projected to exceed 88.7 thousand jobs by
2007. Given the outlook for employment, wages
and proprietor incomes are estimated to increase
substantially, with average growth rates of more than
five percent per year (Table 15). In general, most
income categories exhibit healthy performances in
Las Cruces and total personal income is projected to
surpass $4.7 billion by 2007.
Forecast Risks
National economic conditions in the United States
and Mexico are projected to remain stable in 2006
and 2007. Historically high levels of corporate and
household indebtedness represent important weak
points hampering economic performance in the
Unit-ed States. Energy price hikes resulting from
hur-ricane supply disruptions represent another source of
potential difficulties for the national economy. Leg
-islative gridlock in Mexico City continues to derail
the approval process for important structural reforms
in that economy. Both circumstances can potentially
impact the borderplex economy in a negative
man-ner. Closer to home, El Paso continues to face
dif-ficulties associated with low educational attainment
and physical infrastructure investment. The private
sector in Ciudad Juárez continues to struggle with
complex business licensing requirements and both
cities face ongoing risks associated with heightened
security requirements at the border. Also critical to
the accuracy of this outlook is the manner in which
the BRAC decisions are implemented, particularly
the timing of the relocation of the Air Defense
Artil-lery School to Fort Sill, Oklahoma.
Historical and Forecast Data
Table 1
Major Indicators for El Paso
Table 2
El Paso Demographics
Table 3
El Paso Labor Force and Employment
Table 4
El Paso Personal Income
Table 5
El Paso Gross Retail Activity
Table 6
El Paso Residential Construction & Real Estate
Table 7
El Paso Nonresidential Construction
Table 8
El Paso Air Transportation
Table 9
Northbound International Bridge Traffic
Table 10
El Paso Water Consumption
Table 11
Ciudad Juárez Demographic Indicators
Table 12
Ciudad Juárez Economic Indicators
Table 13
Ciudad Chihuahua Economic Indicators
Table 14
Las Cruces Demographics & Other Indicators
Table 15
Las Cruces Employment
Table 16
Table 1: Major Indicators for El Paso
1997 1998 1999 2000 2001 2002 2003 2004 2005 2006 2007
El Paso Population 665.066 671.250 675.397 681.502 687.543 693.570 702.609 713.126 725.055 738.504 752.923 % change 1.3 0.9 0.6 0.9 0.9 0.9 1.3 1.5 1.7 1.9 2.0 Net Migration -2.124 -4.463 -5.904 -4.233 -4.113 -3.797 -0.800 0.234 1.637 3.101 4.023 El Paso Personal Income 10775.3 11399.7 11741.1 12649.9 13510.5 14055.8 14667.1 15445.3 16303.2 17237.1 18235.6 % change 7.5 5.8 3.0 7.7 6.8 4.0 4.3 5.3 5.6 5.7 5.8 El Paso Labor and Proprietor Earnings 7991.5 8435.6 8820.2 9512.9 10342.7 10759.4 11255.7 11856.1 12550.1 13274.8 14007.9 % change 7.3 5.6 4.6 7.9 8.7 4.0 4.6 5.3 5.9 5.8 5.5 El Paso Real GMP 13.510 14.018 14.457 14.420 14.265 14.900 15.450 15.981 16.587 17.233 17.875 % change 5.3 3.8 3.1 -0.3 -1.1 4.5 3.7 3.4 3.8 3.9 3.7 El Paso Businesses 12.207 12.409 12.379 12.310 12.214 12.402 12.520 12.610 12.892 13.139 13.369 % change 1.4 1.7 -0.2 -0.6 -0.8 1.5 1.0 0.7 2.2 1.9 1.8 El Paso Total Jobs 307.951 314.796 319.893 326.272 325.114 330.416 333.658 339.782 347.563 356.177 364.174 % change 2.8 2.2 1.6 2.0 -0.4 1.6 1.0 1.8 2.3 2.5 2.2 El Paso Jobless Rate 11.1 10.2 9.4 8.2 8.2 8.7 9.6 7.9 7.8 7.7 7.6 El Paso Housing Starts 2.860 3.470 4.010 3.530 3.915 3.777 5.185 3.756 4.217 4.606 5.078 % change -21.2 21.3 15.6 -12.0 10.9 -3.5 37.3 -27.6 12.3 9.2 10.2 El Paso New House Prices 88.993 90.618 92.778 94.213 99.204 101.100 104.591 108.791 118.400 123.858 127.436 % change -1.6 1.8 2.4 1.5 5.3 1.9 3.5 4.0 8.8 4.6 2.9 El Paso Retail Sales 5050.4 5309.2 5885.0 6343.5 6354.1 6655.1 6904.4 7311.0 7605.9 7979.4 8368.9 % change -4.0 5.1 10.8 7.8 0.2 4.7 3.7 5.9 4.0 4.9 4.9 International Bridges 15.139 15.212 15.996 16.696 16.184 13.053 13.698 14.816 16.189 16.375 16.585 % change 0.3 0.5 5.2 4.4 -3.1 -19.3 4.9 8.2 9.3 1.1 1.3 El Paso Water Consumption 34.541 35.071 35.771 36.022 35.387 35.372 33.898 32.042 32.254 32.504 32.639 % change -0.3 1.5 2.0 0.7 -1.8 0.0 -4.2 -5.5 0.7 0.8 0.4 Notes:
1. El Paso population in thousands. 2. El Paso net migration in thousands.
3. All income and earnings data are expressed in millions of nominal dollars. 4. Real gross metropolitan product data are expressed in billions of 1996 dollars. 5. Total El Paso business establishments in thousands.
6. Total El Paso employment in thousands. 7. El Paso unemployment rate in percentage terms. 8. Total El Paso housing starts in thousands.
9. El Paso median new single-family house prices in thousands of nominal dollars. 10. El Paso total retail sales reported in millions of nominal dollars.
Table 2: El Paso Demographics
1997 1998 1999 2000 2001 2002 2003 2004 2005 2006 2007
Population 665.066 671.250 675.397 681.502 687.543 693.570 702.609 713.126 725.055 738.504 752.923 % change 1.3 0.9 0.6 0.9 0.9 0.9 1.3 1.5 1.7 1.9 2.0 Resident Births 14.473 14.481 13.981 14.285 14.189 14.058 14.201 14.374 14.517 14.662 14.799 % change -2.9 0.1 -3.5 2.2 -0.7 -0.9 1.0 1.2 1.0 1.0 0.9 Resident Deaths 3.765 3.834 3.930 3.947 4.035 4.234 4.362 4.091 4.225 4.314 4.404 % change 0.5 1.8 2.5 0.4 2.2 4.9 3.0 -6.2 3.3 2.1 2.1 Net Migration -2.124 -4.463 -5.904 -4.233 -4.113 -3.797 -0.800 0.234 1.637 3.101 4.023 Domestic Migration -10.714 -12.054 -14.493 -11.036 -9.278 -8.949 -5.890 -4.682 -3.439 -2.037 -1.227 International Migration 8.590 7.591 8.589 6.803 5.165 5.152 5.090 4.916 5.077 5.138 5.25 Households 202.365 205.503 207.805 210.725 213.088 215.566 218.921 222.093 225.225 228.704 233.042 % change 1.6 1.6 1.1 1.4 1.1 1.2 1.6 1.4 1.4 1.5 1.9 Civilian Labor Force 333.353 337.251 340.418 342.706 341.106 348.088 354.659 354.586 362.049 370.352 378.317 % change 1.9 1.2 0.9 0.7 -0.5 2.0 1.9 0.0 2.1 2.3 2.2 Business Establishments 12.207 12.409 12.379 12.310 12.214 12.402 12.520 12.610 12.892 13.139 13.369 % change 1.4 1.7 -0.2 -0.6 -0.8 1.5 1.0 0.7 2.2 1.9 1.8 Retail Outlets 10.153 10.257 10.336 10.092 9.781 10.268 10.345 10.360 10.524 10.682 10.843 % change 0.0 1.0 0.8 -2.4 -3.1 5.0 0.7 0.1 1.6 1.5 1.5 Business Bankruptcies 140 94 80 75 94 82 104 93 95 97 99 % change 79.5 -32.9 -14.9 -6.3 25.3 -12.8 26.8 -10.6 2.2 2.1 2.1 Personal Bankruptcies 2525 2259 2642 2678 3153 3050 3218 3160 3154 3152 3171 % change 6.7 -10.5 17.0 1.4 17.7 -3.3 5.5 -1.8 -0.2 -0.1 0.6 UTEP Fall Enrollment 15.176 14.677 14.695 15.224 16.220 17.232 18.542 18.918 19.264 19.616 19.962 % change -1.4 -3.3 0.1 3.6 6.5 6.2 7.6 2.0 1.8 1.8 1.8 EPCC Fall Enrollment 19.873 19.184 18.897 18.001 18.561 19.859 23.016 24.740 25.160 25.952 26.906 % change 0.8 -3.5 -1.5 -4.7 3.1 7.0 15.9 7.5 1.7 3.1 3.7 Notes:
Table 3: El Paso Labor Force and Employment
1997 1998 1999 2000 2001 2002 2003 2004 2005 2006 2007
Civilian Labor Force 333.353 337.251 340.418 342.706 341.106 348.088 354.659 354.586 362.049 370.352 378.317 % change 1.9 1.2 0.9 0.7 -0.5 2.0 1.9 0.0 2.1 2.3 2.2 Unemployment Rate 11.1 10.2 9.4 8.2 8.2 8.7 9.6 7.9 7.8 7.7 7.6 Total Employment 307.951 314.796 319.893 326.272 325.114 330.416 333.658 339.782 347.563 356.177 364.174 % change 2.8 2.2 1.6 2.0 -0.4 1.6 1.0 1.8 2.3 2.5 2.2 El Paso Construction 17.875 17.692 18.72 18.613 18.351 18.040 18.107 18.508 19.586 20.307 20.645 % change 6.2 -1.0 5.8 -0.6 -1.4 -1.7 0.4 2.2 5.8 3.7 1.7 Manufacturing 45.027 44.603 41.404 39.496 36.432 32.020 28.248 27.100 26.175 25.484 24.849 % change -2.0 -0.9 -7.2 -4.6 -7.8 -12.1 -11.8 -4.1 -3.4 -2.6 -2.5 Local Government 36.134 37.032 38.644 39.778 40.459 40.618 41.438 42.020 42.703 43.373 44.079 % change 2.5 2.5 4.4 2.9 1.7 0.4 2.0 1.4 1.6 1.6 1.6 State Government 7.244 7.321 7.460 7.606 7.745 7.918 7.856 7.949 8.021 8.087 8.161 % change 4.5 1.1 1.9 2.0 1.8 2.2 -0.8 1.2 0.9 0.8 0.9 Federal Civilian Govt. 8.705 8.631 8.507 8.818 8.478 8.462 8.595 8.643 8.765 8.863 8.935 % change 0.7 -0.9 -1.4 3.7 -3.9 -0.2 1.6 0.6 1.4 1.1 0.8 Military Employment 11.600 11.945 11.474 11.668 11.979 12.612 13.046 13.350 13.700 14.160 14.651 % change 11.9 3.0 -3.9 1.7 2.7 5.3 3.4 2.3 2.6 3.4 3.5
Not Elsewhere Classified 181.366 187.572 193.684 200.293 201.670 210.746 216.368 222.212 228.613 235.904 242.855
% change 3.3 3.4 3.3 3.4 0.7 4.5 2.7 2.7 2.9 3.2 2.9 Notes:
1. Labor force in thousands
2. Unemployment rate data in percentages. 3. Employment data in thousands.
Table 4: El Paso Personal Income
1997 1998 1999 2000 2001 2002 2003 2004 2005 2006 2007
Total Personal Income 10775.3 11399.7 11741.1 12649.9 13510.5 14055.8 14667.1 15445.3 16303.2 17237.1 18235.6 % change 7.5 5.8 3.0 7.7 6.8 4.0 4.3 5.3 5.6 5.7 5.8 Wages and Salaries 6065.6 6459.7 6704.9 7047.0 7205.2 7479.8 7665.1 8002.4 8453.7 8938.2 9420.5 % change 7.3 6.5 3.8 5.1 2.2 3.8 2.5 4.4 5.6 5.7 5.4 Other Labor Income 915.5 961.1 1004.1 1074.1 1151.5 1282.9 1417.0 1536.6 1625.5 1702.0 1770.4 % change 4.6 5.0 4.5 7.0 7.2 11.4 10.5 8.4 5.8 4.7 4.0 Proprietor Incomes 1010.3 1014.8 1111.2 1391.8 1985.9 1996.7 2173.6 2317.1 2470.8 2634.6 2817.0 % change 9.6 0.4 9.5 25.3 42.7 0.5 8.9 6.6 6.6 6.6 6.9 Social Ins. Cntrbns. 438.0 458.7 476.6 496.5 534.4 568.2 586.1 619.5 655.6 697.4 738.1 % change 6.3 4.7 3.9 4.2 7.6 6.3 3.2 5.7 5.8 6.4 5.8 Residence Adjustments -448.2 -477.6 -493.6 -515.0 -539.7 -564.9 -567.4 -595.6 -618.7 -641.3 -664.2 % change -10.5 -6.6 -3.4 -4.3 -4.8 -4.7 -0.4 -5.0 -3.9 -3.7 -3.6 Dividends, Int., Rent 1650.6 1816.8 1751.3 1881.1 1771.5 1727.2 1684.3 1795.0 1864.2 1934.2 2036.5 % change 12.3 10.1 -3.6 7.4 -5.8 -2.5 -2.5 6.6 3.9 3.8 5.3 Retirement Transfers 1590.7 1659.6 1701.8 1827.0 2022.9 2189.7 2294.6 2416.2 2547.2 2707.7 2890.8 % change 5.9 4.3 2.5 7.4 10.7 8.2 4.8 5.3 5.4 6.3 6.8 Inc. Maint. Transfers 414.7 410.6 423.3 427.7 433.6 493.2 564.6 573 599.8 643.2 687.1 % change 2.7 -1.0 3.1 1.0 1.4 13.7 14.5 1.5 4.7 7.2 6.8 Unemployment Transfers 13.9 13.4 14.7 12.8 13.9 19.3 21.3 20.1 16.1 15.9 15.6 % change -3.5 -3.6 9.6 -13.3 9.0 38.4 10.7 -5.8 -19.8 -1.2 -1.9 Notes:
1. All income data are expressed in millions of dollars.
2. Social insurance contributions are deducted from total regional income estimates. 3. Retirement transfer payments include social security and other retirement payments.
Table 5: El Paso Gross Retail Activity
1997 1998 1999 2000 2001 2002 2003 2004 2005 2006 2007
Total 5050.4 5309.2 5885.0 6343.5 6354.1 6655.1 6904.4 7311.0 7605.9 7979.4 8368.9 % change -4.0 5.1 10.8 7.8 0.2 4.7 3.7 5.9 4.0 4.9 4.9 Hardware Stores 300.8 335.6 336.1 329.5 338.4 360.8 379.7 451.5 423.6 442.8 463.8 % change 0.6 11.6 0.1 -2.0 2.7 6.6 5.2 18.9 -6.2 4.5 4.7 General Merchandise 618.4 624.7 960.8 1022.2 1113.1 1180.9 1238.2 1332.7 1401.9 1483.0 1564.1 % change -20 1.0 53.8 6.4 8.9 6.1 4.8 7.6 5.2 5.8 5.5 Food Stores 974.3 945.4 892.8 907.1 868.2 864.3 876.7 891.9 910.1 923.3 935.0 % change 3.4 -3.0 -5.6 1.6 -4.3 -0.4 1.4 1.7 2.0 1.4 1.3 Automobiles and Fuel 1096.1 1216.7 1360.3 1531.9 1604.1 1716.7 1820.8 1949.9 2009.0 2087.9 2190.1 % change -18.8 11.0 11.8 12.6 4.7 7.0 6.1 7.1 3.0 3.9 4.9 Apparel & Accessories 378.8 422.4 464.9 511.6 492.7 496.1 490.2 497.4 538.9 581.7 622.8 % change 9.2 11.5 10.1 10.0 -3.7 0.7 -1.2 1.5 8.3 7.9 7.1 Furniture & Appliances 376.8 378.7 389.2 429.8 423.9 428.3 435.8 443.1 480.1 512.9 536.1 % change -2.0 0.5 2.8 10.4 -1.4 1.0 1.7 1.7 8.3 6.8 4.5 Dining Establishments 496.9 540.5 555.9 593.4 603.4 630.9 656.4 700.4 738.5 785.0 830.8 % change 5.7 8.8 2.9 6.7 1.7 4.6 4.0 6.7 5.5 6.3 5.8 Miscellaneous Retail 808.3 845.2 924.9 1018.1 910.2 977.0 1006.6 1044.1 1103.8 1162.8 1226.3 % change 16.6 4.6 9.4 10.1 -10.6 7.3 3.0 3.7 5.7 5.4 5.5 Notes:
1. All sales figures are expressed in millions of dollars.
2. Hardware stores include hardware, garden supply, and building materials stores, plus mobile home dealers. 3. General merchandise stores include department, variety, and miscellaneous dry goods stores.
4. Food stores include grocery stores, seafood markets, vegetable stands, candy stores, bakeries, and dairy outlets.
5. Automobiles and fuel includes car and motorcycle dealers, auto parts stores, gasoline service stations, water and rec. vehicle dealers. 6. Dining establishments include restaurants, caterers, ice cream parlors, cafes, bars and nightclubs.
Table 6: El Paso Residential Construction & Real Estate
1997 1998 1999 2000 2001 2002 2003 2004 2005 2006 2007
Total Housing Starts 2.860 3.470 4.010 3.530 3.915 3.777 5.185 3.756 4.217 4.606 5.078 % change -21.2 21.3 15.6 -12.0 10.9 -3.5 37.3 -27.6 12.3 9.2 10.2 Single-Family Starts 2.540 3.310 3.670 3.130 3.762 3.602 4.910 3.488 3.610 3.846 4.237 % change -2.3 30.3 10.9 -14.7 20.2 -4.3 36.3 -29.0 3.5 6.5 10.2 Multi-Family Starts 0.320 0.160 0.340 0.400 0.153 0.175 0.275 0.268 0.607 0.760 0.841 % change -68.9 -50.0 112.5 17.6 -61.8 14.4 57.1 -2.5 126.3 25.4 10.5 Total Housing Stock 237.4 239.7 242.6 245.4 248.1 251.2 255.6 260.7 264.6 269.0 273.9 % change 1.0 1.0 1.2 1.2 1.1 1.2 1.8 2.0 1.5 1.7 1.8 Single-Family Stock 173.3 175.3 178.2 181.1 183.7 186.6 190.9 195.8 199.6 203.7 207.9 % change 1.2 1.2 1.7 1.6 1.5 1.6 2.3 2.6 2.0 2.0 2.1 Multi-Family Stock 64.1 64.4 64.4 64.4 64.4 64.6 64.7 64.9 65 65.4 65.9 % change 0.6 0.4 0.0 0.0 0.1 0.2 0.2 0.3 0.1 0.6 0.8 Median New Price 88.993 90.618 92.778 94.213 99.204 101.100 104.591 108.791 118.400 123.858 127.436 % change -1.6 1.8 2.4 1.5 5.3 1.9 3.5 4.0 8.8 4.6 2.9
Median Resale Price 75.825 78.050 78.750 80.640 86.250 88.958 92.678 94.557 103.499 110.636 116.649 % change -0.3 2.9 0.9 2.4 7.0 3.1 4.2 2.0 9.5 6.9 5.4 Average Monthly Payment 538 528 541 580 559 553 540 570 605 655 694 % change 1.5 -1.9 2.4 7.2 -3.6 -1.0 -2.4 5.5 6.2 8.3 6.0 Affordability Index 216.9 221.5 235.5 227.0 241.9 248.1 257.3 250.6 248.5 243.3 239.9 % change 2.6 2.1 6.3 -3.6 6.6 2.5 3.7 -2.6 -0.9 -2.1 -1.4 Existing Units Sold 10.436 12.677 15.244 14.102 14.901 15.464 19.181 21.145 21.527 22.750 22.758 % change 6.8 21.5 20.2 -7.5 5.7 3.8 24.0 10.2 1.8 5.7 0.0 Notes:
1. Housing start and stock data are in thousands.
2. Affordability index increases as household income strengthens relative to mortgage payments. 3. Average monthly mortgage payment is in current dollars.
4. Existing housing units sold includes both stand-alone and multi-family units.
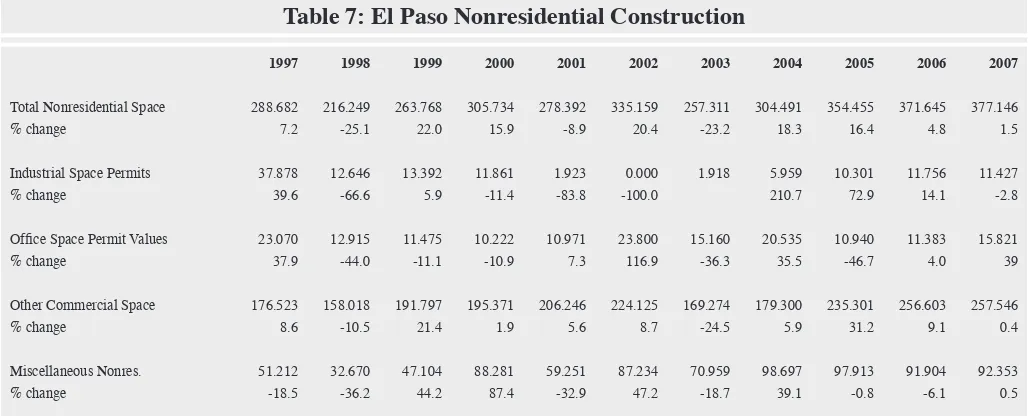
Table 7: El Paso Nonresidential Construction
1997 1998 1999 2000 2001 2002 2003 2004 2005 2006 2007
Total Nonresidential Space 288.682 216.249 263.768 305.734 278.392 335.159 257.311 304.491 354.455 371.645 377.146 % change 7.2 -25.1 22.0 15.9 -8.9 20.4 -23.2 18.3 16.4 4.8 1.5 Industrial Space Permits 37.878 12.646 13.392 11.861 1.923 0.000 1.918 5.959 10.301 11.756 11.427 % change 39.6 -66.6 5.9 -11.4 -83.8 -100.0 210.7 72.9 14.1 -2.8
Office Space Permit Values 23.070 12.915 11.475 10.222 10.971 23.800 15.160 20.535 10.940 11.383 15.821
% change 37.9 -44.0 -11.1 -10.9 7.3 116.9 -36.3 35.5 -46.7 4.0 39 Other Commercial Space 176.523 158.018 191.797 195.371 206.246 224.125 169.274 179.300 235.301 256.603 257.546 % change 8.6 -10.5 21.4 1.9 5.6 8.7 -24.5 5.9 31.2 9.1 0.4 Miscellaneous Nonres. 51.212 32.670 47.104 88.281 59.251 87.234 70.959 98.697 97.913 91.904 92.353 % change -18.5 -36.2 44.2 87.4 -32.9 47.2 -18.7 39.1 -0.8 -6.1 0.5 Notes:
1. All nonresidential construction permits data are quoted in millions of dollars.
Table 8: El Paso International Airport
1997 1998 1999 2000 2001 2002 2003 2004 2005 2006 2007
Passenger Arrivals 1600.5 1605.7 1648.0 1624.6 1527.3 1425.8 1446.7 1591.8 1685.9 1772.6 1853 % change -9.0 0.3 2.6 -1.4 -6.0 -6.7 1.5 10.0 5.9 5.1 4.5 Domestic Arrivals 1582.7 1590.1 1631.0 1611.7 1516.6 1414.8 1441.7 1588.6 1681.9 1768.3 1848.5 % change -9.2 0.5 2.6 -1.2 -5.9 -6.7 1.9 10.2 5.9 5.1 4.5 International Arrivals 17.789 15.542 16.974 12.847 10.726 10.928 4.975 3.180 4.002 4.350 4.488 % change 12.5 -12.6 9.2 -24.3 -16.5 1.9 -54.5 -36.1 25.9 8.7 3.2 Passenger Departures 1633.5 1635.3 1691.6 1688.1 1564.4 1450.0 1464.0 1612.6 1688.6 1778.3 1861.8 % change -9.3 0.1 3.4 -0.2 -7.3 -7.3 1.0 10.2 4.7 5.3 4.7 Domestic Departures 1616.1 1619.9 1674.7 1676.3 1554.0 1439.5 1459.2 1609.7 1684.7 1774.0 1857.4 % change -9.5 0.2 3.4 0.1 -7.3 -7.4 1.4 10.3 4.7 5.3 4.7 International Departures 17.368 15.351 16.947 11.843 10.345 10.426 4.727 2.955 3.940 4.299 4.397 % change 8.1 -11.6 10.4 -30.1 -12.6 0.8 -54.7 -37.5 33.3 9.1 2.3 In-Bound Freight 39.268 47.396 55.60 55.204 46.013 51.637 45.366 46.747 47.245 49.823 53.392 % change -1.3 20.7 17.3 -0.7 -16.6 12.2 -12.1 3.0 1.1 5.5 7.2 Out-Bound Freight 31.825 35.316 38.811 41.697 33.599 35.106 36.557 35.911 38.164 40.590 43.189 % change 4.0 11.0 9.9 7.4 -19.4 4.5 4.1 -1.8 6.3 6.4 6.4 In-Bound Mail 3.679 3.657 4.096 4.337 3.378 1.784 1.610 1.505 1.464 1.489 1.511 % change -5.0 -0.6 12.0 5.9 -22.1 -47.2 -9.8 -6.5 -2.7 1.7 1.5 Out-Bound Mail 1.715 1.744 2.307 2.331 1.362 0.346 0.529 0.621 0.468 0.510 0.559 % change -15.5 1.7 32.2 1.1 -41.6 -74.6 52.8 17.4 -24.6 9.0 9.4 Notes:
Table 9: Northbound International Bridge Traffic
1997 1998 1999 2000 2001 2002 2003 2004 2005 2006 2007
Pedestrians, All Bridges 4.622 5.204 5.666 5.840 7.198 9.301 8.899 8.453 7.819 7.700 7.68 % change 3.9 12.6 8.9 3.1 23.3 29.2 -4.3 -5.0 -7.5 -1.5 -0.3 Cars, All Bridges 15.139 15.212 15.996 16.696 16.184 13.053 13.698 14.816 16.189 16.375 16.585 % change 0.3 0.5 5.2 4.4 -3.1 -19.3 4.9 8.2 9.3 1.1 1.3 Trucks, All Bridges 0.597 0.606 0.672 0.729 0.666 0.704 0.660 0.720 0.726 0.737 0.752 % change 2.0 1.6 10.9 8.4 -8.6 5.8 -6.3 9.1 0.9 1.5 2.0 BOTA Pedestrians 0.683 0.675 0.534 0.605 0.769 1.208 1.021 0.785 0.642 0.646 0.651 % change 5.4 -1.1 -20.8 13.3 27.0 57.0 -15.4 -23.1 -18.2 0.6 0.8 BOTA Personal Vehicles 7.421 7.553 8.196 8.168 7.295 4.708 4.680 6.125 7.865 7.981 8.083 % change -5.6 1.8 8.5 -0.3 -10.7 -35.5 -0.6 30.9 28.4 1.5 1.3 BOTA Cargo Vehicles 0.308 0.312 0.343 0.363 0.335 0.375 0.346 0.383 0.384 0.388 0.395 % change 25.9 1.4 9.9 5.9 -7.8 12.0 -7.8 10.6 0.4 1.1 1.8 PDN Pedestrians 3.610 4.198 4.798 4.858 5.927 7.252 7.080 6.919 6.506 6.421 6.400 % change 4.1 16.3 14.3 1.2 22.0 22.4 -2.4 -2.3 -6.0 -1.3 -0.3 PDN Personal Vehicles 4.599 4.413 4.179 4.672 4.632 3.658 4.173 3.910 3.626 3.649 3.664 % change 5.6 -4.1 -5.3 11.8 -0.9 -21.0 14.1 -6.3 -7.2 0.6 0.4 DCL Personal Vehicles UN UN UN UN 0.386 1.138 1.475 1.451 1.489 1.527 1.566 % change UN UN UN UN UN 194.7 29.7 -1.6 2.6 2.6 2.6 Ysleta Pedestrians 0.330 0.332 0.334 0.377 0.502 0.841 0.797 0.748 0.671 0.633 0.629 % change -1.5 0.6 0.7 12.9 33.3 67.4 -5.2 -6.2 -10.3 -5.7 -0.6 Ysleta Personal Vehicles 3.119 3.246 3.621 3.856 3.871 3.550 3.370 3.330 3.209 3.218 3.272 % change 8.3 4.1 11.5 6.5 0.4 -8.3 -5.1 -1.2 -3.6 0.3 1.7 Ysleta Cargo Vehicles 0.289 0.294 0.329 0.365 0.331 0.329 0.314 0.337 0.342 0.349 0.356 % change -15.1 1.8 12.0 11.1 -9.4 -0.6 -4.6 7.4 1.5 1.9 2.3 Notes:
1. All bridge data are for northbound traffic categories into the City of El Paso.
2. Pedestrian data are in millions of persons.
3. Personal vehicle traffic flows are in millions of vehicles (cars, light trucks, mini-vans).
4. Cargo vehicle data are in millions of trucks.
5. BOTA is the acronym for Bridge of the Americas at Cordova Street. 6. PDN is the acronym for the Paso del Norte Santa Fe Street bridge.
Table 10: El Paso Water Consumption
1997 1998 1999 2000 2001 2002 2003 2004 2005 2006 2007
Total Water Customers 150.885 155.555 159.038 163.949 167.448 171.870 176.404 181.326 185.496 190.072 194.844 % change 1.9 3.1 2.2 3.1 2.1 2.6 2.6 2.8 2.3 2.5 2.5 Single-Family Meters 125.444 127.307 130.510 133.879 136.286 139.396 142.680 147.134 150.047 153.45 157.024 % change 1.6 1.5 2.5 2.6 1.8 2.3 2.4 3.1 2.0 2.3 2.3 Multi-Family Meters 4.722 4.755 4.765 4.758 4.730 4.725 4.737 4.739 4.750 4.765 4.786 % change -0.9 0.7 0.2 -0.1 -0.6 -0.1 0.3 0.0 0.2 0.3 0.4 Commercial Business Meters 8.197 8.651 8.663 8.828 8.973 9.114 9.215 8.675 8.869 8.971 9.073 % change -0.3 5.5 0.1 1.9 1.6 1.6 1.1 -5.9 2.2 1.2 1.1 Industrial Business Meters 0.195 0.199 0.188 0.207 0.206 0.195 0.194 0.191 0.194 0.197 0.199 % change -0.5 2.1 -5.5 10.1 -0.5 -5.3 -0.5 -1.5 1.8 1.4 1.0 Other Meter Connections 12.327 14.643 14.912 16.277 17.253 18.440 19.578 20.587 21.636 22.689 23.761 % change 7.0 18.8 1.8 9.2 6.0 6.9 6.2 5.2 5.1 4.9 4.7 Total Water Consumed 34.541 35.071 35.771 36.022 35.387 35.372 33.898 32.042 32.254 32.504 32.639 % change -0.3 1.5 2.0 0.7 -1.8 0.0 -4.2 -5.5 0.7 0.8 0.4 Single-Family Gallons 19.102 19.852 20.187 20.338 19.932 19.999 19.383 18.184 18.316 18.521 18.578 % change 1.6 3.9 1.7 0.7 -2.0 0.3 -3.1 -6.2 0.7 1.1 0.3 Multi-Family Gallons 3.493 3.594 3.721 3.699 3.525 3.486 3.324 3.205 3.158 3.108 3.064 % change -0.8 2.9 3.5 -0.6 -4.7 -1.1 -4.7 -3.6 -1.5 -1.6 -1.4 Commercial Gallons Cons. 4.172 4.329 4.484 4.574 4.370 4.215 4.094 3.927 4.010 4.052 4.092 % change -4.4 3.8 3.6 2.0 -4.5 -3.5 -2.9 -4.1 2.1 1.0 1.0 Industrial Gallons Consumed 1.307 0.906 0.729 0.714 0.496 0.408 0.349 0.400 0.400 0.398 0.396 % change 11.2 -30.7 -19.5 -2.1 -30.6 -17.7 -14.3 14.4 0.1 -0.6 -0.4 Other Water Consumption 6.467 6.390 6.65 6.697 7.064 7.264 6.748 6.326 6.369 6.426 6.509 % change -4.7 -1.2 4.1 0.7 5.5 2.8 -7.1 -6.2 0.7 0.9 1.3 Notes:
1. Water customer meter connections are reported in thousands. 2. El Paso water consumption data are reported in billion gallons.
Table 11: Ciudad Juarez Demographic Indicators
1997 1998 1999 2000 2001 2002 2003 2004 2005 2006 2007
Ciudad Juarez Population 1107.5 1159.5 1207.7 1255.8 1297.4 1338.6 1379.6 1420.3 1464.1 1508.8 1554.9 % change 4.7 4.7 4.2 4.0 3.3 3.2 3.1 2.9 3.1 3.1 3.1 Resident Births 25.799 26.985 32.219 30.971 34.193 29.733 27.680 29.800 32.147 33.525 34.478 % change 0.4 4.6 19.4 -3.9 10.4 -13.0 -6.9 7.7 7.9 4.3 2.8 Resident Deaths 5.438 5.001 5.180 5.390 5.570 5.740 5.920 6.090 6.263 6.438 6.616 % change 7.6 -8.0 3.6 4.1 3.3 3.1 3.1 2.9 2.8 2.8 2.8 Net Migration 29.256 29.960 21.144 22.593 12.912 17.252 19.205 16.963 17.928 17.668 18.237 Juarez Water Meters 214.916 226.773 242.089 257.151 273.954 292.597 309.768 328.582 344.809 361.415 378.407 % change -1.9 5.5 6.8 6.2 6.5 6.8 5.9 6.1 4.9 4.8 4.7
Total Water Consumption 139.246 145.450 148.400 155.631 160.205 149.590 151.348 161.810 165.482 170.477 175.611 % change -1.3 4.5 2.0 4.9 2.9 -6.6 1.2 6.9 2.3 3.0 3.0 Notes:
Table 12: Ciudad Juarez Economic Indicators
1997 1998 1999 2000 2001 2002 2003 2004 2005 2006 2007
Total Maquiladora Emp. 190.506 206.623 218.456 249.380 228.445 200.891 194.642 204.797 217.536 225.139 234.615 % change 10.2 8.5 5.7 14.2 -8.4 -12.1 -3.1 5.2 6.2 3.5 4.2
Juarez Maquiladora Plants 283 258 271 308 307 279 271 287 290 294 300 % change 7.2 -8.8 5.0 13.7 -0.3 -9.1 -2.9 5.9 0.9 1.5 2.0
Average Hourly Wages 2.41 2.52 2.95 3.38 3.84 4.24 3.88 3.56 3.66 3.77 3.89 % change 18.7 4.5 17.0 14.6 13.5 10.5 -8.5 -8.2 2.8 3.1 3.3
Total Value Added 1924.0 2098.4 2576.0 3265.9 3513.6 3415.5 3224.5 3262.7 3481.6 3605.0 3771.8 % change 33.2 9.1 22.8 26.8 7.6 -2.8 -5.6 1.2 6.7 3.5 4.6
Total Formal Sector Emp. 319.855 355.763 390.622 411.485 375.988 340.966 325.212 331.521 354.726 367.450 383.653 % change 11.6 11.2 9.8 5.3 -8.6 -9.3 -4.6 1.9 7.0 3.6 4.4
Total Mfg. Employment 218.678 240.528 262.283 284.675 248.757 215.605 202.376 204.930 222.100 228.443 238.639 % change 11.8 10.0 9.0 8.5 -12.6 -13.3 -6.1 1.3 8.4 2.9 4.5
Commerce Employment 29.249 32.500 35.727 38.204 40.200 38.972 37.669 38.258 40.953 43.205 45.229 % change 10.8 11.1 9.9 6.9 5.2 -3.1 -3.3 1.6 7.0 5.5 4.7
Regulated Industry Emp. 7.562 8.998 10.659 11.675 11.851 11.443 11.264 11.145 11.409 11.768 12.243 % change 10.3 19.0 18.5 9.5 1.5 -3.4 -1.6 -1.1 2.4 3.2 4.0
Services & Other Emp. 64.366 73.737 81.953 76.931 75.180 74.946 73.903 77.188 80.265 84.034 87.542 % change 11.7 14.6 11.1 -6.1 -2.3 -0.3 -1.4 4.4 4.0 4.7 4.2 Notes:
1. Ciudad Juarez employment data are reported in thousands.
2. Ciudad Juarez maquiladora hourly wages are reported in nominal dollar equivalents and include benefits.
3. The maquiladora industry standard work week is 45 hours.
Table 13: Ciudad Chihuahua Economic Indicators
1997 1998 1999 2000 2001 2002 2003 2004 2005 2006 2007
Cd. Chihuahua Population 645.0 653.8 662.7 671.8 694.4 703.4 712.1 720.5 732.6 745.9 759.5 % change 1.4 1.4 1.4 1.4 3.4 1.3 1.2 1.2 1.7 1.8 1.8 Cd. Chihuahua Water Meters 128.457 130.564 132.665 160.621 186.026 202.785 204.707 215.178 225.768 236.438 247.190 % change 0.8 1.6 1.6 21.1 15.8 9.0 0.9 5.1 4.9 4.7 4.5 Total Water Consumption 57.088 58.788 59.935 62.970 64.149 67.816 66.104 63.522 66.161 68.889 71.661 % change 3.8 3.0 2.0 5.1 1.9 5.7 -2.5 -3.9 4.2 4.1 4.0 Total Maquiladora Emp. 37.329 40.661 47.289 51.170 42.990 40.584 43.627 43.346 46.570 48.025 50.638 % change 12.9 8.9 16.3 8.2 -16.0 -5.6 7.5 -0.6 7.4 3.1 5.4 Cd. Chih. Maq. Plants 74 77 82 84 81 74 76 77 80 85 90 % change 10.4 4.1 6.5 2.4 -3.6 -8.6 2.7 1.3 4.3 5.3 6.0 Average Hourly Wages 2.52 2.54 2.97 3.66 4.62 5.13 4.37 4.11 4.22 4.34 4.47 % change 20.4 0.8 16.9 23.3 26.2 11.1 -14.8 -6.1 2.8 2.8 3.0 Total Value Added 438.2 499.3 650.2 859.5 985.3 933.1 961.2 854.6 921.3 972.4 1,037.00 % change 34.8 13.9 30.2 32.2 14.6 -5.3 3.0 -11.1 7.8 5.5 6.6 Total Formal Sector Emp. 151.031 162.605 175.087 185.538 180.359 173.481 168.778 169.441 178.557 186.107 194.548 % change 10 7.7 7.7 6.0 -2.8 -3.8 -2.7 0.4 5.4 4.2 4.5 Total Mfg. Employment 62.293 68.805 79.297 88.860 80.755 74.223 67.044 65.498 70.939 74.926 79.238 % change 8.8 10.5 15.2 12.1 -9.1 -8.1 -9.7 -2.3 8.3 5.6 5.8 Commerce Employment 24.037 25.193 26.466 30.455 32.982 33.944 35.059 34.954 36.697 38.551 40.579 % change 10.9 4.8 5.1 15.1 8.3 2.9 3.3 -0.3 5.0 5.1 5.3 Regulated Industry Emp. 9.390 8.917 8.983 9.199 9.001 8.438 8.302 8.666 8.744 8.876 9.095 % change 2.3 -5.0 0.7 2.4 -2.2 -6.3 -1.6 4.4 0.9 1.5 2.5 Services & Other Emp. 55.311 59.690 60.341 57.024 57.621 56.876 58.373 60.323 62.178 63.755 65.635 % change 12.4 7.9 1.1 -5.5 1.0 -1.3 2.6 3.3 3.1 2.5 2.9 Notes:
1. Ciudad Chihuahua employment data are reported in thousands.
2. Ciudad Chihuahua maquiladora hourly wages are reported in nominal dollar equivalents and include benefits.
3. The maquiladora industry standard work week is 45 hours.
4. Ciudad Chihuahua maquiladora value-added data are expressed in millions of nominal dollars. 5. Ciudad Chihuahua water meter connections are expressed in thousands.
6. Ciudad Chihuahua water consumption is reported in million cubic meters. 7. Ciudad Chihuahua population data are in thousands.
Table 14: Las Cruces Demographic and Other Indicators
1997 1998 1999 2000 2001 2002 2003 2004 2005 2006 2007
Population 169.081 172.057 173.889 174.991 176.635 178.590 182.551 186.095 189.580 193.037 196.687 % change 2.1 1.8 1.1 0.6 0.9 1.1 2.2 1.9 1.9 1.8 1.9
Business Establishments 3.157 3.183 3.260 3.211 3.226 3.245 3.270 3.300 3.459 3.544 3.608 % change 2.4 0.8 2.4 -1.5 0.5 0.6 0.8 0.9 4.8 2.5 1.8
Business Bankruptcies 38 32 46 30 65 61 78 80 60 56 59 % change -22.4 -15.8 43.8 -34.8 116.7 -6.2 27.9 2.6 -25 -6.7 5.4
Personal Bankruptcies 525 643 606 512 626 648 756 747 739 726 730 % change 37.4 22.5 -5.8 -15.5 22.3 3.5 16.7 -1.2 -1.1 -1.8 0.6
NMSU Fall Enrollment 15.067 15.409 15.449 14.958 15.224 15.243 16.174 16.428 16.072 16.451 16.862 % change 2.2 2.3 0.3 -3.2 1.8 0.1 6.1 1.6 -2.2 2.4 2.5 DABCC Fall Enrollment 4.196 4.299 4.471 4.640 4.717 5.178 5.590 6.083 6.570 6.975 7.335 % change 8.1 2.5 4.0 3.8 1.7 9.8 8.0 8.8 8.0 6.2 5.2 Personal Income 2686.5 2909.6 2998.3 3120.0 3460.0 3589.8 3789.1 4016.2 4257.1 4505.3 4768.1 % change 5.3 8.3 3.0 4.1 10.9 3.8 5.6 6.0 6.0 5.8 5.8
Labor and Proprietor Earnings 1633.8 1782.6 1845.8 1891.6 2068.1 2212.7 2384.2 2520.0 2675.1 2824.8 2980.6 % change 5.5 9.1 3.5 2.5 9.3 7.0 7.7 5.7 6.2 5.6 5.5
Real GMP 2.464 2.580 2.688 2.705 2.686 2.901 3.047 3.196 3.364 3.493 3.629 % change 3.6 4.7 4.2 0.7 -0.7 8.0 5.0 4.9 5.2 3.8 3.9
Total Employment 68.724 70.506 72.977 75.557 76.905 79.172 81.195 83.250 85.144 86.981 88.762 % change 1.8 2.6 3.5 3.5 1.8 2.9 2.6 2.5 2.3 2.2 2.0
Notes:
1. The Las Cruces metropolitan economy is comprised by Dona Ana County. 2. Population, college enrollment, and business establishment data are in thousands. 3. All income and earnings data are expressed in millions of dollars.
3. Labor and proprietor earnings encompass wage and salary disbursements, other labor income, and proprietor earnings. 4. Real gross metropolitan product data are expressed in billions of 1996 dollars.
Table 15: Las Cruces Employment
1997 1998 1999 2000 2001 2002 2003 2004 2005 2006 2007
Las Cruces Total Emp. 68.724 70.506 72.977 75.557 76.905 79.172 81.195 83.250 85.144 86.981 88.762 % change 1.8 2.6 3.5 3.5 1.8 2.9 2.6 2.5 2.3 2.2 2.0 Construction Employment 4.483 4.412 4.737 4.599 4.515 4.691 5.033 5.251 5.376 5.486 5.594 % change -2.9 -1.6 7.4 -2.9 -1.8 3.9 7.3 4.3 2.4 2.0 2.0 Manufacturing 3.087 3.262 3.430 3.481 3.368 3.278 3.387 3.411 3.436 3.461 3.474 % change 3.3 5.7 5.2 1.5 -3.2 -2.7 3.3 0.7 0.7 0.7 0.4 State Government 7.264 7.687 7.627 7.972 8.603 8.454 8.575 8.694 8.798 8.921 9.063 % change 1.6 5.8 -0.8 4.5 7.9 -1.7 1.4 1.4 1.2 1.4 1.6 Local Government 8.163 7.072 6.920 6.938 7.039 7.501 7.480 7.530 7.645 7.726 7.814 % change 8.6 -13.4 -2.1 0.3 1.5 6.6 -0.3 0.7 1.5 1.1 1.1 Federal Civilian Govt. 3.78 3.607 3.439 3.538 3.347 3.349 3.401 3.408 3.414 3.439 3.451 % change -0.9 -4.6 -4.7 2.9 -5.4 0.1 1.6 0.2 0.2 0.7 0.4 Military Employment 0.707 0.661 0.661 0.639 0.631 0.628 0.629 0.633 0.636 0.643 0.646 % change -1.0 -6.5 0.0 -3.3 -1.3 -0.5 0.2 0.6 0.4 1.1 0.6
Not Elsewhere Classified 41.240 43.805 46.163 48.390 49.402 51.271 52.690 54.323 55.839 57.305 58.720
% change 1.4 6.2 5.4 4.8 2.1 3.8 2.8 3.1 2.8 2.6 2.5 Notes:
1. Employment data are expressed in thousands.
Table 16: Las Cruces Personal Income
1997 1998 1999 2000 2001 2002 2003 2004 2005 2006 2007
Total Personal Income 2686.5 2909.6 2998.3 3120.0 3460.0 3589.8 3789.1 4016.2 4257.1 4505.3 4768.1 % change 5.3 8.3 3.0 4.1 10.9 3.8 5.6 6.0 6.0 5.8 5.8 Wages and Salaries 1206.0 1301.0 1360.1 1451.6 1509.0 1624.6 1734.5 1819.5 1922.7 2028.7 2137.6 % change 6.5 7.9 4.5 6.7 4.0 7.7 6.8 4.9 5.7 5.5 5.4 Other Labor Income 209.5 219.3 223.1 237.0 251.6 287.2 312.9 335.4 362.2 379.9 398.2 % change 2.3 4.7 1.8 6.2 6.2 14.1 8.9 7.2 8.0 4.9 4.8 Proprietor Incomes 218.3 262.3 262.5 203.1 307.5 300.9 336.8 365.0 390.2 416.2 444.8 % change 3.0 20.2 0.1 -22.7 51.4 -2.2 11.9 8.4 6.9 6.7 6.9 Social Ins. Cntrbns. 89.9 97.7 104.3 107.6 114.6 125.4 134.6 142.0 151.6 161.2 170.9 % change 4.2 8.6 6.7 3.3 6.4 9.5 7.3 5.5 6.8 6.3 6.0 Residence Adjustments 154.2 167.2 186.5 202.4 217.5 219.6 221.0 229.9 240.0 251.7 263.3 % change 12.0 8.4 11.6 8.5 7.5 1.0 0.6 4.0 4.4 4.9 4.6 Dividends, Int., Rent 510.7 545.8 524.6 547.4 612.5 534.2 523.6 560.3 595.9 621.5 654.0 % change 4.9 6.9 -3.9 4.4 11.9 -12.8 -2.0 7.0 6.4 4.3 5.2 Retirement Transfers 386.9 418.6 438.9 483.1 571.9 627.6 659.9 708.1 751.5 812.8 874.2 % change 5.5 8.2 4.9 10.1 18.4 9.7 5.1 7.3 6.1 8.2 7.6 Inc. Maint. Transfers 83.9 84.0 93.5 92.9 94.4 106.7 119.6 125.5 131.8 141.4 152.0 % change -5.8 0.2 11.3 -0.6 1.6 13.0 12.1 4.9 5.0 7.3 7.5 Unemployment Transfers 7.0 9.1 13.3 10.3 10.2 14.3 15.4 14.5 14.5 14.4 14.9 % change 1.0 31.5 45.4 -22.8 -1.1 41.3 7.1 -5.8 -0.1 -0.2 3.2 Notes:
1. All Las Cruces income data are expressed in millions of dollars.
2. Social insurance contributions are deducted from total regional income estimates. 3. Retirement transfer payments include social security and other retirement payments.