A Study of Population Density Distribution Pattern
of Karachi City Using Spatial-Interaction Gravity
Models (Sigm
s
)
1
Shaheen Abbas,
2Muhammad Rashid Kamal Ansari
1
Mathematical Science Research cente, Federal Urdu University of Arts Sciences & Technology, Gulshan-e-Iqbal Campus, Karachi
2 Department of Mathematics Sir Syed university of Engineering
Abstract: Administratively, before the year 2000 Karachi was distributed in five districts. Afterwards, it was divided into eighteen towns. It gave rise to a great controversy that whether the 5-district system is administratively better or the 18-town system. A study of the population-area distribution of the Karachi city with reference to 5-district system and 18-town system is the basis of this study. Hoover Indices (HI) and Lorenz Curves (LC) are particularly utilized for the purpose. Comparing the outcomes we will be in a position to determine that which system is scientifically better. It is found that the patterns for 18-towns are better than the 5-district patterns. The town wise population density can be determined with the help various models. Spatial-Interaction Gravity Models (SIGM) and FGDM are utilized. These models are based on the selection of a suitable pivot point. Pivots can be selected on the basis of being either most dense or less dense. The system is studied with the help of both the approaches and the results are compared to conclude that selecting the least dense town as the pivot leads to better results. Spatial Interaction Model (SIM) is another model which is developed here to determine the population density distribution. It also utilizes the
least pivot. It generates a distance gradient coefficient that determines the probability of change of the population density of the towns. SIM
results confirm the results obtained by applying FGDM. For this purpose Spatial Interaction Logistic Model (SILM) is utilized.
Keywords: Katchi-Abadies, Spatial Interaction Model (SIM), Flatten Gradient Density Model (FGDM), Hoover Indices (HI) and Lorenz Curves (LC)
1. INTRODUCTION
In this study analyze the pattern of Population-Area (Density) distribution of the past and present patterns of administrative distribution of the city of Karachi into subunits (districts and towns). The population-area data is based on 1998 census and is available district wise (5-district) whereas, 2011 estimates are available town wise(18-Town). The 1998 district wise data corresponds to the five districts of Karachi viz. the Central, South, West, East and Malir districts. Whereas, the 2011 town wise data corresponds to the eighteen towns of Karachi viz.
Saddar, Jamshad, Gulshan-Iqbal, Gulberg, Liaquatabad,
ShahFaisal, Malir, Landhi, North Naziamabad, North Karachi, New Karachi, Korangi, Orangi, Lyari, Gadap, BinQasim, Baldia and Kemari[1,5 ,7] . It gave rise to a great controversy that whether the 5-district system is administratively better or the 18-town system. Later, it was converted into a hot political debate. Now, the 5-distric system is again adopted. This study is an attempt to explore the truth on scientific basis irrespective of all political biases. we have determined earlier the district wise
population area distribution pattern of 100 selected KKAS
earlier that in most of the cases the KKAs are embedded in between the settled area and are intermingled on some places so it becomes necessary to study the population-area distribution pattern of the total area as well [5].In this study the total population area distribution pattern of each district as well as each town will be discussed.
In section 2.0 we have determined the best pattern distribution of District and towns by using the Lorenz curves and Hoover index techniques. These analysis are provided the best Population-area Pivotal town on the
basis of DP and LP approaches. In section 2.1, the town wise population density can be determined with the help Spatial-Interaction Gravity Models (SIGMs).we will develop two (Density) Distribution pattern. In section 3 we will selected Densest and least dense such models the Flatten Gradient Density Model (FGDM) and the Spatial Interaction Model (SIM). These models are called modify form of SIGMs. we can forecast the population densities of these towns with the help of
their distances from these pivots and the gradient coefficients
ranging over (0.2, 0.5, 1, 1.5, 2). Appropriation of FGDM we will use such models like Linear Regression Model (LRM), Linear Transformation Exponential Model (LTEM) and Log Linear Model (LLM) all indicate a good distance-density correlation. We will construct SIM for the determination of population density distribution using the LP method. This method itself generates a suitable distance gradient coefficient
.In addition, it determines the probability of change of the
population density of the towns. The SIM results are in conformity with FGDM. To confirm the calculations and forecasts so obtained we shall conclude the results and discussion of the all results develop by above techniques and models in section 4.In section 5, include the conclusion in this communication.
2. Hoover Index and Lorenz Curve (HI and LC) Techniques
Hoover index and Lorenz curve (LC) is a practical examination of population deliberation and graphical interpretation [6 and 7] .Hoover index values has in the perspective of Lorenz curve. Hoover index is described as
H ══ 50
r
i 1
i
p
a
i (1.1)Lorenz curves are comparing the Spatial patterns of the area as well as the population of Districts and Towns [3,4 and 6]. These cumulative percentage areas against cumulative percentage populations are the required Lorenz curves. It also compares the spatial patterns [3, 4 and 6].
We have selected the cumulative percentage of the population –
areas of 18-towns and 5- District (CP1, CP2, , CPn and CA1,
CA2, , CAn ) respectively then the Hoover index
H max CAiCPi (1.2)
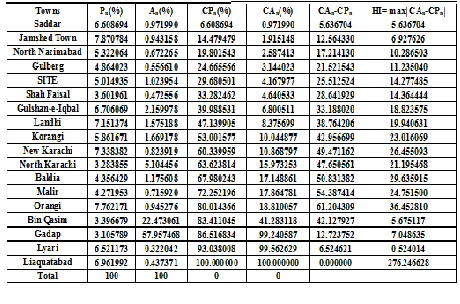
[image:3.612.326.556.372.524.2]In the Tables 1.1- 1.2 depicts the estimate for the
Table 1.1 Districts wise Distribution Pattern of Karachi
The fortitude of the HI (26.9823 and 276.246) of the district and town wide distribution pattern and the respective LC is shown in Figs 1.1-1.2.
[image:4.612.71.266.345.468.2]Figure 1.1. Lorenz Curve (LC) of Five Districts of Karachi
Figure 1.2. Lorenz Curve (LC) of Eighteen Towns of Karachi
In an analysis of the variation of the Lorenz curves from the 45o
line (Lorenz line), district, Central appears to be the densest district and the Malir district comes out to be less dense. The patterns do not appear to be uniform. Lorenz curves of the Lorenz line the town wise population distribution pattern appears to be better than district wise population distribution pattern. This perchance can resolve the current debate regarding the resumption of the system comprising of the district wise distribution of Karachi.
2.1Densest Pivot and Least Pivot (DP and LP) Techniques
DP and LP approaches describe the distribution pattern of eighteen towns of Karachi city with respect to the densest
populated town and least populated towns. Let
D
T1…D
T18bethe density of the eighteen towns
T
1…T
18 respectivelyarranged in the descending order i.e.
D
T1>D
T2>…>D
T18. Thedensest town among
D
T1…D
T18 is the densest pivot (DP)represented by
D
DP(D
T1 in our case). The distances di (
D
DP,D
Ti ) and dj (D
Tj,D
Tk), i, j, k = 1…18 as depicted inTabe: 1.3 are then calculated.
Now (
D
DP,D
Ti, di) describe the town wise DP pattern [image:4.612.314.529.384.537.2]
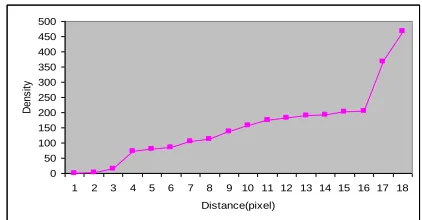
Table 1.3 Town wise Population Density Distribution by DP Technique
as depicted in Fig:1.3 Lyari town with density (467) is the densest town and so is considered as DP.
0 50 100 150 200 250 300 350 400 450 500
0 15 16 14 18 17 10 19 6 20 7 11 8 19 17 22 27 7 Distance(pixel) D e n s it y
Gadap town has lowest density (1.236) and Liaquat Abad town has density (467) and density wise stands next to the DP. Bin Qasim town is at the largest distance (27 pixel) and density (3.485) from the DP whereas, Saddar town density (157) is closest to DP at a distance (6 pixel). The town with least density is considered as the Least Pivot (LP). So in the above set up
18
T
D
is the least pivot LP. LPT is exactly the same as the DPT except that all calculations now will be made with reference to
the LP. (
D
LP,D
Ti, di) describe the town wise LP pattern as [image:5.612.335.546.174.284.2]depicted in Table: 1.4.
Table 1.4 Town wise Population Density distributions by LP Technique
The curves in Fig: 1.4 reveal the pivot i.e the gradient varies inversely as the density.
Fig: 1.4 Town wise Population Density Distribution by LP Technique 0 50 100 150 200 250 300 350 400 450 500
1 2 3 4 5 6 7 8 9 10 11 12 13 14 15 16 17 18 Distance(pixel) D e n s it y
Tables: 1.5 and 1.6 depict the results. As β varies from 2.0 to 0.2, the population density goes on decreasing and the
associated curves finally flatten. In addition, for any value of
the density decreases as we go far from the pivot i.e the gradient varies inversely as the density.
Table 1.5 Population Density Forecasts Based on FGDM by DPT
[image:5.612.60.278.458.614.2]Table1.6 Population Density Forecasts Based on FGDM by LPT
and as the gradient goes on declining consistently i.e. the density flattens (Fig: 1.5).
Fig: 1.5 FGDM of Gadap, Bin Qasim and Lyari Town for β= 2
Overall, the LPT seems to be better than the DPT as in case of LP the associated density curves flatten much as compared to the corresponding curves depicts in fig: 1.6-1.7.
Fig: 1.6 FGDM (DP) For Eighteen Towns of Karachi
Fig: 1.7 FGDM (LP) for Eighteen Towns of Karachi
The above discussion shows a flattening of distance-density curves. Distance-density correlation is further tested by Linear Regression Model (LRM) , Linear Transformation Exponential Model (LTEM)
ln y = x and Log Linear Model (LLM)
ln y = ln x. All models are indicating a good
distance-density correlation. The results are depicted in Table: 1.7.
Testing for β ranging over 2.0, 1.5, 1.0, 0.5, 0.2 we see that in
case of LTEM the largest R2 (the coefficient of multiple
determination) value exceeds 0.97 for β = 1.0, 0.5, 0.2 and it exceeds 0.99 for β = 0.5 and 2.0 in case of LRM and LLM.
3. Spatial Interaction model (SIM)
We will develop Spatial Interaction Model (SIM) to study the population density of 18 towns of Karachi city.
We will develop another model termed as Spatial Interaction Model (SIM) for the determination of population density distribution using the LP method. This method itself generates a
suitable distance gradient coefficient . In addition, it
determines the probability of change of the population density of the towns. The SIM results are in conformity with FGDM. If
r is the radial distance of a town from the pivot and λ is the
respective density gradient, then the spatial relationship of the towns with respect to the pivot can be explored with the help of Spatial Interaction model (SIM) [12, 13, 19 and 20] described as
f
(
r
)
e
r (1.3)where ,the function f can be referred to the probability p (r)
,density d (r) respectively. In fact, we are considering the
variation in probability and density to be exponential. The
values of r used here are obtained with the help of LPT and the
densities are determined by putting these r in SIM. Fig: 1.8
represent Scatter Plots of p (r) and d (r) and Fig:1.9 represent p
(r)- r and d (r)- r SIM curves of eighteen towns of Karachi.
Fig: 1.8 Scatter Plots of probability and Density for Eighteen Towns of Karachi
Fig: 1.9 SIM scatter Plots of probability and Density for Eighteen Towns of Karachi
Spatial Interaction Logistic Model (SILM) which utilizes multiple and logistic regressions [5-15- 16-18]. Combining equations 1.4 and 1.5 for multiple and logistic regressions we can describe SILM by 1.5.
n n
x
x
x
y
1 1
2 2
...
...
(1.4))
log(
log
1p
e
y
p p
(1.5) y ye
e
p
1
(1.6)Where,
x
1,
x
2,,
x
3...
x
nare Explanatory variables,y is log(p)logistic regression
1,
2,
3,...
n Regression coefficientsestimated and p is probability of occurrence .To confirm the
calculations and forecasts so obtained we develop the Spatial Interaction Logistic Model (SILM).It can be noted that probabilities of change for Gadap, Bin Qasim and Malir towns are showing good correlation coefficients(0.91,0.95 and 0.92).
Table:1.8 SIM and SILM Probabilities and Densities analytical Results
Table: 1.8 depicts the results which confirms the significant
changing of probability and densities of occurrence into Gadap,
Bin Qasim and Malir towns. Results obtained by FGDM and SIM were compared with the help of Spatial Interaction Logistic Model (SILM). In view of the respective correlations and residuals of SIM results appear to be better than the FDGM results.
4. RESULT AND DISCUSSION
Lorenz curves from the 45o line (Lorenz line), district Central
appears to be the densest district and the Malir district comes out to be least dense. The patterns do not appear to be uniform, whereas, Lorenz curves from the Lorenz line the town wise population distribution pattern appears to be better than district wise population distribution pattern. We have considered the densest town and the least dense town among all the eighteen towns of Karachi to be the pivot developing the Densest Pivotal Technique and Least Pivotal Technique. By determination of FGDM β varies from 2.0 to 0.2, the population density goes on decreasing and the associated curves finally flatten. In addition,
for any value of the density decreases as we go far from the
pivot i.e the gradient varies inversely as the density. In case of LP for β =2, the densities of Gadap (2.48045E-19), Bin Qasim (6.66992E-16) and Malir (1.55915E-15) towns approach small densities as the gradient goes on declining consistently i.e. the density flattens. Overall, the LPT seems to be better than the DPT as in case of LP the associated density curves flatten much as compared to the corresponding DP curves. The inherent linearity in the FGDM can be gauged from the fact that Linear
Regression Model (LRM) (y = x), Linear Transformation
Exponential Model (LTEM)
(ln y = x) and Log Linear Model (LLM)
(ln y = ln x) all indicate a good distance-density
coefficients(0.91,0.95 and 0.92).the results confirm the significant changing of probability and densities of occurrence into Gadap, Bin Qasim and Malir towns. In analysis of the respective correlations and residuals of SIM results appear to be better than the FDGM results.
5. CONCLUSION
We studied the 5-districts and 18-Towns of Karachi population data base 1998 census data(5-districts)and 2011(18-Towns) was used to study the population-area distribution with the help of Lorenz curves and Hoover indices. We considered variation of district and towns future more, suggest town wise pattern is better than the district wise distribution. We have manipulative the distances between various locations with the help of DP and LP techniques. Using FGDM we observed the flattening of the density gradient for all values of β. The density
curves were extremely flattened in case of LP with =2. So we
used LP with =2 to compare the population density
distribution of the 18 towns of Karachi. It was found that the population density distributions for Gadap (2.48045E-19), Bin Qasim (6.66992E-16) and Malir (1.55915E-15) towns are better than the other towns. we were tested the appropriateness of the FGDM in LP by using Log-Linear Transformation Model (LLTM) and Log-Exponential Transformation Model (LETM). The former one is linear in nature whereas the later non-linear. these indicate a good distance-density correlation. We have developed another model termed as Spatial Interaction Model (SIM) this method itself generates a suitable distance gradient
coefficient . we determines the probability of change of the
population density of the towns. The SIM results are in conformity with FGDM. Results obtained by FGDM and SIM were compared with the help of Spatial Interaction Logistic Model (SILM). The respective correlations and residuals SIM results appear to be better than the FDGM results[5]. We strongly suggest others to consider such extensions of the work presented here.
ACKNOWLEDGEMENT
We thank the City District Government of Karachi (CDGK) and Pakistan bureau of statistics department , for providing the data used in this work.
REFERENCES
[1] .Master Plan Groups Office,Karachi Strategic Development Plan, City District Government Karachi(2007).
[2]. Shaheen Abbas and Muhammad Rashid Kamal
Ansari,Global and Reverse Aspect of Karachi Katchi- Abadies (KKAs),Journal of Basic and Applied sciences vol.7, No.2 (2010) 117-121.
[3]. A.E.Andersson and G.V.G. Ferraro,Accessibility and Density Distributions in Metropolitan Areas: Theory and Empirical Studies, Papers of the regional science Association 52 (2001) 141- 158.
[4]. Fahui Wang and Jean-Michel Guldmann, Simulating Urban population Density with a Gravity-Based Model, Department of Geography,
NorthenIllinious,University,DekalbIL,U.S.A,Depertmentofregio
nalplanning,TheOhiostate University,
coloumbas,socio-econ.sci.vol30,no.4,Elsevier science Ltd(1996)245-256.
[5]. Shaheen Abbas, Urban Dynamics in the prespective of Envirmental Issuse: Karachi as a case study,Federal Urdu university Ph.D thesis(2013).
[6]. Shaheen Abbas,Quantitative aspect of process of Urbanization of Karachi, M.phil thesis(2007).
[7]. Shaheen Abbas, and Muhammad Rashid Kamal Ansari. Pattern of Karachi Katchi Abadies Journal of Basic and Applied sciences vol.6,No.2(2010)1-16.
[8]. Master Plan Department, Karachi Development Authority, Urban Design Unit Researc Report No. 24 (MP/RR/24)
[9]. Report on Land Commitments in Karachi Urban Area (MP/RR/13)
[11]. B.Edmonston,Population Distribution in Amercian Cities,Lexington MA(1997).
[12]. E.S Mills and J.P Tan, A Comparison of Urban Population Density Functions in Developed and Developing Countries, Urban studies 17,(1980)313-321.
[13]. E.S.Mills and J.P.Tan, A Comparison of Urban Population Density(1995).
[14].Kremer, Michael,Population Growth and Technological Change: One Million B.C. to 1990, Quarterly Journal of Economics , 108 (3)(1993)681–716
[15]. A.S Fotheringham, A new set of spatial-interaction models: the theory of competing destinations, Environment and Planning A 15(1983)15-36
[16]. A.S Fotheringham A new set of Spatial-interaction models: The Theory of Competing destinations, Environment and planning A15(1993)15-36
[17].B.Edmonston,Population Distribution in Amercian Cities, Lexington MA(1997).
[18]. Dick, H.W. and Rimmer, P.J,Beyond the third world city: the new urban geography Urban Studies 35 (12):(1998)2303-21.
[19]. C Clark Urban Population Densities, Journal of the Royal Mathematical Society, 114:(1951)490-494
[20]. Jones, G.W Southeast Asia Urbanization and the Growth