M E T H O D
Open Access
Quantification of cell identity from single-cell
gene expression profiles
Idan Efroni, Pui-Leng Ip, Tal Nawy, Alison Mello and Kenneth D Birnbaum
*Abstract
The definition of cell identity is a central problem in biology. While single-cell RNA-seq provides a wealth of
information regarding cell states, better methods are needed to map their identity, especially during developmental transitions. Here, we use repositories of cell type-specific transcriptomes to quantify identities from single-cell RNA-seq profiles, accurately classifying cells fromArabidopsisroot tips and human glioblastoma tumors. We apply our approach to single cells captured from regenerating roots following tip excision. Our technique exposes a previously uncharacterized transient collapse of identity distant from the injury site, demonstrating the biological relevance of a quantitative cell identity index.
Background
Many important events in development and disease involve transitions between different cellular identities, demanding methods that can follow cells as they diffe-rentiate, undergo reprogramming to highly potent states, or transdifferentiate during tissue regeneration. The de-velopment of single-cell RNA-seq technology [1-4] has provided insights into states of individual cells, permit-ting the analysis of cellular trajectories during dynamic periods of development. Single cell analyses have en-abled cellular states to be examined for rare cells in early development as they undergo differentiation [5,6] and during transitions from stochastic to stereotypical states in cellular reprogramming [7].
In order to identify distinct cell types amongst hetero-geneous cell populations, single cell studies have mostly relied on unsupervised clustering techniques [4,6,8]. These techniques utilize RNA-seq profiles of the cells themselves to group the cells based on similarity, after which, in apost hocanalysis, known markers are used to map cell identity onto clusters [8].
However, cell type classification is complicated by the fact that extrinsic factors, such as differences in micro-environments or transient physiological responses, can manifest in large expression changes that contribute to variability between cells. Methods that use
whole-transcriptome correlation are thus biased by physio-logical and other batch effects. Classification is further complicated by biological noise, resulting from stochas-tic, burst-like transcription events [9] and the substantial technical noise inherent in single cell sequencing data [4,10,11]. This technical noise stems from the low num-ber of mRNAs present in single-cell samples and the stochastic nature of the amplification and sample pre-paration process [11,12]. Thus, indices of cell identity must be robust to biological and technical noise in single cell measurements but also sensitive enough to detect weak signals that represent mixed cell character or tran-sitional states.
Comprehensive repositories of cell and tissue expres-sion profiles are a valuable resource for quantifying both cell identity and transitional or mixed cell states using a supervised approach. Such repositories are available for a growing number of systems, including the mouse brain [13,14], human and mouse hematopoietic system [15-17], various cancer types [18], and the plant root [19,20] and shoot [21].
An important consideration that has not been formally addressed is the selection of genes that can serve as cell identity markers for single cell experiments. Tissue and cell type-specific reference libraries are typically do-minated by noisy biological patterns with respect to cell identity [22], where most markers are expressed in mul-tiple cell types, even if they have relatively restricted ex-pression domains or temporal patterns. Extreme filtering of large datasets for highly specific markers reduces the * Correspondence:[email protected]
Center for Genomics and Systems Biology, New York University, 12 Waverly Place, New York 10003, USA
power to detect cell identity in noisy systems, as small numbers of markers make inferences susceptible to noise. Using a large number of markers requires the in-corporation of less specific markers, decreasing the spe-cificity of the identity call. Thus, there is an optimal number of markers for detecting identity, which may vary between experimental systems.
To address these issues, we propose an approach for cell type classification that utilizes sets of informative markers, which are not required to be uniquely expressed in a sin-gle cell type. To select appropriate markers, we adapted an information-theory based approach that analyzes tech-nical and biological variability in expression across envi-ronments and expression domains [22] and utilizes this information to generate an index of cell identity (ICI) for single-cell mRNA-seq samples. The ICI of a given cell rep-resents the relative contribution of each identity as eva-luated from a reference dataset of cell profiles. The use of a quantitative score allows the identification of transitional and chimeric identities. We apply our method to single cells extracted from theArabidopsisroot meristem, which has a wealth of cell type- and developmental stage-specific expression profiles [19,20,23] and to a population of 365 single cells previously isolated from five human glioblast-oma tumors [24]. We show that our method is accurate in
classifying single cells, can optimize marker selection, and performs well with plant and animal datasets.
[image:2.595.59.539.410.677.2]To assess the utility of our method in classifying transi-tional and complex identities, we use it to analyze plant cells isolated from regenerating roots, as plant cells are known to have high levels of developmental plasticity. Roots grow through rapid cell division in growth zones called meristems that contain a stem cell niche. At the center of the stem cell niche is a group of cells with low-mitotic activity known as the quiescent center (QC) [25] (Figure 1A). When the root tip, including the stem cell niche, is completely removed, missing cell types rapidly re-generate from differentiated cells in the remaining stump within 24 to 48 hours [26,27]. As a test of our methods to quantify cell identity, we followed a set of regenerating cells by permanently marking the root stele tissue, an in-ternal tissue that contains early differentiation stages of vascular cell types, and isolating individual, marked cells immediately following tip excision and at 16 hours after excision. Our method detected a transient loss of original identity in cells throughout the stele during the regene-ration process, which is validated by fluorescent marker analysis. These results suggest that regeneration involves a rapid, transient, and widespread loss of tissue identity during the reorganization of the root tip.
Results
Generation of single cell profiles of the root meristem To generate single-cell mRNA-seq profiles from differ-ent tissues in the well-characterized Arabidopsis root, isolatedArabidopsis root tips with fluorescently marked tissues were treated with cell-wall digesting enzymes for approximately one hour, and individual cells were col-lected using a glass mouth pipette (see Materials and methods). This procedure allowed us to visually confirm the presence of a single fluorescent cell in the capillary pipette. Overall, 31 individual cells were collected and processed: 24 QC cells (marked by WUSCHEL-Related Homeobox 5 (WOX5:GFP) [28] and collected in four batches), and 7 stele cells (clonally marked withWOODEN LEG (WOL) WOL:CRE-GR 35S:lox-CFP; Figure 1A) that consisted of three cells collected immediately after re-moving the stem cell niche (0 h post-excision) and four cells collected at 16 h post-tip excision.
To assay technical noise, technical replicates were generated by pooling four of the QC cells, lysing and splitting the mix into four aliquots (Figure 1A). We pre-ferred the use of a small number of cells rather than a diluted sample of many cells, to better represent tech-nical variability due to working with small quantities of RNA at all steps. Each sample was processed and ampli-fied individually according to previous protocols [1], and amplified cDNA was sequenced using the Illumina plat-form to generate 50 bp single-end reads. Overall, 80 to 87% of the reads in each sample mapped to the Arabi-dopsis TAIR10 genome and over 95% of those reads aligned to annotated genes. We did not detect any tran-scripts from intergenic regions since only a few reads aligned to non-annotated regions (<0.01% of all mapped reads), and none of the intergenic read clusters spanned a region greater than 300 bp (data not shown).
Consistent with earlier single-cell RNA-seq studies [10,11], technical variation was highly correlated with expression level (Figure 1B). This technical noise was greatest at low expression levels; however, at high ex-pression levels, variation between individual QC cells is greater than the variation between the pooled-and-split cells (P< 0.05, Kolmogorov-Smirnov test; Figure 1B), suggesting that there is biological variability between QC cells that exceeds the technical variability.
Since we sought to assess cell identity, we first exa-mined the effects of read depth and the transcriptional patterns of known markers in the well-characterized root system. For all subsequent analyses, we combined our single-cell data with 13 previously collected root cells [10]: 6 QC cells (from the same reporter line used in our experiments), and 7 epidermal atrichoblast cells, marked by the reporter GLABRA2(GL2):GFP. Together, this allowed us to assess well-documented markers in three different cell types and also examine batch effects
stemming from sampling the same set of cells in dif-ferent labs.
The number of genes detected in each sample was simi-lar among the stele cells (approximately 14,000 genes/cell) but varied between epidermal cells (11,000 to 18,000 genes/cell). We sequenced some of our QC cells to higher depth to assess the effect of total reads per cell on the number of detectable genes. The analysis showed that the libraries saturate at 5 × 10⁷reads/cell. We detected 4,312 more genes on average than cells sequenced at a depth of less than 5 × 10⁷reads/cell (Figure 1C). This suggests that many more genes are expressed in QC cells than pre-viously detected by shallow sequencing [10]. Furthermore, we detected a large number of transcripts expressed at a low level that show widespread, non-specific transcription, possibly arising from sporadic transcriptional events.
We found several examples of low level marker expres-sion in ‘unexpected’cell types, including the QC marker WOX5 in one stele cell, the stele-specific gene SHORT ROOT(SHR) in four QC cells, epidermal marker expres-sion in one QC cell, and the endodermal/QC-specific gene SCR in six of the seven atrichoblast samples (Figure S1A in Additional file 1). To rule out the possibility that the detection of low-level transcripts arises from ruptured root cells or other contamination during cell isolation, we examined the expression of pollen-specific genes, a set containing many transcripts that are unique to the spe-cialized gamete and are not detected above noise in roots of pooled cells [29]. Indeed, sporadic, low-level expression of many pollen-specific genes was detected (Figure S1B in Additional file 1), further supporting the observation that the sampled cells express non-specific transcripts at low levels.
Additional file 1). Our analysis highlights two important features of single-cell profiles that should be considered when assessing identity from known markers. First, single-cell profiles are likely to display low-level sporadic expression of transcripts from ‘ectopic’ identities, and second, the absence or low-expression of any given cell type-specific marker in these profiles is highly likely.
A method for classification of cell identity
The biological and technical noise associated with the root single-cell profiles suggests that robust classifica-tion of cell identity is not a trivial problem. Indeed, in a hierarchical clustering of pair-wise cell-cell Pearson cor-relation values (Figure 1D), cell profiles grouped mainly according to lab of origin rather than tissue of origin. This outcome makes cell affinity comparisons across labs and experiments problematic.
To establish a method for robust quantification of cell identity, we utilized an extensive reference set of tissue-specific expression profiles collected over a decade of research using cell sorting and profiling with the ATH1 Affymetrix microarray [19,20,23,30-32]. To identify markers which can be used to quantify identity in single cells, we adapted an information theory-based method to calculate Spec values, which represent the amount of information each transcript provides for determining cell identity [22]. From the cell type-specific dataset, we selected microarray profiles mostly from non-overlapping root tissues, collected under a variety of physiological states. These profiles combined publicly available data and new microarray profiles of the QC that were generated for this study (Additional file 2). The use of multiple physiological states to represent single identities ensured a set of robust markers for a given cell identity.
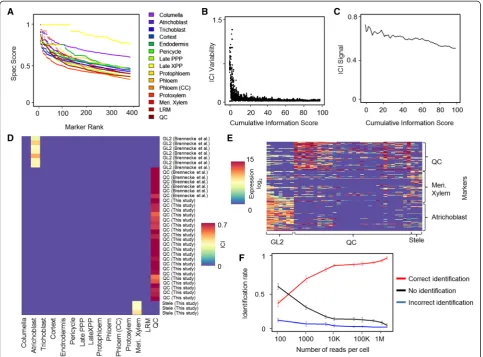
Calculating Spec values requires binning of the data, and we sought to optimize bin selection to obtain robust markers. We assigned transcript levels into one of two bins (high/low expression), separating background and true expression (Materials and methods). We set the cutoff for background expression under the assumption that optimal markers would be expressed at background levels in the majority of cells and true expression would be relatively rare. This routine established a range for the background cutoff, within which we established a precise cutoff by finding the cutoff value that maxi-mized the Spec score (Materials and methods). Using this routine, the algorithm automatically selected mar-kers for which high expression in specific cell types was well separated from the background levels in the ma-jority of cells. Markers were ordered according to their Spec scores, and we determined markers for each of the 15 root tissues by selecting genes with the highest Spec score for a given tissue (Figure 2A; Additional file 3).
Thus, Spec scores provided the ability to rank markers according to their information content on cell identity.
For each tissue, a marker set was chosen to provide the same level of information. Some tissues have more highly informative markers than others (Figure 2A). Therefore, Spec information scores were added until they reached a defined constant, resulting in more dis-tinct tissues having fewer markers than less disdis-tinct tis-sues. In this way, the most highly informative markers are used to diagnose each cell identity and each cell type is given the same level of diagnostic power. Based on these markers, we compute an ICI for each tissue as fol-lows. Using RNA-seq read counts from each single-cell profile, we calculate the mean expression of all genes in the predefined marker set and weight each gene by its Spec score for the particular identity. To down-weight cases of sporadic noisy expression of individual markers and control for false positives, we then adjust the score by the proportion of markers expressed (expression level >0), effectively weighting in favor of identities for which many markers are detectable. For any given single cell that is queried, the procedure then determines an ICI for each cell type that is then normalized to a range of 0 to 1. This method generates a relatively simple index that is robust to low-level sporadic expression (false positives) and fre-quent absence of a given marker (false negatives). To gen-erate a confidence measure, we randomized marker sets of equal size to the original and performed 1,000 permuta-tions to establish a null distribution of ICIs for each cell type (see Materials and methods). We used aP< 0.05 cut-off to determine significant ICI above background.
The above procedure weights the contribution of a marker to the ICI by its pre-determined specificity in predicting a cell type. However, one free parameter in our method is the cumulative information threshold for marker selection, which determines the number of markers used per tissue. We analyzed the effect of this parameter on detection power by varying marker set size. We calculated the ICI for each cell from both our own experiments and the previously generated QC and epidermal cell profiles. Within a wide range of cumula-tive information threshold, representing relacumula-tively small or large marker sets, the procedure was able to classify all cells correctly (Figure S2A in Additional file 1). How-ever, using a very low cumulative information threshold yielded results that were highly sensitive to the thresh-old, as indicated by a local variability measure (hereafter,
determining marker set size, where ranking markers for informativeness permits an optimization between the two effects. The analysis suggests that the cumulative in-formation threshold should be set in a range where ICI variability is stable and minimal, while ICI signal is high. As marker behavior and specificity vary between experi-mental systems [22], the optimal threshold needs to be empirically determined. To maximize robustness and signal strength in the plant dataset, we selected a cumu-lative information threshold value of 20, which was used for the rest of the study (Additional file 3).
Using this procedure, all cells picked using the highly specific QC marker WOX5:GFP were identified as QC regardless of the lab that generated them, showing the method is robust to batch effects (Figure 2D). The three stele cells scored the highest for meristematic xylem
[image:5.595.57.541.89.446.2]of the markers identified by our algorithm (information threshold of 20,258 markers), cells could be separated by tissue, but noise and batch effects were still very apparent. This noise was evidenced by QC cells occupying a large space, making it difficult to assign them to a coherent group (Figure S3A in Additional file 1). In contrast, using the ICI vectors, identities were clearly distinct, while batch and lab-dependent effects were no longer evident (Figure S3B in Additional file 1).
Sensitivity to read depth and chimeric states
Single-cell studies are now being generated for hundreds and thousands of cells [8], which means each cell is se-quenced at a very shallow depth. To assay the sensitivity of our method at different read depths, we generated shallow read depth samples by resampling and deter-mined the rates of correct calls for the 40 single root cells. Our method was sensitive enough to classify the correct tissue among the 15 possible cell types at high confidence 87% of the time with 10,000 reads/cell and 91.3% of the time with 500,000 reads/cell (Figure 2F). Importantly, there were very few incorrect classifications even at very shallow read depths (1.75% and <0.5% at 10,000 and 50,000+ reads/cell, respectively; Figure 2F). These results demonstrate the feasibility of our method in highly multiplexed experiments with shallow sequen-cing depths.
In addition, one promising application for single-cell transcriptomics is the ability to track cells as they undergo differentiation or cellular reprogramming and to identify chimeric, transitional states or prior state memory. To test our algorithm on mixed cell states, we generated mixed cell profiles by randomly sampling reads from either QC and atrichoblast cells or QC and meristematic xylem cells. Using a stringent threshold, our algorithm identified both cell types in a simulated single cell in 62% and 21% of the cases in QC-atrichoblast and QC-meristematic xylem mixed cells, respectively (Figure S4 in Additional file 1). As chimeric identity dilutes both identities, the lack of any significant identity justifies a lower threshold to explore potential mixed cell states. Indeed, lowering the threshold resulted in detection of multiple identities in 75% and 57% of the simulated QC-atrichoblast and QC-meristematic xylem mixed cells, respectively (Figure S4 in Additional file 1). The rate of false positives at a low threshold was small, as non-pooled cell identities were detected at a low proportion of 2 to 3% (Figure S4 in Additional file 1).
Classification of single cells from human glioblastoma tumors
To test our method in a different system, we utilized a previously profiled collection of 365 cells from five hu-man glioblastoma tumors, sequenced at low depth [24]. Using The Cancer Genome Atlas (TCGA) whole tumor
transcriptome data from four subtypes of glioblastoma [34], we identified high information markers among these tumor types. Overall, glioblastoma subtype mar-kers had significantly lower Spec scores than root tissues (Figure 3A; Additional file 4), indicating a significant overlap in transcript expression between the different subtypes. Previous analysis by TCGA identified a set of 840 marker genes that can differentiate between the sub-types [34]. However, our data show that while part of the TCGA marker set has relatively high Spec scores, a substantial part of the set has low scores (Figure 3B), suggesting that a more optimal subset could be identi-fied. In comparison with the plant dataset (Figure 2B,C), the ICI variability decreased more rapidly for the glio-blastoma dataset while ICI signal remained stable with increasing marker set size (Figure 3C,D), indicating a wide possible range for an optimal marker number.
A previous attempt to classify the cells using the mean expression of the TCGA markers could identify 59% of the cells [24] (Figure 3E). To identify an optimal marker number, we measured the number of classified cells while varying cumulative information thresholds. Increasing the cumulative information threshold consistently improved the number of identified cells of both single and mixed fates, and could surpass the performance of previous methods [24] (Figure 3E). Using a cumulative information threshold of 110 (1,368 marker genes; Additional file 4), our method was able to classify 72% of these cells (Figure 3E).
Both methods show that all tumors were of mixed iden-tities with cells representing different subtypes at various proportions [24] (Figure 3F,G). The proportions of the subtypes in the tumors predicted by our method were similar to those previously verified [24], with the exception of the identification of a previously uncharacterized neural population in tumor MGH26 (Figure 3F,G).
Overall, this analysis shows that the ICI method is broadly applicable and can provide formal methods to optimize marker set selection for the diagnosis of cell identity. In particular, ranking markers based on Spec values allows the use of many informative markers, opti-mizing use of previously published marker sets [34].
assign the cell type of origin of the marked cells during tis-sue regeneration [27].
At a high significance threshold, stele cells from the regenerating roots had no significant identity (among the 15 cell types queried; Figure 4C), indicating a quanti-fiable loss or decrease in cell identity. When the sig-nificance threshold was relaxed, meristematic xylem was still the highest identity in these cells (Figure 4D), although the ICIs were significantly reduced (Student’s t-test, P< 0.05; Figure 4E). Indeed, expression of most meristematic xylem markers was reduced, although still present (Figure S5A in Additional file 1). In addition, expression of individual known stele and vascular diffe-rentiation markers, such as the stele-specific vascular developmental regulator WOL, was reduced in the re-generating cells (Figure S5B in Additional file 1). The analysis suggests internal root tissue undergoes a stage of identity loss during the regeneration process. As cells are collected following disassociation, their exact spatial location cannot be confirmed. However, we inferred from these single-cell profiles and previous work that the cells selected were not in the distal end of the cut
root stump, as we have shown that these cells near the injury site undergo rapid reprogramming [27]. Thus, the result leads us to hypothesize that tissues relatively dis-tant to the cut site undergo an attenuation of identity, even though they are possibly outside of the region where cell identities rapidly reprogram.
To corroborate these results, we examined the ex-pression of a labile WOL:GFP marker during the re-generation process. In agreement with our single-cell data, expression of WOL is transiently down-regulated throughout the regenerating stele at 16 hours and re-covers following the regeneration of the root at 48 hours following excision (Figure 4F-I). We also examined the markers S4 and S32, which mark the internal meristem-atic xylem and protophloem tissues, respectively [30]. Both markers were down-regulated throughout the me-ristem by 16 h post-excision (Figure 4J-O). The signal for both markers was still visible at low levels, indicating partial conservation of identity.
[image:7.595.58.540.90.385.2]fate in regenerating tissue, with cells showing signs of a collapse of original cell identity during regeneration. Overall, our techniques provide an approach to quantify cell identity in single cells in a robust and sensitive man-ner that should be useful in regeman-neration and repro-gramming studies.
Discussion
Single-cell RNA-seq can be used to gain insights into cel-lular trajectories and intermediate differentiation steps that are otherwise obscured by bulk analyses. However, classifi-cation of cell state is a complex problem due to biological variability among cells and technical noise generated by small-scale amplification techniques. Furthermore, bio-logical replicates are not possible, and methods are still needed to assess the certainty of classification. Here we introduce a formal approach to identify the state of a cell and generate a measure of confidence in the classification of a single or mixed cell identity. Importantly, each cell is diagnosed independently of others based on a stable refe-rence set, so the classification is not fit to a particular ex-periment and does not change as more cells are sampled. In addition, our method is robust to batch effects that make separate experiments otherwise difficult to compare.
[image:8.595.58.539.89.369.2]The composition of the marker set used for cell type classification is an important parameter that has not been formally addressed. The biological and technical noise associated with single cell experiments means that the presence or absence of a marker is a probabilistic event. An intuitive solution to the problem is the use of multiple markers for each cell identity to‘vote’on classi-fication, as we formalize here in a straightforward index. However, while many markers can be used, not all markers are equally specific, implying tradeoffs when setting the composition of the marker set. For example, intuitively, the presence of several highly specific mar-kers provides a clear diagnosis. However, such an ap-proach would frequently fail in single cell experiments because, as we showed by using several datasets from different labs, including our own, any given marker may be absent in a cell or possibly expressed in an ‘ectopic’ cell. Such anomalies, possibly stemming from sporadic transcription events, are averaged out in pooled cells and thus escape detection. On the other hand, increasing robustness by including more markers diminishes power since markers themselves vary in their informativeness of cell identity. We could observe these tradeoffs in our dataset using a gold standard set of handpicked cells Figure 4Quantitative loss of identity in regenerating root vascular cells. (A,B)InducedWOL:CRE-GR 35S:lox-CFProots, immediately after
(A)and 16 hours(B)following root tip excision.(C,D)Significant ICIs (P< 0.05(C)andP< 0.2(D)) for the four cells isolated from the regenerating root shown in(B). CC, Companion Cell; LRM, Lateral Root Meristem; PPP, Phloem Pole Pericycle; XPP, Xylem Pole Pericycle.(E)Meristematic xylem ICIs for stele cells.(F-O)Confocal images ofWOL:GFP(F-I), S4(J-L)and S32(M-O)plants before(F,J,M), immediately after(G,K,N), and at 16
from well-characterized cell types. When using a low number of markers (at a low cumulative information threshold), we observed highly variable ICIs and low performance in calling cell identity. In contrast, using high cumulative information decreased the difference in ICI over background noise and similarly decreased performance.
We can address this tradeoff systematically using our approach, which quantifies the predictive value (infor-mation) of markers on cell identity. We determine cell identity using a scoring index that is weighted by the in-formation value of the marker. This approach provides robustness by enabling the use of large marker sets while it minimizes the loss of power by down-weighting less informative markers. In addition, the cutoff for cumula-tive information can be optimized using ICI variability and ICI signal over increasing marker set sizes. Such analysis does not require a gold standard dataset and can be optimized using experimental data. Overall, this process provides a systematic approach to using a large marker set to increase certainty in cell identity calls without loss of power to detect weak signals. We note that the current limited availability of high-quality single-cell datasets precludes the testing of our method in the full set of scenarios to which it can be applied, and we suggest that future assessment of the method will further clarify its performance.
One application of these methods is determining cell identity during dynamic developmental transitions. Key questions include: How do cells transition from one cell type to another in order to reform injured tissue, and, what is the relative role of dedifferentiation and transdif-ferentiation in this phenomena [35-37]?
Single cell transcriptomics combined with identity analysis tools can address these questions. The challenge in this problem is confidently distinguishing cell fate transition from natural variability and noise. Unsuper-vised techniques are not generally designed for discrete or mixed cell classification, as we show that batch effects and other sources of variability do not lead to clear boundaries between clusters of different cell identities. In addition, mixed cell fates would not be expected to necessarily occupy the intermediate space between known cell types. The approach we developed can be used to quantify the loss of identity and to detect the presence of multiple identities in a single cell profile.
In single cells obtained from meristematic vascular tissue of regenerating roots, we were able to detect a previously uncharacterized transient state of identity loss during the regeneration process. These same cells showed a transient loss of expression ofWOL, a regulator of the plant response to the phytohormone cytokinin [33]. The loss of identity detected was in both meristematic xylem and phloem tissues, and analysis of fluorescent markers
corroborated a meristem-wide transient loss of identity in the vascular tissue. This loss of identity may be required to re-establish the differentiation gradient that is normally present in the root meristem and is disrupted by the de-capitation of the tip. Although the nature of this transient state requires further investigation, the result illustrates how the ability to sensitively map and quantify changes in cell identity permits high resolution analysis of tissue dynamics during developmental processes. Overall, the ability of our method to quantify multiple identities in single cells makes it a useful tool for future studies in mul-tiple experimental systems.
Conclusions
We present an information-based method for quantifica-tion of cell identities using available cell-type repositories and single-cell RNA-seq profiles. Using our method we identified high-information markers for the Arabidopsis root and for human glioblastoma subtypes and used them to classify single cells isolated from theses tissues with high fidelity. Using the method, we identified intermediate states occurring during root regeneration.
Material and methods
Generation of marker lines
An inducible, stele-specific lineage marking line (pH7WOL: CRE-GR) was generated using a modified CRE:LOX system, where CRE recombinase driven by the well-characterized stele promoter (WOL) is sequestered to the cytoplasm by fusion to the glucocorticoid receptor (GR). Upon dexamethasone (DEX) induction, the recombinase excises a terminator flanked by LOX sites to allow the constitutively active plant promoter CaMV 35S to drive fluorescent reporter (ER-CFP), permanently marking the induced cell and its daughters. Constructs were intro-duced into Col-0 backgrounds. The marker lines S4 and S32 were described previously [30].
Microscopy
For confocal imaging, plants were briefly stained in pro-pidium iodide (PI), mounted in water, and imaged using a Leica SPE confocal microscope with × 20 and × 63 magnification and 405 nm, 488 nm, and 561 nm lasers to excite cyan fluorescent protein (CFP), green fluo-rescent protein (GFP), and PI, respectively. Voltage and gain settings were held constant for each marker during the time series.
WOX5:GFP signal is apparent in emerging lateral roots. WOL:CRE-GR 35S:lox-CFP plants were transferred at 6 days after stratification to induction plates (1 × MS, 0.5% sucrose, 10 μM DEX) for 24 h and then returned to 1 × MS plates. Root tips were then cut as described previously [27] at a distance of 130 μm above the colu-mella, removing the QC and surrounding stem cells, and returned to 1 × MS plates for 16 h. Control plants were left on 1 × MS plates and cut at 130μm just before har-vesting. To isolate the root tips, roots, all grown on a single plate, were subjected to a 10 to 15 minute treat-ment in cell wall digestion solution, as previously de-scribed [38], to dissociate the root tips containing the meristem. Those tips were collected and subject to further treatment for a total of approximately 1 hour. Fluorescently marked cells were isolated under a fluo-rescence dissecting scope and collected with a glass mouth pipette. To verify single cells were picked, marked cells were transferred to a clean dish, re-pipetted into phosphate-buffered saline, and transferred into an approximate volume of 1 μl of lysis solution. cDNA synthesis and amplification were then preformed as described by [1]. Amplified cDNA was sheared with microTUBs using a CovarisTMS2 System, and the library was prepared using TruSeq DNA Sample Preparation Kit (low throughput protocol) and sequenced on an Illumina HiSeq 2000, generating 50 bp single end reads. Resulting reads were aligned to theArabidopsis genome (TAIR10) using Bowtie2 (parameters:–local -k 6). Gene expression values were calculated by summing the num-ber of reads aligning to any annotated gene exon, using ngsutils. Reads aligning to more than one genomic loca-tion were counted as partial read. Genes with coverage of less than 200 bp were removed from downstream analysis. Number of reads per gene was normalized to library depth and log2 transformed. For Cel-Seq cells, 40 single QC cells were isolated fromWOX5:GFP plants and processed according to [3]; data were deposited in Gene Expression Omnibus. Analysis was performed using R 2.15.2.
Hierarchical clustering and multidimensional scaling Hierarchical clustering was performed using Pearson correlation scores for log2transformed normalized read counts. Multidimensional scaling was performed using the distance measure (1 - R, where R is the Pearson cor-relation score between two samples).
Spec value calculation
Spec score for each marker and tissue were identified ac-cording to the algorithm described in [22], using two expression classes and the MAS5 processed dataset of microarray experiments detailed in Additional file 2. The Spec algorithm allows the identification of absence
markers in which the given tissue is characterized by lack of expression, designated using negative Spec value. As these markers are not used by our algorithm, nega-tive Spec scores were set to 0. For the plant dataset, we filtered genes shown to be induced by the cell wall di-gestion process [19] or constitutively highly expressed (median >250). Calculating Spec scores requires binning of the data, but does not prescribe an optimal method to determine bin size [22]. To identify optimal bin sizes, we sought to find the cutoff between background noise and true expression. Since the data were too scarce to infer a distribution and an inflection point, we used an empir-ical method in which, for each gene, we binned its ex-pression across the samples into l equal sized bins, and designated the number of samples in each bin as (o1…l).
We calculated the null expectation for the number of samples in each bin (e) as simplye=M/l, where M is the number of total measurements made among all cell types and replicates (M = 98 for plant; M = 173 for TCGA data). We then identified the highest bin (m) which satisfies om< e, signifying the transition from abundant noise to high expression. Following the identi-fication of the cutoff region, we calculated the precise background cutoff value by finding the value in the pre-ceding bin that maximized the Spec score.
In both the root data and the TCGA dataset,lwas set to 10 but results were robust to a range of values of this free parameter. We also set an upper limit on the bin that marked the transition from noise to true expression (u), essentially filtering genes that showed a small diffe-rence between background and true expression (u= 3 for plant data;u= 10 for TCGA data).
To select tissue markers, genes were ordered by decreas-ing Spec score and their cumulative sum was calculated. Markers having the identical Spec score were secondarily ordered by decreasing mean expression in the samples over the background. Top-ranked markers included in the cu-mulative Spec sum under the threshold (20, unless noted otherwise in the text), and with a minimal tissue Spec score of 0.15, were assigned as tissue markers.
Index of cell identity calculation
For each cell, a set of ICI scores, one for each tissue (t), was calculated as follows.
For each marker gene (g), the normalized fragment per million (FPM) expression value (eg) was multiplied by
the Spec score for the particular tissuesg,t, and the mean
of all weighted tissue markers was further weighted by the proportion of markers present (expression > 0):
CIMt¼ Xnt
g egsg;t
nt
Xnt
g expressed gð Þ nt
To determine significance, a population of background ICIs was generated by selecting an equal number of ran-dom genes as markers and calculating ICIs for 1,000 permutations. ICIs were considered as significant if they were higher than the top 5% of permutations, unless noted otherwise. ICIs were normalized such that the sum of ICIs for each cell was equal to 1. If more than one identity was significant at the 0.05 threshold level, the cell was considered as chimeric or mixed identity, at the proportions indicated by the ICI scores. If none of the ICIs were significant at the 0.05 level, cell identity was unclassified. All scripts were coded in R 2.15.2, and source code is provided as Additional file 5.
ICI variability and ICI signal
To calculate ICI variability and ICI signal, the ICI vector for each cell was calculated as detailed above, using a cu-mulative information threshold that varied between 5 and 100 at increments of 1. Variability at information threshold of i was measured as the Euclidean distance between the ICI vectors for information threshold of iand i+ 1. ICI variability for all cells was plotted on the same graph. Signal at information threshold ofiwas the mean maximal ICI value for all cells at that information threshold. Source code is provided as Additional file 5.
Glioblastoma and mouse embryonic stem cell data analysis
Single cell mRNA-Seq data for mouse embryonic stem cells were obtained from the Gene Expression Omnibus (accession GSE54695) [11], omitting cells with fewer than 1,000 detected genes. A unified scaled dataset for four subtypes of glioblastoma tumors was downloaded from [34] and was used without additional processing to determine Spec scores, as described above. For the glio-blastoma tumor data, normalized, scaled single-cell data were obtained from the Gene Expression Omnibus (accession GSE57872) [24]. To obtain FPM values, downloaded data were converted back to absolute values and renormalized by dividing each gene by its mean ex-pression. ICIs were calculated as described above.
Data access
Data have been submitted to Gene Expression Omnibus, accession numbers GSE46226 (single cell data), GSE64381 (CEL-SEQ profiles) and GSE64253 (QC profiling).
Additional files
[image:11.595.303.536.400.740.2]Additional file 1: Figure S1.Variability in marker expressions in single cells.Figure S2.Effect of number of markers used on identity specificity.
Figure S3.The effect of Spec marker selection and the ICI transformation on the affinity of single cells using multidimensional scaling analysis.
Figure S4.Identity of mixed cells.Figure S5.Expression of vascular markers in regenerating stele cells.
Additional file 2: Table S1.Datasets used to generate root tissue markers.
Additional file 3: Table S2.Spec scores for root tissue markers.
Additional file 4: Table S3.Spec scores for glioblastoma markers.
Additional file 5:R implementation of the algorithm. Abbreviations
CFP:cyan fluorescent protein; DEX: dexamethasone; FPM: fragments per million; GFP: green fluorescent protein; GR: glucocorticoid receptor; ICI: index of cell identity; PI: propidium iodide; QC: quiescent center; TCGA: The Cancer Genome Atlas.
Competing interests
The authors declare that they have no competing interests.
Authors’contributions
IE and KDB designed the study and developed the method. PI and IE performed the experiments. IE analyzed the data. TN and AM contributed materials. IE and KDB wrote the paper. All authors read and approved the final manuscript.
Acknowledgments
We thank Dan Tranchina for helpful discussion and members of the Birnbaum lab for comments. Funding for this project was provided by the NIH R01 GM078279 to KDB, and EMBO LTF185-2010 to IE.
Received: 19 September 2014 Accepted: 31 December 2014
References
1. Tang F, Barbacioru C, Wang Y, Nordman E, Lee C, Xu N, et al. mRNA-Seq whole-transcriptome analysis of a single cell. Nat Methods. 2009;6:377–82. 2. Ramsköld D, Luo S, Wang Y-C, Li R, Deng Q, Faridani OR, et al. Full-length mRNA-Seq from single-cell levels of RNA and individual circulating tumor cells. Nat Biotechnol. 2012;30:777–82.
3. Hashimshony T, Wagner F, Sher N, Yanai I. CEL-Seq: single-cell RNA-Seq by multiplexed linear amplification. Cell Rep. 2012;2:666–73.
4. Islam S, Kjällquist U, Moliner A, Zajac P, Fan J-B, Lönnerberg P, et al. Characterization of the single-cell transcriptional landscape by highly multiplex RNA-seq. Genome Res. 2011;21:1160–7.
5. Guo G, Huss M, Tong GQ, Wang C, Li Sun L, Clarke ND, et al. Resolution of cell fate decisions revealed by single-cell gene expression analysis from zygote to blastocyst. Dev Cell. 2010;18:675–85.
6. Treutlein B, Brownfield DG, Wu AR, Neff NF, Mantalas GL, Espinoza FH, et al. Reconstructing lineage hierarchies of the distal lung epithelium using single-cell RNA-seq. Nature. 2014;509:371–5.
7. Buganim Y, Faddah DA, Cheng AW, Itskovich E, Markoulaki S, Ganz K, et al. Single-cell expression analyses during cellular reprogramming reveal an early stochastic and a late hierarchic phase. Cell. 2012;150:1209–22. 8. Jaitin D, Kenigsberg E, Keren-Shaul H. Massively parallel single-cell RNA-seq
for marker-free decomposition of tissues into cell types. Science. 2014;343:776–9.
9. Raj A, Peskin CS, Tranchina D, Vargas DY, Tyagi S. Stochastic mRNA synthesis in mammalian cells. PLoS Biol. 2006;4:1707–19.
10. Brennecke P, Anders S, Kim JK, Kołodziejczyk AA, Zhang X, Proserpio V, et al. Accounting for technical noise in single-cell RNA-seq experiments. Nat Methods. 2013;10:1093–510.
11. Grün D, Kester L, van Oudenaarden A. Validation of noise models for single-cell transcriptomics. Nat Methods. 2014;11:637–40.
12. Reiter M, Kirchner B, Müller H, Holzhauer C, Mann W, Pfaffl MW. Quantification noise in single cell experiments. Nucleic Acids Res. 2011;39:e124.
13. Okaty BW, Sugino K, Nelson SB. Cell type-specific transcriptomics in the brain. J Neurosci. 2011;31:6939–43.
15. Heng TSP, Painter MW. The Immunological Genome Project: networks of gene expression in immune cells. Nat Immunol. 2008;9:1091–4.
16. Novershtern N, Subramanian A, Lawton LN, Mak RH, Haining WN, McConkey ME, et al. Densely interconnected transcriptional circuits control cell states in human hematopoiesis. Cell. 2011;144:296–309.
17. Shay T, Kang J. Immunological Genome Project and systems immunology. Trends Immunol. 2013;34:602–9.
18. The Cancer Genome Atlas. http://cancergenome.nih.gov/.
19. Birnbaum KD, Shasha DE, Wang JY, Jung JW, Lambert GM, Galbraith DW, et al. A gene expression map of the Arabidopsis root. Science. 2003;302:1956–60.
20. Brady S, Orlando D, Lee J, Wang J. A high-resolution root spatiotemporal map reveals dominant expression patterns. Science. 2007;801:801–6. 21. Yadav RK, Girke T, Pasala S, Xie M, Reddy GV. Gene expression map of the
Arabidopsis shoot apical meristem stem cell niche. Proc Natl Acad Sci U S A. 2009;106:4941–610.
22. Birnbaum KD, Kussell E. Measuring cell identity in noisy biological systems. Nucleic Acids Res. 2011;39:9093–107.
23. Nawy T, Lee J-Y, Colinas J, Wang JY, Thongrod SC, Malamy JE, et al. Transcriptional profile of the Arabidopsis root quiescent center. Plant Cell. 2005;17:1908–25.
24. Patel A, Tirosh I, Trombetta J. Single-cell RNA-seq highlights intratumoral heterogeneity in primary glioblastoma. Science. 2014;344:1396–401. 25. Dolan L, Janmaat K, Willemsen V, Linstead P, Poethig S, Roberts K, et al.
Cellular organisation of the Arabidopsis thaliana root. Development. 1993;119:71–84.
26. Feldman LJ. The de novo origin of the quiescent center regenerating root apices of Zea mays. Planta. 1976;128:207–12.
27. Sena G, Wang X, Liu H-Y, Hofhuis H, Birnbaum KD. Organ regeneration does not require a functional stem cell niche in plants. Nature. 2009;457:1150–310.
28. Sarkar AK, Luijten M, Miyashima S, Lenhard M, Hashimoto T, Nakajima K, et al. Conserved factors regulate signalling in Arabidopsis thaliana shoot and root stem cell organizers. Nature. 2007;446:811–4.
29. Honys D, Twell D. Comparative analysis of the Arabidopsis pollen transcriptome. Plant Physiol. 2003;132:640–52.
30. Lee J-Y, Colinas J, Wang JY, Mace D, Ohler U, Benfey PN. Transcriptional and posttranscriptional regulation of transcription factor expression in Arabidopsis roots. Proc Natl Acad Sci U S A. 2006;103:6055–60. 31. Dinneny J, Long T, Wang J, Jung J. Cell identity mediates the response of
Arabidopsis roots to abiotic stress. Science. 2008;320:942–510. 32. Gifford ML, Dean A, Gutierrez RA, Coruzzi GM, Birnbaum KD. Cell-specific
nitrogen responses mediate developmental plasticity. Proc Natl Acad Sci U S A. 2008;105:803–10.
33. Mähönen AP, Bonke M, Kauppinen L, Ma AP, Riikonen M, Benfey PN. A novel two-component hybrid molecule regulates vascular morphogenesis of the Arabidopsis root. Genes Dev. 2000;14:2938–43.
34. Verhaak RGW, Hoadley KA, Purdom E, Wang V, Qi Y, Wilkerson MD, et al. Integrated genomic analysis identifies clinically relevant subtypes of glioblastoma characterized by abnormalities in PDGFRA, IDH1, EGFR, and NF1. Cancer Cell. 2010;17:98–110.
35. Birnbaum KD, Sánchez AA. Slicing across kingdoms: regeneration in plants and animals. Cell. 2008;132:697–710.
36. Jopling C, Boue S, Izpisua Belmonte JC. Dedifferentiation, transdifferentiation and reprogramming: three routes to regeneration. Nat Rev Mol Cell Biol. 2011;12:79–89.
37. Sugimoto K, Gordon SP, Meyerowitz EM. Regeneration in plants and animals: dedifferentiation, transdifferentiation, or just differentiation? Trends Cell Biol. 2011;21:212–8.
38. Birnbaum KD, Jung JW, Wang JY, Lambert GM, Hirst JA, Galbraith DW, et al. Cell type-specific expression profiling in plants via cell sorting of protoplasts from fluorescent reporter lines. Nat Methods. 2005;2:615–9.
Submit your next manuscript to BioMed Central and take full advantage of:
• Convenient online submission
• Thorough peer review
• No space constraints or color figure charges
• Immediate publication on acceptance
• Inclusion in PubMed, CAS, Scopus and Google Scholar
• Research which is freely available for redistribution

![Figure 3 Marker analysis and identity scores of cells from glioblastoma tumors. (A,B) Spec scores for the glioblastoma markers identifiedby our algorithm (A) and for the TCGA markers previously published [34] ordered by rank](https://thumb-us.123doks.com/thumbv2/123dok_us/8647100.866570/7.595.58.540.90.385/analysis-identity-glioblastoma-glioblastoma-identifiedby-algorithm-previously-published.webp)


