©IJRASET 2015: All Rights are Reserved
539
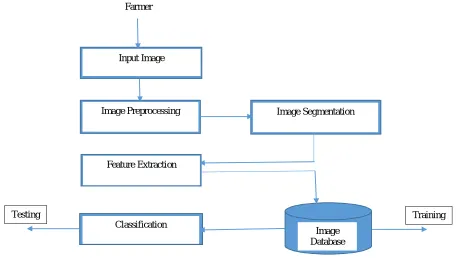
Department of Electronics and Telecommunication, Faculty of Engineering & Technology, SSGI, Bhilai, ChhattisgarhAbstract—Leaf diseases weaken trees and shrubs by interrupting chemical change, the method by that plants produce energy that sustains growth and defense systems and influences survival. Problem can be resolved when provided with the remedial action in time and this can be achieved with the introduction of technology in the system. This paper presents an improved method for leaf disease detection using an adaptive approach. The algorithm presented used to preprocess, segment and extract information from the preprocessed image. The segmentation is done using K-Means algorithm to achieve different clusters. The shape feature and color texture features are extracted from the affected reasons and send to the SVM classifier. The detection task performed and experimental results prove that the proposed method is efficient in reaching convergence. Keywords—Image Processing; Leaaf Diseases; Blackspot.
I. INTRODUCTION
Plants can be damaged by infectious microbes such as fungi, bacteria, viruses, and nematodes. They can also be damaged by noninfectious factors, causing problems that can collectively be termed "abiotic diseases" or "abiotic disorders"[4]. Home gardeners are justifiably concerned when foliage of their yard trees become diseased, especially when these diseases cause defoliation, twig and limb death, and perhaps death of a tree that has been defoliated several years in a row [5]. Concerned home gardeners need information of disease and how to prevent or otherwise control leaf diseases. There are basically three leaf diseases that we are focusing: Blackspot, Anthracnose and Rust. Blackspot is a fungal disease caused by Diplocarpon rosae. It starts out by producing small black spots on the upper leaf surfaces. It's important to note that the edges of the spots are feathery. Leaves lower down on the bush are affected first. As the disease progresses, the feathery spots enlarge and often become ringed with yellow, then whole leaves turn yellow and drop from the plant. Where blackspot is severe, plants die due to defoliation. The blackspot fungus becomes active during warm, wet weather and requires free water on the leaves for 7 hours at 75 degrees to germinate. Symptoms will appear in approximately 3 days. The dry Southwest has few problems with blackspot while coastal areas that have very high humidity and warm temperatures often have disease outbreaks. As with mildew, prevention is your first line of defense[6]. Anthracnose is a fungal disease that often confused with blackspot because it also produces black spots on leaves. However, anthracnose spots have defined edges whereas blackspot edges are feathery. In the early stages of the anthracnose disease, the circular spots are red and quite small: 1/16- to- 1/8-inch in diameter. As the disease progresses, the spots enlarge and the centers turn light brown with a dark red ring around them. Eventually, the center drops out leaving a hole. In severe cases, the entire leaf will turn yellow and fall off.
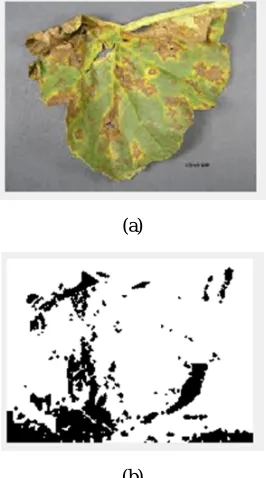
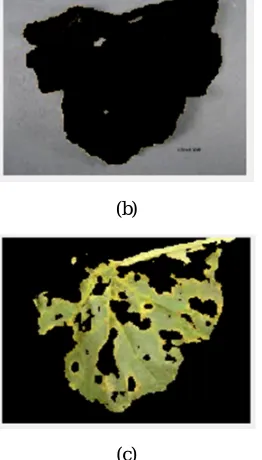
(a)
©IJRASET 2015: All Rights are Reserved
[image:3.612.249.372.73.170.2]540
(c)Fig 1. Images of Leaf affected by diseases (a) Blackspot (b) Anthracnose (c) Rust
Anthracnose develops during cool, moist conditions, which are common in Southern California during the spring. As soon as the weather warms up, anthracnose disappears. If you have anthracnose in your garden, follow the Prevention Guidelines above for blackspot. One of the most common and easily identifiable rose disease is Rust. It's caused by one of nine species of the phragmidium fungus which, in the spring, forms powdery, light orange to yellow spots on the undersides of the leaves. In the summer, the spots turn bright orange and in the fall, they turn black.
II. REVIEWOFDETECTIONMETHODS
The detection of disease is one in all the vital tasks. A disease reduces the assembly of agriculture. Each year the loss attributable to varied diseases is difficult half in agriculture production. Though work is disbursed until time on detection of diseases however correct segmentation of affected half supported style of family remains AN open drawback as an exploration space. Table1 shows the comparison between reviewed papers.
P.Revathi and M.Hemalatha[10] presented a paper Classification of Cotton Leaf Spot Diseases Using Image Processing Edge Detection Technique. In this work we express new technological strategies using mobile captured symptoms of cotton leaf spot images and categorize the diseases using HPCCDD Proposed Algorithm.
Al-Bashish and Braik [17]proposed system, grape leaf image with complex background is taken as input. Thresholding is deployed to mask green pixels and image is processed to remove noise using anisotropic diffusion. Then grape leaf disease segmentation is done using K-means clustering. The diseased portion from segmented images is identified. Best results were observed when Feed forward Back Propagation Neural Network was trained for classification.
Rakesh Kundal & Amar Kapoor[18] in paper of title “Machine learning technique in disease forecasting: a case study on rice blast prediction” proposed a prediction approach based on support vector machines for developing weather based prediction
Farmer
Input Image
Image Preprocessing Image Segmentation
Feature Extraction
Classification
Image Database
Training Testing
[image:3.612.67.535.451.709.2]541
rose diseases that we used in this research, i.e., Blackspot, Anthracnose and Rust. Fig. 1 shows the disease images in JPEG format.B. Image Preprocessing
Image pre-process tasks are the initial stage before feature extraction. There are three steps of image preprocessing processing, i.e., image cropping, image converting and image enhancement. The image is cropped on leaf diseases area, and then converted to gray levels. To enhance the image we used Laplacian filter. Fig. 3 shows pre-processing stage.
(a)
[image:4.612.246.379.252.491.2](b)
Fig 3: Result after preprocessing
C. Image Segmentation
Image segmentation is one of the most important precursors for disease detection and has a crucial impact on the overall performance of the developed systems. The K-Means clustering technique is a well-known approach that has been applied to solve low-level image segmentation tasks. This clustering algorithm is convergent and its aim is to optimize the partitioning decisions based on a user-defined initial set of clusters [2]. Paper proposed k-means segmentation method to segment target areas. The area affected by the disease is the target area. Figure 3 shows the outputs from the segmentation.
542
(b) [image:5.612.249.380.79.309.2](c)
Fig 3. Segmented Leaf Images (a) Cluster1 (b) Cluster2 (c) Cluster3
D. Feature Extraction
Proposed method include two features color texture and space features. These features are total 17 in numbers including 13 color features and 4 shape features. Shape features including area, perimeter, circularity and complexity were extracted from the binary segmentation images. Color features and texture features were extracted from the color segmentation images. The former included mean of gray values of R/G/B component, variance of gray values of R/G/B component, skewness of gray values of R/G/B component, color ratio in RGB color model, mean of gray values of H/S/V component, variance of gray values of H/S/V component, and skewness of gray values of H/S/V component[7]. And the later included contrast in RGB color model, correlation in RGB color model, energy in RGB color model, homogeneity in RGB color model, contrast in HSV color model, correlation in HSV color model, energy in HSV color model, homogeneity in HSV color model, and 4×4 binary fractal dimension. The image analysis technique is done using Color Co-occurrence Matrix (CCM). The fungal affected areas vary in color and texture and are dominant in classifying fungal symptoms. So, we have considered both color and texture features for recognition and classification purpose. Image texture, defined as a function of the spatial variation in pixel intensities (gray values). The use of color features in the visible light spectrum provided additional image characteristic features over traditional gray-scale representation. CCM is a method in which both color and texture features are taken into account to arrive at unique features which represent that image. The CCM method involved three major steps. First, transformations of an RGB (Red, Green, Blue) color representation of an image to an equivalent HSI (Hue, Saturation, Intensity) color representation. Once this process is completed Color Co-occurrence Matrices from the HSI pixels is generated. Lastly, texture features from the CCM matrices are generated [8 & 9]. Input RGB image is converted to the HSV image. Each pixel map is used to generate a Color Co-occurrence Matrix, resulting in three CCM matrices, one for each of the H, S and I pixel maps. The Color Co-occurrence texture analysis method was developed through the use of spatial gray level dependence matrices (SGDM’s). The Gray Level Co-occurrence Method (GLCM) is a statistical way to describe shape by statistically sampling the way certain grey-levels occur in relation to other grey-levels[10]. The GLCM is based on the repeated occurrence of some gray-level configuration in the texture[11]. This method measures occurrence of gray levels between a specific position P (i, j) in the image and a neighboring pixel, according to a given distance d and direction θ. The CCM matrices are then normalized using the Equation 1.
( , ) = ( , , , )
∑ ∑ ( , , , )………(1)
Where p(i,j) represents image attribute matrix
( , , 1,0)represents represents the intensity co-occurrence matrix and L is total number of intensity levels.
©IJRASET 2015: All Rights are Reserved
543
IV. RESULTANDDISCUSSIONThe detection of disease is one in all the vital tasks. A disease reduces the assembly of agriculture. Each year the loss attributable to varied diseases is difficult half in agriculture production. Though work is disbursed until time on detection of diseases however correct segmentation of affected half supported style of family remains AN open drawback as an exploration space.
Percentage accuracy can be calculated of the proposed method from the formula given below
= × 100%
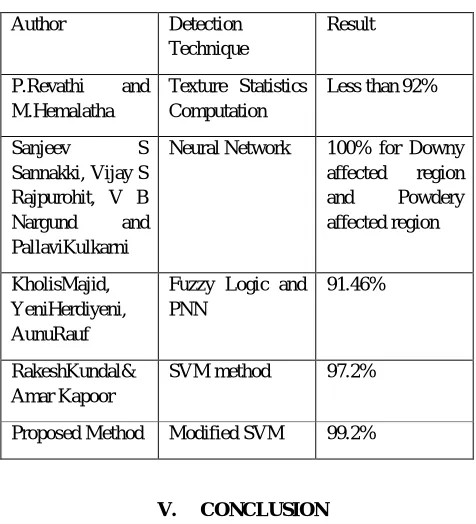
[image:6.612.187.425.310.572.2]Table1 shows the comparison between proposed papers and previously presented paper.
Table 1: Comparison of detection techniques
Author Detection
Technique
Result
P.Revathi and M.Hemalatha
Texture Statistics Computation
Less than 92%
Sanjeev S
Sannakki, Vijay S Rajpurohit, V B Nargund and PallaviKulkarni
Neural Network 100% for Downy affected region and Powdery affected region
KholisMajid, YeniHerdiyeni, AunuRauf
Fuzzy Logic and PNN
91.46%
RakeshKundal& Amar Kapoor
SVM method 97.2%
Proposed Method Modified SVM 99.2%
V. CONCLUSION
This work consists of 4 phases to spot the affected a part of the illness. At first preprocessing is done which include two steps gray conversion and denoising. Second stage is k-means based Image segmentation which eventually does image analysis. Third stage is feature extraction that include color features and shape features. And after that classification of diseases is performed victimization our projected formula. The goal of this analysis work is to develop Advance automatic data processing system which will determine the illness affected a part of a leaf spot by victimization the image analysis technique. Prediction of the diseases and cuss recommendation is finished. The producers will amend the Yield and scale back the loss. Through this projected system the farmers' burden has been reduced and saves their life. Comparison of methods shows that SVM classifiers perform better than others. Accuracy of detection can be increased when using SVM classifier with more number of features included to it.
REFERENCES
©IJRASET 2015: All Rights are Reserved
544
[2] Ilea, Dana E. and Whelan, Paul F. (2006) Color image segmentation using a spatial k-means clustering algorithm. In: IMVIP 2006 - 10th International Machine Vision and Image Processing Conference, 30 August - 1 September 2006, Dublin, Ireland
[3] G. L. Li, “Preliminary study on automatic diagnosis and classification method of plant diseases based on image recognition technology”, Beijing: China Agricultural University, 2011, pp. 1–64.
[4] Kennelly, M., O'Mara, J., Rivard, C., Miller, G.L. and D. Smith 2012. Introduction to abiotic disorders in plants. The Plant Health Instructor. DOI: 10.1094/PHI-I-2012-10-29-01.
[5] Jennifer Olson, "Anthracnose and Other Common Leaf Diseases of Deciduous Shade Trees" Oklahoma Cooperative Extension Service EPP-7634 page 1-4.
[6] Prima W. K. Hutabarat "Morris Arboretum Nursery Trial:A Study of Rose Care Treatment" The Rose Garden Newsletter 2012 page 54-72.
[7] G. L. Li, “Preliminary study on automatic diagnosis and classification method of plant diseases based on image recognition technology”, Beijing: China Agricultural University, 2011, pp. 1–64.
[8] R. Pydipati, T. F. Burks and W. S. Lee, “Identification of citrus disease using color texture features and discriminate analysis”, Computers and Electronics in Agriculture, vol. 52, no. 1-2, (2006), pp. 49-59.
[9] H. Al-Hiary, S. Bani-Ahmad, M. Reyalat, M. Braik and ALRahamneh, “Fast and Accurate Detection and Classification of Plant Diseases”, International Journal of Computer Applications, vol. 17, no. 1, (2011).
[10] S. A. Shearer, and R. G. Holmes, “Plant identification using color co-occurrence matrices”, Transactions of the ASAE, vol. 33 no. 6, (1990), pp. 2037-2044.
[11] Rajesh Yakkundimath, Jagdeesh D. Pujari and Abdulmunaf S. Byadgi, “Classification of Fungal Disease Symptoms affected on Cereals Using Color Texture Features”, International Journal of Signal Processing, Image Processing and Pattern Recognition, 2013, pp. 321-330
[12] R. M. Harlick, K. Shanmugam and H. Dinstein, “Texture features for image classification”, IEEE Transactions on systems, man and cybernetics, vol. 3, (1973), pp. 610-621.
[13] Kholis Majid, Yeni Herdiyeni, Aunu Rauf "I-PEDIA: Mobile Application for Paddy Disease Identification using Fuzzy Entropy and Probabilistic Neural Network" IEEE ICACSIS 2013.
[14] Basvaraj S. Anami, J.D. Pujari, Rajesh Yakkundinath, “Identification and classification of normal and affected agriculture horticulture produce based on combined color and texture feature extraction,” International Journal of Computer Applications in Engineering, vol 1, Sept 2011.
[15] G. Ying, L. Miao, Y. Yuan and H. Zelin, “A Study on the Method of Image Pre-Processing for Recognition of Crop Diseases”, International Conference on Advanced Computer Control, (2008).
[16] N. Wang, K. R. Wang, R. Z. Xie, J. C. Lai, B. Ming, and S. K. Li, “Maize leaf disease identification based on Fisher discrimination analysis”, Scientia Agricultura Sinica, vol. 42, pp. 3836–3842, November 2009.
[17] Al-Bashish, D., M. Braik, and S. Bani-Ahmad. 2011. “Detection and classification of leaf diseases using K-means-based segmentation and neural networks based classification”. Information Technology Journal, 10(2): 267-275.