0095-1137/05/$08.00
⫹
0
doi:10.1128/JCM.43.10.4943–4953.2005
Copyright © 2005, American Society for Microbiology. All Rights Reserved.
Development of a DNA Microarray for Detection and Identification of
Fungal Pathogens Involved in Invasive Mycoses
Dirk M. Leinberger,
1Ulrike Schumacher,
2Ingo B. Autenrieth,
2and Till T. Bachmann
1*
Institute of Technical Biochemistry, University of Stuttgart, Stuttgart, Germany,
1and Institute of Medical Microbiology
and Hygiene, Eberhard-Karls-University, Tu
¨bingen, Germany
2Received 15 April 2005/Returned for modification 15 May 2005/Accepted 5 July 2005
Invasive fungal infections have emerged as a major cause of morbidity and mortality in
immunocompro-mised patients. Conventional identification of pathogenic fungi in clinical microbiology laboratories is
time-consuming and, therefore, often imperfect for the early initiation of an adequate antifungal therapy. We
developed a diagnostic microarray for the rapid and simultaneous identification of the 12 most common
pathogenic
Candida
and
Aspergillus
species. Oligonucleotide probes were designed by exploiting the sequence
variations of the internal transcribed spacer (ITS) regions of the rRNA gene cassette to identify
Candida
albicans
,
Candida dubliniensis
,
Candida krusei
,
Candida glabrata
,
Candida tropicalis
,
Candida parapsilosis
,
Candida
guilliermondii
,
Candida lusitaniae
,
Aspergillus fumigatus
,
Aspergillus flavus
,
Aspergillus niger
, and
Aspergillus
terreus
. By using universal fungal primers (ITS1 and ITS4) directed toward conserved regions of the 18S and
28S rRNA genes, respectively, the fungal ITS target regions could be simultaneously amplified and
fluores-cently labeled. To establish the system, 12 precharacterized fungal strains were analyzed; and the method was
validated by using 21 clinical isolates as blinded samples. As the microarray was able to detect and clearly
identify the fungal pathogens within 4 h after DNA extraction, this system offers an interesting potential for
clinical microbiology laboratories.
Invasive fungal infections have emerged as major causes of
morbidity and mortality in immunocompromised patients.
Candidiasis and aspergillosis are the most common invasive
fungal infections (IFIs) in patients receiving
immunosuppres-sive treatment for cancer or organ transplantation. An IFI
incidence of up to 23% has been reported among high-risk
patients, such as patients with prolonged neutropenia
follow-ing chemotherapy for acute leukemia or allogeneic transplant
recipients, especially following nonmyeloablative
transplanta-tion (16, 17, 47). In additransplanta-tion to the increasing incidence of IFIs,
the number of fungal species which must be considered as
poten-tial fungal pathogens has also increased during the last few
de-cades. Application of antifungal agents against common fungal
pathogens has led to the emergence of resistant species, e.g.,
Candida krusei
,
Aspergillus terreus
, and members of the class
Zy-gomycetes
(26, 36, 54). The conventional identification of
patho-genic fungi in clinical microbiology laboratories based on
pheno-typic features and physiological tests is time-consuming and,
therefore, often imperfect for the early initiation of an antifungal
therapy. Several human fungal pathogens are characterized by
high rates of intrinsic resistance. Therefore, identification of a
fungal pathogen to the species level rather than antifungal drug
susceptibility testing is presently the most important step in the
selection of the adequate antifungal agent (39).
Until now, a variety of molecular methods have been applied
for the detection and identification of fungal pathogens,
in-cluding species or group discrimination with specific primers
(35), identification of PCR products by gel or capillary
elec-trophoresis (4, 8, 44), restriction fragment length
phism analysis (53), single-strand conformational
polymor-phism (48), and Southern or slot blot hybridization assays with
oligonucleotide probes (10, 12, 21, 25, 40). Furthermore, a
number of PCR-enzyme immunoassays (EIAs) were
devel-oped (11, 13, 30, 32, 41). One study showed the applicability of
PCR-EIA for the resolution of discrepancies in
phenotype-based identification between different institutions (6). This
PCR-EIA (11) discriminates the different fungal species by
applying the variability of internal transcribed spacer (ITS)
region 2 (ITS2). More recently, real-time PCR assays have
been described for the quantitative detection of either
Candida
or
Aspergillus
species (19) in serum (3, 7, 50) or other specimen
types (51). Diaz and Fell applied the Luminex technology to
the detection of pathogenic yeasts of the genus
Trichosporon
(9). These previously described methods feature only limited
multiplexing capability, resulting in high costs if all relevant
species must be considered. An economically more efficient
approach would be the application of a protocol which is
ca-pable of identifying a panel of relevant species in a highly
parallel fashion.
It was the aim of the present study to develop a species
identification array by making use of the high multiplexing
capacity of DNA microarrays in the field of molecular
detec-tion for identificadetec-tion of human fungal pathogens. As targets,
12
Candida
and
Aspergillus
species representing the pathogens
that are the most frequently isolated from invasive fungal
in-fections as well as species with known intrinsic resistance to
antifungal agents were chosen.
MATERIALS AND METHODS
Microorganisms.Ten reference strains, obtained from the German Collection of Microorganisms and Cell Cultures (DSMZ;Candida albicansDSM 1386, Candida dubliniensisDSM 13268,Candida kruseiDSM 3433,Candida
parapsi-* Corresponding author. Mailing address: Institute of Technical
Biochemistry, University of Stuttgart, Allmandring 31, Stuttgart 70569,
Germany. Phone: 49 (0) 711 685 3197. Fax: 49 (0) 711 685 3196.
E-mail: [email protected].
4943
on May 15, 2020 by guest
http://jcm.asm.org/
losisDSM 5784,Aspergillus fumigatusDSM 819, andAspergillus nigerDSM 1988) and the American Type Culture Collection (ATCC;Torulopsis glabrataATCC 90030,Candida tropicalisATCC 750,Candida guillermondiiATCC 6260, and Aspergillus flavusATCC 20043), as well as two clinical isolates from the Institute of Medical Microbiology and Hygiene, University of Tu¨bingen (Candida lus-itaniaeVA 13910 andAspergillus terreusH15), were used as precharacterized strains. Additionally, 21 clinical isolates, including 15Candidastrains belonging to 11 species, 4Aspergillusstrains belonging to 3 species, and 1 strain each of Saccharomyces cerevisiaeandPseudallescheria boydiifrom the Institute of Med-ical Microbiology and Hygiene, University of Tu¨bingen, were included in this study (see Table 2) and were used as blinded samples. All clinical isolates were identified by standard laboratory procedures, including macro- and micromor-phologies, germ tube formation, growth characteristics at different temperatures, and assimilation tests (ID 32C; Biomerieux).
DNA extraction.Prior to DNA extraction, the fungal strains were cultured on Sabouraud dextrose agar at 30°C for 42 h (yeasts) or 72 h (molds).Candidaand other yeast colonies were inoculated in sterile saline. Mold cultures were washed with 10 ml of sterile saline (0.9%) to obtain conidia. The fungal suspensions were centrifuged at 3,000⫻g, and then the pellets were incubated with 1 ml of leukocyte lysis buffer consisting of 10 mM Tris (pH 7.6), 10 mM EDTA (pH 8.0), 50 mM NaCl, 0.2% sodium dodecyl sulfate, and 200g of proteinase K (Roche Diagnostics, Penzberg, Germany) per ml at 65°C overnight. The suspensions were again centrifuged (3,000⫻g), and the pellets were exposed to three cycles of freezing in liquid nitrogen for 30 s and heating at 95°C for 4 min to disrupt the fungal cells. Thereafter, the pellets were resuspended and incubated in 1,000l recombinant lyticase (L4276; Sigma) at 37°C for 45 min. After centrifugation at 1,600⫻g, the DNA was extracted by using a QIAmp DNA mini kit (QIAGEN, Hilden, Germany).
Primers.Oligonucleotide primers were obtained from Sigma-Genosys, Stein-heim, Germany. Amplification of the ITS1 and ITS2 regions was performed with universal fungal primers ITS1 (5⬘-TCCGTAGGTGAACCTGCGG-3⬘) and ITS4 (5⬘-TCCTCCGCTTATTGATATG-3⬘), as described by White et al. (52). The sequence of ITS1 is complementary to a conserved region at the end of the 18S rRNA gene, and ITS4 binds to a conserved region at the beginning of the 28S
rRNA gene, leading to amplification of the ITS regions and the 5.8S rRNA gene, which is located between the noncoding ITS regions. ITS1- and ITS4-specific primers were also used for sequencing of the purified amplicon. Additionally, the primers ITS2 (5⬘-GCTGCGTTCTTCATCGATGC-3⬘) and ITS3 (5⬘-GCATCG ATGAAGAACGCAGC-3⬘) were used for sequencing, leading to overlapping fragments.
DNA sequencing.For DNA sequencing, the full ITS region was amplified by PCR in a final reaction volume of 50l. Each reaction mixture contained approximately 100 ng template DNA; 0.4 pmol (each) forward (ITS1) and reverse (ITS4) primers; 100M (each) dATP, dCTP, dGTP, and dTTP; 1⫻ Expand High Fidelity reaction buffer containing 1.5 mM MgCl2(Roche); 2.5%
dimethyl sulfoxide (Fluka Chemie, Buchs, Switzerland); and 2.6 U of Expand High Fidelity DNA polymerase (Roche). The amplification was performed in a Mastercycler gradient (Eppendorf, Hamburg, Germany). An initial denaturation step (94°C for 5 min) was followed by 35 cycles (with each cycle consisting of DNA denaturation at 94°C for 30 s, primer annealing at 55°C for 30 s, and elongation at 72°C for 1 min) and a final extension step at 72°C for 7 min. A no-template negative control was included in each PCR run. The PCR product was purified with a QIAquick Spin PCR purification kit (QIAGEN), according to the protocol of the manufacturer. The DNA was eluted in 30l of double-distilled H2O (ddH2O). The purified PCR products were sequenced with the
primers ITS1, ITS2, ITS3, and ITS4 and the BigDye Terminator cycle sequenc-ing kit (Applied Biosystems, Darmstadt, Germany). Sequencsequenc-ing was performed on an ABI Prism 377 DNA sequencer (Applied Biosystems). All fungal strains were sequenced in both directions with two primers each, resulting in four overlapping fragments. The sequence data were assembled by using SeqMan II software (version 5.00; DNAStar, Madison, Wis.). The sequences obtained have been submitted to GenBank.
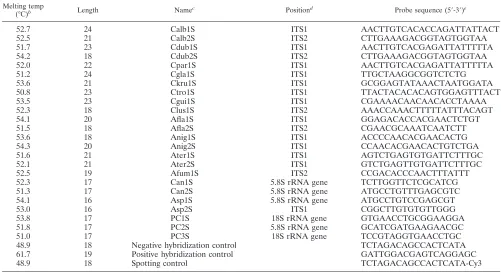
[image:2.585.41.542.82.355.2]Capture probe design.All species- or genus-specific oligonucleotide probes and process controls were designed from ITS sequences available in the Gen-Bank database (EMBL and DDBJ databases). Multiple-sequence alignments were carried out by using ClustalX software (42) or SeqMan II software (version 5.00; DNAStar). By comparison of the sequences of the ITS1 and ITS2 regions of the target species, regions with interspecies variations could be identified and
TABLE 1. Oligonucleotide probe sequences
aMelting temp
(°C)b Length Namec Positiond Probe sequence (5⬘-3⬘)e
52.7
24
Calb1S
ITS1
AACTTGTCACACCAGATTATTACT
52.5
21
Calb2S
ITS2
CTTGAAAGACGGTAGTGGTAA
51.7
23
Cdub1S
ITS1
AACTTGTCACGAGATTATTTTTA
54.2
18
Cdub2S
ITS2
CTTGAAAGACGGTAGTGGTAA
52.0
22
Cpar1S
ITS1
AACTTGTCACGAGATTATTTTTA
51.2
24
Cgla1S
ITS1
TTGCTAAGGCGGTCTCTG
53.6
21
Ckru1S
ITS1
GCGGAGTATAAACTAATGGATA
50.8
23
Ctro1S
ITS1
TTACTACACACAGTGGAGTTTACT
53.5
23
Cgui1S
ITS1
CGAAAACAACAACACCTAAAA
52.3
18
Clus1S
ITS2
AAACCAAACTTTTTATTTACAGT
54.1
20
Afla1S
ITS1
GGAGACACCACGAACTCTGT
51.5
18
Afla2S
ITS2
CGAACGCAAATCAATCTT
53.6
18
Anig1S
ITS1
ACCCCAACACGAACACTG
54.3
20
Anig2S
ITS1
CCAACACGAACACTGTCTGA
51.6
21
Ater1S
ITS1
AGTCTGAGTGTGATTCTTTGC
52.1
21
Ater2S
ITS1
GTCTGAGTTGTGATTCTTTGC
52.5
19
Afum1S
ITS2
CCGACACCCAACTTTATTT
52.3
17
Can1S
5.8S rRNA gene
TCTTGGTTCTCGCATCG
51.3
17
Can2S
5.8S rRNA gene
ATGCCTGTTTGAGCGTC
54.1
16
Asp1S
5.8S rRNA gene
ATGCCTGTCCGAGCGT
53.0
16
Asp2S
ITS1
CGGCTTGTGTGTTGGG
53.8
17
PC1S
18S rRNA gene
GTGAACCTGCGGAAGGA
51.8
17
PC2S
5.8S rRNA gene
GCATCGATGAAGAACGC
51.0
17
PC3S
18S rRNA gene
TCCGTAGGTGAACCTGC
48.9
18
Negative hybridization control
TCTAGACAGCCACTCATA
61.7
19
Positive hybridization control
GATTGGACGAGTCAGGAGC
48.9
18
Spotting control
TCTAGACAGCCACTCATA-Cy3
a
For each species- or genus-specific probe or process control, only the sense version of the probe is shown.
b
Calculated with Oligo (version 6.65; Molecular Biology Insights) and the parameters described.
c
S, sense; the name of the corresponding “antisense”probe uses AS (e.g., Calb1AS).
d
Position within the amplified target region.
e
The sequence of the 14-thymidine spacer at the 5⬘end is not shown.
on May 15, 2020 by guest
http://jcm.asm.org/
were used to develop species-specific probes. Conserved regions served either as targets for probes which are able to discriminate betweenCandidaand Aspergil-lus(genus-specific probes) or as process controls. In addition to the position of the probe within the target region, thermodynamic parameters were considered in order to get a set of probes with at least similar hybridization efficiencies. Oligonucleotide probes of various lengths (16 to 24 bases) but within a very narrow range of melting temperatures (Tms;⫾3.5°C) were designed. TheTms of
the probes (Table 1) and the stabilities of possible secondary structures were calculated with the software Oligo (version 6.65; Molecular Biology Insights, Cascade, Colo.) by using the following parameters and thresholds: 50 mM uni-valent ions, 1.5 mM free Mg2⫹, and 250 pM DNA forT
mcalculation; desired
stability of hairpins,⌬G⬎0 kcal/mol (whereGis Gibb’s free energy); and desired stability of duplexes,⌬G⬎ ⫺4 kcal/mol. All probes were designed as sense and antisense probes. To check the specificities of the probes, additional database searches were performed by using the BLAST and FASTA programs to compare the probe sequences with the sequences in the EMBL and GenBank DNA databases. The sequences of the probes developed are shown in Table 1.
Oligonucleotide array fabrication.Oligonucleotide arrays were constructed with 51 different oligonucleotide capture and control probes. The oligonucleo-tides were purchased from Metabion (Planegg-Martinsried, Germany) in de-salted purity and quality controlled by matrix-assisted laser desorption ioniza-tion–time of flight mass spectrometry. Each species- or genus-specific capture probe had a 14-thymidine spacer and an amino modification at the 5⬘end and was spotted onto the microarray in triplicate. The array production process and the subsequent washing steps were carried out as described previously (15), with modifications. In brief, by using a MicroGrid II microarrayer with two MicroSpot 2500 pins (BioRobotics, Cambridge, United Kingdom), the oligonucleotide probes, which were dissolved in spotting buffer (160 mM Na2SO4, 130 mM
Na2HPO4) to a final concentration of 20M (prelabeled spotting control; 10
M), were spotted onto epoxy-coated glass slides (Elipsa, Berlin, Germany). Covalent immobilization was achieved by incubating the oligonucleotide array at 60°C for 30 min in a drying compartment (Memmert, Schwabach, Germany). After the probes were spotted, the slides were rinsed for 5 min in 0.1% (vol/vol) Triton X-100 in ddH2O, 4 min in 0.5l of concentrated HCl per ml of ddH2O,
and 10 min in a 100 mM KCl solution with constant stirring. Subsequently, the slides were incubated in blocking solution (25% [vol/vol] ethylene glycol, 0.5l of concentrated HCl per ml of ddH2O), with the spotted side facing upwards, at
50°C in a heating compartment (OV5; Biometra, Go¨ttingen, Germany); rinsed in ddH2O for 1 min; and finally, dried under a flow of nitrogen. The spot size and
the spot-to-spot distance were estimated to be 160m and 320m, respectively.
The processed slides were stored dry for a maximum of 20 days at room tem-perature in the dark until further use.
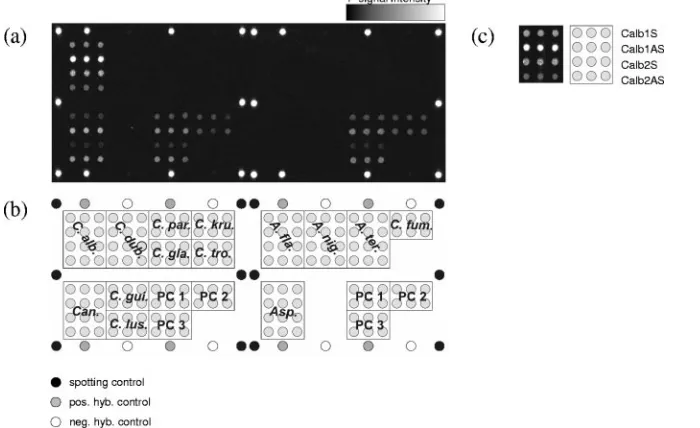
Controls.In addition to the species- and genus-specific capture probes, each array also included several controls: a prelabeled spotting control (5⬘-TTTTTT TTTTTTTTCTAGACAGCCACTCATA-cyanine3 [Cy3]-3⬘); a positive hybrid-ization control (5⬘-TTTTTTTTTTTTTGATTGGACGAGTCAGGAGC-3⬘) complementary to a labeled oligonucleotide target (5⬘-Cy3-GCTCCTGACTCG TCCAATC-3⬘), which was spiked during hybridization; and a negative hybrid-ization control (5⬘-TTTTTTTTTTTTTTCTAGACAGCCACTCATA-3⬘). All these control sequences are unrelated to sequences found in fungi. Three process controls (PC1 to PC3; Table 1) were designed by using universal fungal se-quences. Additionally, the process controls were designed as sense and antisense probes. The spotting controls were set on the side positions of each subgrid spotted with the same pin. The positive and negative hybridization controls were spotted alternately at the upper and lower edges of each subarray. The process controls were spotted within both subgrids (Fig. 1a).
Amplification, labeling, and purification of target DNA.The target DNA used for hybridization on the oligonucleotide arrays was synthesized by PCR. For amplification and labeling, 100 ng of template DNA was supplemented with 0.4 pM (each) forward (ITS1) and reverse (ITS4) primers; 100M (each) dATP, dGTP, and dTTP; 50M dCTP; 50M Cy3-dCTP (ratio of unlabeled dCTP/ labeled dCTP, 1:1; Amersham Biosciences, Freiburg, Germany); 1⫻Expand High Fidelity reaction buffer containing 1.5 mM MgCl2(Roche); 2.5% dimethyl
sulfoxide (Fluka Chemie); and 2.6 U of Expand High Fidelity DNA polymerase (Eppendorf, Hamburg, Germany) in a total volume of 50l. The amplification was performed in a Mastercycler gradient (Eppendorf). The reaction profile was as follows: 5 min of initial denaturation at 94°C; 35 cycles of DNA denaturation at 94°C for 30 s, primer annealing at 55°C for 30 s, and elongation at 72°C for 1 min; and a final extension step at 72°C for 4 min. A no-template negative control was included in each PCR run. After purification of the PCR product with a QIAquick Spin PCR purification kit (QIAGEN), the rate of incorporation of Cy3-dCTP, expressed as number of nucleotides/number of incorporated fluores-cent dyes (NT/F), was determined by measurement of the optical density (ND-1000 spectrophotometer; NanoDrop Technologies, Rockland, Maine).
Hybridization. The purified target DNA (0.5 pmol) together with control DNA (Cy3-GCTCCTGACTCGTCCAATC; 0.05 pmol) was hybridized within a gene frame (15 by 16 mm) closed with a coverslip (Abgene House, Hamburg, Germany) in 70l of 6⫻SSPE (1⫻SSPE is 0.18 M NaCl, 10 mM NaH2PO4, and
1 mM EDTA [pH 7.7]). Prior to hybridization, the hybridization mixture was incubated for 10 min at 95°C, stored for 1 min on ice, and immediately used. For
FIG. 1. (a) Fluorescence image after hybridization with 0.5 pmol of
C
.
albicans
isolate VA 115839-03 target DNA for 1 h at 53°C. The signal
intensity is encoded in the 65,636 gray scales of the 16-bit TIF image. (b) Layout of the capture probes on the array. All species- and genus-specific
probes and the process controls were spotted in triplicate. The other control probes are positioned at the corners of each subarray. Each subarray
contains a set of process controls. pos. hyb., positive hybridization, neg. hyb., negative hybridization. (c) The enlarged results for the
C
.
albicans
probes describe the arrangement of different probes for the same species or genus within the indicated fields of the array.
on May 15, 2020 by guest
http://jcm.asm.org/
[image:3.585.125.475.73.287.2]hybridization with amplified target DNA from the 12 precharacterized strains, the DNA solution on the glass slide, within the gene frame, was incubated in a thermomixer with an exchangeable thermoblock for slides (Eppendorf) for 2 h at 50°C and at an agitation speed of 1,200 rpm. In order to improve the hybridiza-tion condihybridiza-tions, hybridizahybridiza-tions with target DNA from a subset of target species were also carried out for 2 h at 53°C, 55°C, and 57°C. During the evaluation process, target DNA amplified from the 21 blinded samples was hybridized for 1 h at 53°C with agitation at 1,200 rpm. The reduction of the assay time was due to previous optimization experiments (data not shown). After hybridization, the slides were washed with 2⫻SSC (1⫻is 0.15 M NaCl plus 0.015 M sodium citrate) with 0.1% sodium dodecyl sulfate, then 2⫻SSC, and finally, 0.2⫻SSC for 10 min each time. The washing procedure was performed at room temperature with agitation in a glass container. The slides were subsequently dried with N2.
Data acquisition and processing.After the hybridization reaction, the data from the oligonucleotide arrays were read by acquisition of the fluorescence signals by using a 418 Array Scanner (Affymetrix, Santa Clara, Calif.). The laser power and gain were adjusted to 100%. Image processing and calculation of signal intensities were performed with ImaGene (version 3.0; Biodiscovery, Los Angeles, Calif.). For calculation of the individual net signal intensities, the local background was subtracted from the raw spot intensity value. Further data processing was performed by using Microsoft Excel software (Microsoft, Rich-mond, Wash.). Only net signal intensities which were significantly higher than the background were considered. Therefore, a cutoff 1 of 300 intensity units (three times the detection limit of the array scanner) was applied. By definition, all values less than 300 were set equal to 0. For normalization, the net signal intensity of each spot was divided by the mean net signal intensity of the three replicates of the antisense version of process control 3 (referred to as “signal intensity” [I] of PC3 antisense) and multiplied by 100. All other process control probes were found to be unsuitable for data processing and were not used. The mean of the three normalized net signal intensities (referred to as the “relative signal intensity” [RI] of one probe) and the standard deviation of those values were calculated. Accordingly, the probe PC3 antisense always had an RI value of 100%. To discriminate between specific and unspecific hybridization signals, a cutoff 2 was defined. Only RI values which were significantly greater than 10% (RI⬎10⫹three times the standard deviation of the normalized net signal intensities of one probe) of the signal intensity of the process control 3 antisense were considered specific signals.
Nucleotide sequence accession numbers.The accession numbers of the se-quences deposited in GenBank are AY939782 (A. flavus ATCC 20043), AY939783 (A. nigerisolate ST 717-04), AY939784 (A. nigerisolate VA 3590-04), AY939785 (A. flavusisolate VA 103936-04), AY939786 (C. albicans ATCC 10231), AY939787 (A. nigerATCC 16404), AY939788 (A. terreusisolate H15), AY939789 (C. albicansisolate ST 3477-03), AY939790 (A. fumigatusATCC 9197), AY939791 (C. albicansisolate VA 115470-03), AY939792 (C. guilliermon-diiATCC 6260), AY939793 (C. glabrataATCC 90030), AY939794 (C. glabrata isolate VA 104009-04), AY939795 (C. guilliermondii isolate UR 9406-03), AY939796 (C. kruseiisolate ST 3382-03), AY939797 (C. lusitaniaeisolate VA 115231-03), AY939798 (C. parapsilosisATCC 22019), AY939799 (C. norvegensis isolate ST 3481-03), AY939800 (C. pelliculosaisolate ST 3352/2-03), AY939801 (C. tropicalisisolate UR 9344-03), AY939802 (P. boydiiisolate VA 103543-04), AY939803 (C. parapsilosisisolate VA 115230-03), AY939804 (A. fumigatusVA 104001-04), AY939805 (C. dubliniensisisolate ST 2792-03), AY939806 (C. kefyr isolate VA 116042-03), AY939807 (C. albicans isolate VA 115839-03), AY939808 (C. kruseiATCC 24210), AY939809 (C. dubliniensisisolate R2), AY939810 (C. tropicalisATCC 750), AY939811 (C.lusitaniaeVA 13910-03), AY939812 (C. lusitaniaeisolate ST 3324-03), AY939813 (C. dubliniensisisolate VA 103469-04), AY939814 (S. cerevisiaeisolate ST 3352/1-03), and DQ105856 (C. dubliniensisDSM 13268).
RESULTS
We constructed an oligonucleotide microarray for the rapid
and simultaneous identification of the most common
patho-genic
Candida
and
Aspergillus
species. By using the internal
transcribed spacer regions of the rRNA gene complex as the
diagnostic region, probes were designed against either the
ITS1 region or the ITS2 region, or both (Table 1). By
exploit-ing the full sequence of the amplicon obtained with primers
ITS1 and ITS4, the sequence of the central 5.8S rRNA gene
was used to design either genus-specific probes or process
controls. The conserved region at the end of the 18S rRNA
gene was used for the design of process controls. The size of
the PCR product generated with those primers, using extracted
genomic DNA as the template, varied, depending on the
spe-cies, from 382 bp (
C. lusitaniae
) to 882 bp (
C. glabrata
). The
ITS regions of
A. fumigatus
,
A. niger
, and
A. terreus
were
am-plified by adding 2.5% of dimethyl sulfoxide to resolve the
secondary structures. The fluorescent label (Cy3) was
incorpo-rated during PCR. The NT/F ratios varied from 80 to 220,
depending on the quality of the template DNA and on the
species.
Setting up the system and proof of concept.
To examine the
specificities and hybridization efficiencies of the capture probes
that were designed, to optimize hybridization conditions, and
to establish the quantification and subsequent data processing,
the array was tested by using 12 precharacterized strains, 1
strain of each target species. By hybridization for 2 h at 50°C,
different hybridization patterns for the different species could
clearly be seen on the microarray. Figure 1 shows the
fluores-cence intensities of the probes after hybridization with the
C.
albicans
DSM 1386 target DNA. The hybridization efficiencies
of the sense and antisense versions of one probe often showed
big differences. At least one of the two versions showed a high
hybridization efficiency, with fluorescent net signal intensities
ranging from 21,000 to 55,400 intensity units (with
species-specific probes) or 6,600 to 37,500 intensity units (with
genus-specific probes). By using epoxy-coated glass slides in
combi-nation with the washing procedures described above,
backgrounds which allowed the use of a low cutoff, 1 of 300
intensity units, could be achieved. Weak cross hybridizations
(
⬃
1,000) were observed only between the
A. niger
-specific
probe Anig1 antisense and the
A. fumigatus
or
A. terreus
target
DNA. This was expected, as there is no sequence difference
between
A. fumigatus
and
A. terreus
at the position within the
ITS1 region to which the probe Anig1 antisense binds. The
second
A. niger
-specific probe, Anig2 sense, showed weak but
significant signals (I,
⬃
400) only with
A. fumigatus
.
Further-more, we included in the array layout three process controls
which were designed to be specific for universal fungal
se-quences with the aim of using one as an internal standard. The
assumption was that the intensity of a process control would be
similarly dependent on the parameters of the experiment
(function of the labeling PCR, hybridization conditions), as
was the case for the other probes on the array. To rate the
suitability of the three different process controls as an internal
standard, the relative signal intensities of certain probes
cal-culated with different process controls on different slides were
compared (data not shown). Due to the small deviations of the
relative signal intensities on different slides with probe PC3
antisense, for calculation of the RI values it fulfilled the
re-quirements for a normalization procedure and was chosen as
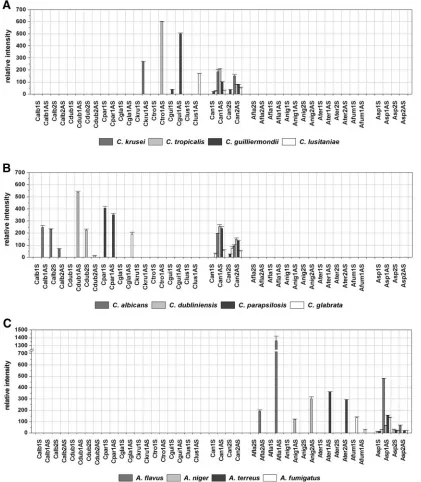
the internal standard. Figure 2 shows the quantified data sets
of all probes after hybridization with the labeled target DNA of
the different precharacterized strains by using PC3 antisense
for normalization and cutoff 2. This cutoff was chosen as a
consequence of the weak cross hybridizations observed. By
using this threshold, every target species could be
unequivo-cally identified.
Optimization of hybridization conditions.
To optimize the
assay system, the performance of the probes during
on May 15, 2020 by guest
http://jcm.asm.org/
tion was examined under more stringent hybridization
condi-tions. This was achieved by raising the hybridization
tempera-ture. The aim of these experiments was the optimization of the
discrimination of target species by not loosing too much net
signal intensity (and, therefore, sensitivity).
A. fumigatus
was
representative in both aspects (the sole species which showed
cross hybridization to other species-specific probes and which
had relative low net signal intensities) and was chosen as the
model target species. The increase in the temperature
gradu-ally resulted in a decrease of the net signal intensities of the
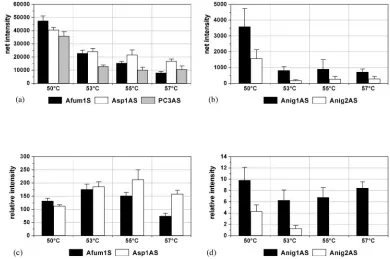
specific signals (Fig. 3a) as well as of the unspecific signals (Fig.
3b). The most significant decrease was observed by raising the
temperature from 50 to 53°C. The relative signal intensities of
the species-specific probe Afum1 sense and the genus-specific
probe Asp1 antisense had maxima at 53°C and 55°C,
respec-tively (Fig. 3c). The highest unspecific signal had a minimum at
53°C (Fig. 3d). The concordance of the optimum of the specific
signal of Afum1S and the minimum of the unspecific signal of
Anig1AS at 53°C indicated that the assay would have the
strongest discrimination power at this hybridization
tempera-ture. Consequently, all following hybridizations were
[image:5.585.82.503.71.553.2]per-formed at 53°C. Further experiments with
A. fumigatus
,
C.
FIG. 2. Relative intensities after hybridization with labeled target DNA from the 12 target species. Cutoff 1, I
⫽
300; cutoff 2, RI
⫽
10. The
mean RIs and their standard deviations are calculated for the triplicate spots on one slide (
n
⫽
3).
on May 15, 2020 by guest
http://jcm.asm.org/
lusitaniae
, and
C. krusei
DNA showed the assay time could be
reduced by reducing the hybridization duration from 2 to 1 h
(data not shown).
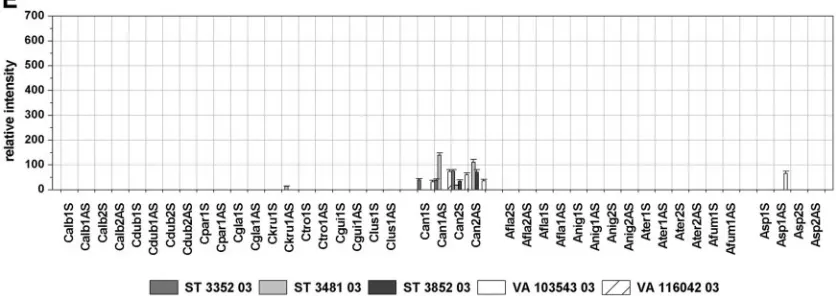
Testing of clinical isolates.
To examine the specificity of the
designed probes and to assess their applicability for clinical
isolates, the performance of the array was validated by using 21
blinded samples containing genomic DNA of clinical isolates
of either the target species or fungal nontarget species. The
application of nontarget species served as a cross-reactivity
test. The array result was compared in each case to the result
of the direct sequencing of the PCR product amplified out of
the same sample in a separate PCR by using the same primers
used for the labeling PCR. The identities of the sequences
obtained were determined by performing searches of the
se-quences with the sese-quences in the GenBank DNA database by
using the BLAST program. Additionally, the sequences were
analyzed by comparison to the sequences used for probe
de-sign. By comparing the array results and the results of the
sequencing to the previous identification obtained by standard
methods, the array was able to unequivocally identify the
con-tents of 16 samples (Table 2). Due to the absence of
species-specific signals and the presence of genus-species-specific and control
signals, four other isolates were identified as nontarget species
by the array. In those cases the sequencing led to the
identifi-cation of the fungal species and confirmed the array result. In
the case of sample ST 3481-03, the species-specific probe for
C.
krusei
, probe Ckru1AS, showed a weak hybridization signal
with an RI value of 14 (Fig. 4e). Although this probe showed
much higher RI values when with the
C. krusei
DSM 3433
strain (RI
⫽
270; Fig. 2b) or isolate ST 3382-03 (RI
⫽
511; Fig.
4a) was hybridized, we interpreted the result as specific,
ac-cording to the global cutoff 2 described above. Sequencing
identified the fungal content as
C. norvegensis
, which was
con-cordant with the conventional identification results (Table 2).
Accordingly, the sequence analysis revealed a 15-bp match
between the
C. norvegensis
sequence and
C. krusei
-specific
probe Ckru1AS. Regarding the full ITS amplicon, the
se-quences of the
C. krusei
DSM 3433 strain and the
C.
norveg-ensis
isolate ST 3481-03 showed 81% homology, with high
homology within the central 5.8S rRNA gene and sequence
variations concentrating within the ITS regions. Other isolates
also showed minor differences in sequence compared with
those of the precharacterized strains either within regions not
used for probe design (isolates ST 3382-03 and VA 104001-04)
or within the diagnostic position (isolate VA 115231-03).
Nev-ertheless, the correct identification of those isolates was
pos-sible, proving the robustness of the array (Fig. 4a, c, and d;
Table 2). The fluorescence intensities of the probes quantified
after hybridization with the labeled target region of the
differ-ent isolates are shown in Fig. 4.
DISCUSSION
With the development of more aggressive therapeutic
regi-mens, especially for the treatment of hematological
malignan-cies, the incidence of invasive opportunistic yeast and mold
infections has increased. The early initiation of antifungal
ther-apy is critical in reducing the high mortality rate in patients
with IFIs. Early and accurate identification of the fungal
patho-gen is the most important and critical step in providing
ade-FIG. 3. Behaviors of I and RI of the species-specific probe Afum1 sense, the genus-specific probe Asp1 antisense, the process control PC3
antisense (a and c), and the
A
.
niger
-specific probes Anig1 antisense and 2 antisense (b and d) after hybridization with 0.5 pmol labeled
A
.
fumigatus
DSM 819 target DNA for 2 h at different hybridization temperatures. The columns depict the mean net signal intensities or the mean relative signal
intensities and their standard deviations over three slides of the same experiment (
n
⫽
9).
on May 15, 2020 by guest
http://jcm.asm.org/
[image:6.585.95.485.69.328.2]quate antifungal treatment in time. The conventional method
of identification of pathogenic fungi used in clinical
microbi-ology is based on phenotypic features and physiological tests
and is therefore time-consuming. Instead, molecular
genotyp-ing methods could provide a rapid and specific means of
iden-tification of fungal pathogens. In view of the increasing number
of fungal species isolated from clinical samples as potential
pathogens, a broad-spectrum detection system as it is
repre-sented by the microarray technology would be desirable. Until
today, diagnostic DNA microarrays were applied for the
iden-tification of viruses (5, 27–29, 56), bacteria (14, 24, 45, 46, 49),
and mechanisms of resistance to certain antibiotics (15, 18, 55).
To our knowledge, this study describes for the first time the
application of the DNA microarray technology in combination
with a quantification and data-processing method for the rapid
and reliable detection of fungal pathogens. To achieve this,
oligonucleotide capture probes were designed by exploiting the
variations in the sequences of the ITS regions in a way similar
to that described by other research groups (20, 23). The ITS
regions were chosen as the target for several reasons: (i) as part
of the rRNA gene complex, the ITS regions are present in
numerous copies in the fungal genome; (ii) universal fungal
primers based on the conserved regions of the rRNA genes are
available; and (iii) the level of variability of the ITS regions of
the target species is higher than that of the rRNA genes and is
high enough for species resolution.
A frequent challenge in DNA microarray-based species
de-tection studies is the discrimination between specific and
un-specific signals, especially in the case of mixture analysis. Cross
hybridization was observed in several identification microarray
studies (1, 46), which made it necessary to design more than
one probe per species (2). For this reason, we introduced a
simple normalization procedure based on process controls.
While the first cutoff in the study presented here was basically
related to the background intensity, cutoff 2 was determined by
the intensity value normalized on the basis of the process
control for the most severe cross hybridization. The use of a
global and very stringent cutoff indicates the possibility of
misidentifications, as was found in the case of
C
.
krusei
and
C.
norvegenis
. On the other hand, this low threshold left a lot of
space between the cutoff 2 and the relative signals for the most
efficient species-specific probes (well above 100) and for the
genus-specific probes (from 50 to 250). For this reason, the use
of an individual cutoff seems more appropriate for future
stud-ies, as this option would offer the possibility to take the
se-quence similarities of closely related species into account.
Nat-urally, such an approach would require the analysis of larger
numbers of samples in order to better reflect sequence
varia-tions in the clinical routine. On the other hand, the stringent
cutoff offers the advantage of a higher resolution for samples
with mixtures of microorganisms. Future studies will show at
which ratios different species can be detected by using the
present cutoff definition or if a modification will be necessary.
Two aspects of the specificity of the detection system can be
discussed. First, the misidentification of sample ST 3481-03 as
C. krusei
due to sequence similarities between
C. krusei
and
C.
norvergensis
suggests the need for the design of an additional
C. krusei
-specific probe which would be able to distinguish
between these two species. Second, the big difference between
the RI value of the perfect match and the cross hybridization
would allow an individual cutoff 2 higher than 10 for
C. krusei
-specific probe Ckru1AS instead of a universal one.
Neverthe-less, a considerable robustness was demonstrated for an isolate
which showed a point mutation within the diagnostic position
(
C. lusitaniae
VA 115231-03).
[image:7.585.47.543.81.299.2]With multiplexing capacity as one of the key features of
DNA microarrays, the method developed in the present study
should particularly be compared to methods which are able to
TABLE 2. Evaluation of the array with blinded samples
No. Isolateb Isolate by conventional
identification method Array result Sequencing result
a
1
C. albicans
ST 3477-03
C. albicans
⫹
2
C. albicans
VA 115470-03
C. albicans
⫹
3
C. albicans
VA 115839-03
C. albicans
⫹
4
C. dubliniensis
ST 2792-03
C. dubliniensis
⫹
5
C. dubliniensis
VA 103469-04
C. dubliniensis
⫹
6
C. glabrata
VA 104009-04
C. glabrata
⫹
7
C. guillermondii
UR 9406-03
C. guillermondii
⫹
8
C. krusei
ST 3382-03
C. krusei
⫹
9
C. lusitaniae
ST 3324-03
C. lusitaniae
⫹
10
C. lusitaniae
VA 115231-03
C. lusitaniae
⫹
11
C. parapsilosis
VA 115230-03
C. parapsilosis
⫹
12
C. tropicalis
UR 9344-03
C. tropicalis
⫹
13
Candida kefyr
VA 116042-03
Nontarget species
Candida kefyr
14
Candida norvegensis
ST 3481-03
C. krusei
Candida norvegensis
15
Candida pelliculosa
ST 3352/2-03
Nontarget species
Candida pelliculosa
16
A. fumigatus
VA 104001-04
A. fumigatus
⫹
17
A. niger
ST 717-04
A. niger
⫹
18
A. niger
VA 3590-04
A. niger
⫹
19
Aspergillus spp.
cVA 103936-04
A. flavus
⫹
20
Pseudallescheria boydii
VA 103543-04
Nontarget species
Pseudallescheria boydii
21
Saccharomyces cerevisiae
ST 3352/1-03
Nontarget species
Saccharomyces cerevisiae
a⫹
, concordance with the array result.
b
Clinical isolates were identified by standard laboratory procedures.
c
The content of this sample could not be identified to the species level by the described methods.
on May 15, 2020 by guest
http://jcm.asm.org/
on May 15, 2020 by guest
http://jcm.asm.org/
detect more than one parameter simultaneously. Using two
multiplex liquid hybridization mixtures, Hendolin and
col-leagues needed 2 days for the detection of eight
Candida
and
Aspergillus
species from tissue samples (22). A line probe assay
was designed for the simultaneous detection of 11 different
Candida
and
Aspergillus
species and
Cryptococcus neoformans
in spiked blood samples within 1 working day (38). However,
the capacity of this format is nearly used up with this number
of species (57). In contrast, microarrays have the potential to
discriminate between thousands of targets, and principally, the
design of specific probes which are able to discriminate
be-tween a set of species by using a particular target or targets is
the only limiting factor. In this study a set of 12 target species
was chosen, and the procedure could be performed within 4 h
after DNA extraction. Additional time must be counted for
DNA extraction, but optimized protocols for extraction in 4 h
have been reported previously (31, 34). The opportunity to
extend the amount of detectable species in combination with
the fast assay procedure makes this array-based method an
interesting tool for the rapid and parallel detection of fungal
pathogens. The most time-saving effect from the introduction
of molecular methods for the diagnosis of fungal infections
could be expected if this microarray technique were
success-fully applied directly to clinical samples that are
microscopi-cally positive for fungal elements rather than fungal cultures.
The quality of such a culture-independent diagnostic method is
mainly dependent on the sensitivity of the DNA extraction
method and the PCR protocol, as well as on the specificity of
the target identification at the end of the detection process. All
three steps of this diagnostic process are part of an ongoing
study.
To have a diagnostic tool which can prevail in the routine
clinical laboratory, the spectrum of detectable species should
be expanded. In addition to IFIs due to non-
C
.
albicans
Can-dida
species (43) and non-
A
.
fumigatus Aspergillus
species, the
incidence of invasive mold infections caused by
Zygomycetes
(e.g.,
Rhizopus
,
Mucor
,
Rhizomucor
, or
Absidia
spp.) and
Fusar-ium
spp. increased significantly in the late 1990s (37). It will be
the aim of future studies to develop a more comprehensive
array that includes these fungi as targets to improve the
diag-nosis of emerging yeast and mold infections. Also, yeasts like
Cryptococcus neoformans
, which particularly play a role in the
care of AIDS patients, and representatives of the groups
Tri-chosporon
and
Malassezia
should be included as target species.
As more and more molecular targets which are responsible for
resistance or pathogenicity are currently identified (33), DNA
microarrays also present a promising platform for the parallel
species identification and the detection of pathogenicity factors
or genes that confer resistance (18). The combined
informa-tion about the species and its resistance would then lead to
more efficient therapies while reducing the unwanted selection
pressure of antifungal agents at the same time.
Although today only a limited number of laboratories that
specialize in molecular biology are prepared with suitable
tech-nical equipment, a lot of work is under way, especially for the
application of other, simpler readout systems for microarray
slides. As the number of promising applications for
microar-rays targeting bacterial, parasitic, and fungal pathogens
in-creases, it could be expected that commercial microarray
sys-tems will also be offered in the future at a reasonable price to
a broader spectrum of customers.
Conclusions.
The results presented in this paper showed the
feasibility of the DNA microarray-based method for the
de-tection and identification of 12 of the most common fungal
pathogens belonging to the genus
Candida
or
Aspergillus
. The
assay was demonstrated with isolated genomic DNA
originat-ing from precharacterized fungal strains and blinded clinical
isolates. While mixture analysis and its application to primary
specimens must be performed in the future, the microarray
method can already bring great improvements to the laborious
standard identification procedures and be a rapid tool for the
identification of isolated fungal pathogens.
REFERENCES
1.Anthony, R. M., T. J. Brown, and G. L. French.2000. Rapid diagnosis of bacteremia by universal amplification of 23S ribosomal DNA followed by hybridization to an oligonucleotide array. J. Clin. Microbiol.38:781–788. 2.Behr, T., C. Koob, M. Schedl, A. Mehlen, H. Meier, D. Knopp, E. Frahm, U.
Obst, K. H. Schleifer, R. Niessner, and W. Ludwig.2000. A nested array of rRNA targeted probes for the detection and identification of enterococci by reverse hybridization. Syst. Appl. Microbiol.23:563–572.
[image:9.585.82.500.76.224.2]3.Challier, S., S. Boyer, E. Abachin, and P. Berche.2004. Development of a
FIG. 4. Relative intensities after hybridization with labeled target DNA from blinded samples of clinical isolates. Cutoffs 1 and 2 are as
described in the legend to Fig. 2. The columns depict mean relative signal intensities and their standard deviations over three slides of the same
experiment (
n
⫽
9).
on May 15, 2020 by guest
http://jcm.asm.org/
serum-based TaqMan real-time PCR assay for diagnosis of invasive aspergil-losis. J. Clin. Microbiol.42:844–846.
4.Chen, Y. C., J. D. Eisner, M. M. Kattar, S. L. Rassoulian-Barrett, K. Lafe, S. L. Yarfitz, A. P. Limaye, and B. T. Cookson. 2000. Identification of medically important yeasts using PCR-based detection of DNA sequence polymorphisms in the internal transcribed spacer 2 region of the rRNA genes. J. Clin. Microbiol.38:2302–2310.
5.Chizhikov, V., M. Wagner, A. Ivshina, Y. Hoshino, A. Z. Kapikian, and K. Chumakov.2002. Detection and genotyping of human group A rotaviruses by oligonucleotide microarray hybridization. J. Clin. Microbiol.40:2398– 2407.
6.Coignard, C., S. F. Hurst, L. E. Benjamin, M. E. Brandt, D. W. Warnock, and C. J. Morrison.2004. Resolution of discrepant results for Candida species identification by using DNA probes. J. Clin. Microbiol.42:858–861. 7.Costa, C., D. Vidaud, M. Olivi, E. Bart-Delabesse, M. Vidaud, and S. Bret-agne.2001. Development of two real-time quantitative TaqMan PCR assays to detect circulating Aspergillus fumigatus DNA in serum. J. Microbiol. Methods44:263–269.
8.De Baere, T., G. Claeys, D. Swinne, G. Verschraegen, A. Muylaert, C. Mas-sonet, and M. Vaneechoutte. 2002. Identification of cultured isolates of clinically important yeast species using fluorescent fragment length analysis of the amplified internally transcribed rRNA spacer 2 region (ITS2). BMC Microbiol.2:21.
9.Diaz, M. R., and J. W. Fell.2004. High-throughput detection of pathogenic yeasts of the genus trichosporon. J. Clin. Microbiol.42:3696–3706. 10.Einsele, H., H. Hebart, G. Roller, J. Loffler, I. Rothenhofer, C. A. Muller,
R. A. Bowden, J. van Burik, D. Engelhard, L. Kanz, and U. Schumacher.
1997. Detection and identification of fungal pathogens in blood by using molecular probes. J. Clin. Microbiol.35:1353–1360.
11.Elie, C. M., T. J. Lott, E. Reiss, and C. J. Morrison.1998. Rapid identifi-cation ofCandidaspecies with species-specific DNA probes. J. Clin. Micro-biol.36:3260–3265.
12.Flahaut, M., D. Sanglard, M. Monod, J. Bille, and M. Rossier.1998. Rapid detection ofCandida albicansin clinical samples by DNA amplification of common regions fromC. albicans-secreted aspartic proteinase genes. J. Clin. Microbiol.36:395–401.
13.Fujita, S., B. A. Lasker, T. J. Lott, E. Reiss, and C. J. Morrison.1995. Microtitration plate enzyme immunoassay to detect PCR-amplified DNA fromCandidaspecies in blood. J. Clin. Microbiol.33:962–967.
14.Fukushima, M., K. Kakinuma, H. Hayashi, H. Nagai, K. Ito, and R. Kawaguchi.2003. Detection and identification ofMycobacteriumspecies isolates by DNA microarray. J. Clin. Microbiol.41:2605–2615.
15.Grimm, V., S. Ezaki, M. Susa, C. Knabbe, R. D. Schmid, and T. T. Bach-mann.2004. Use of DNA microarrays for rapid genotyping of TEM beta-lactamases that confer resistance. J. Clin. Microbiol.42:3766–3774. 16.Groll, A. H., P. M. Shah, C. Mentzel, M. Schneider, G. Just-Nuebling, and
K. Huebner.1996. Trends in the postmortem epidemiology of invasive fungal infections at a university hospital. J. Infect.33:23–32.
17.Hagen, E. A., H. Stern, D. Porter, K. Duffy, K. Foley, S. Luger, S. J. Schuster, E. A. Stadtmauer, and M. G. Schuster.2003. High rate of invasive fungal infections following nonmyeloablative allogeneic transplantation. Clin. In-fect. Dis.36:9–15.
18.Hamels, S., J. L. Gala, S. Dufour, P. Vannuffel, N. Zammatteo, and J. Remacle.2001. Consensus PCR and microarray for diagnosis of the genus Staphylococcus, species, and methicillin resistance. BioTechniques31:1364– 1366, 1368, 1370–1372.
19.Haugland, R. A., M. Varma, L. J. Wymer, and S. J. Vesper.2004. Quanti-tative PCR analysis of selected Aspergillus, Penicillium and Paecilomyces species. Syst. Appl. Microbiol.27:198–210.
20.Healy, M., K. Reece, D. Walton, J. Huong, K. Shah, and D. P. Kontoyiannis.
2004. Identification to the species level and differentiation between strains of Aspergillus clinical isolates by automated repetitive-sequence-based PCR. J. Clin. Microbiol.42:4016–4024.
21.Hebart, H., J. Loffler, C. Meisner, F. Serey, D. Schmidt, A. Bohme, H. Martin, A. Engel, D. Bunje, W. V. Kern, U. Schumacher, L. Kanz, and H. Einsele.2000. Early detection of aspergillus infection after allogeneic stem cell transplantation by polymerase chain reaction screening. J. Infect. Dis.
181:1713–1719.
22.Hendolin, P. H., L. Paulin, P. Koukila-Kahkola, V. J. Anttila, H. Malmberg, M. Richardson, and J. Ylikoski.2000. Panfungal PCR and multiplex liquid hybridization for detection of fungi in tissue specimens. J. Clin. Microbiol.
38:4186–4192.
23.Henry, T., P. C. Iwen, and S. H. Hinrichs.2000. Identification ofAspergillus species using internal transcribed spacer regions 1 and 2. J. Clin. Microbiol.
38:1510–1515.
24.Kakinuma, K., M. Fukushima, and R. Kawaguchi. 2003. Detection and identification of Escherichia coli, Shigella, and Salmonella by microarrays using the gyrB gene. Biotechnol. Bioeng.83:721–728.
25.Kan, V. L.1993. Polymerase chain reaction for the diagnosis of candidemia. J. Infect. Dis.168:779–783.
26.Kauffman, C. A.2004. Zygomycosis: reemergence of an old pathogen. Clin. Infect. Dis.39:588–590.
27.Kim, C. J., J. K. Jeong, M. Park, T. S. Park, T. C. Park, S. E. Namkoong, and J. S. Park.2003. HPV oligonucleotide microarray-based detection of HPV genotypes in cervical neoplastic lesions. Gynecol. Oncol.89:210–217. 28.Lapa, S., M. Mikheev, S. Shchelkunov, V. Mikhailovich, A. Sobolev, V.
Blinov, I. Babkin, A. Guskov, E. Sokunova, A. Zasedatelev, L. Sandakhchiev, and A. Mirzabekov.2002. Species-level identification of orthopoxviruses with an oligonucleotide microchip. J. Clin. Microbiol.40:753–757.
29.Li, J., S. Chen, and D. H. Evans.2001. Typing and subtyping influenza virus using DNA microarrays and multiplex reverse transcriptase PCR. J. Clin. Microbiol.39:696–704.
30.Lindsley, M. D., S. F. Hurst, N. J. Iqbal, and C. J. Morrison.2001. Rapid identification of dimorphic and yeast-like fungal pathogens using specific DNA probes. J. Clin. Microbiol.39:3505–3511.
31.Loeffler, J., H. Hebart, U. Schumacher, H. Reitze, and H. Einsele.1997. Comparison of different methods for extraction of DNA of fungal pathogens from cultures and blood. J. Clin. Microbiol.35:3311–3312.
32.Loeffler, J., H. Hebart, S. Sepe, U. Schumacher, T. Klingebiel, and H. Einsele.1998. Detection of amplified fungal DNA by using a PCR-ELISA system. Med. Mycol.36:275–279.
33.Loeffler, J., S. L. Kelly, H. Hebart, U. Schumacher, C. Lass-Florl, and H. Einsele.1997. Molecular analysis of cyp51 from fluconazole-resistant Can-dida albicans strains. FEMS Microbiol. Lett.151:263–268.
34.Loeffler, J., K. Schmidt, H. Hebart, U. Schumacher, and H. Einsele.2002. Automated extraction of genomic DNA from medically important yeast species and filamentous fungi by using the MagNA Pure LC system. J. Clin. Microbiol.40:2240–2243.
35.Mannarelli, B. M., and C. P. Kurtzman.1998. Rapid identification of Can-dida albicansand other human pathogenic yeasts by using short oligonucle-otides in a PCR. J. Clin. Microbiol.36:1634–1641.
36.Marr, K. A.2004. Invasive Candida infections: the changing epidemiology. Oncology (Huntington)18:9–14.
37.Marr, K. A., R. A. Carter, F. Crippa, A. Wald, and L. Corey.2002. Epide-miology and outcome of mould infections in hematopoietic stem cell trans-plant recipients. Clin. Infect. Dis.34:909–917.
38.Martin, C., D. Roberts, W. M. van Der, R. Rossau, G. Jannes, T. Smith, and M. Maher.2000. Development of a PCR-based line probe assay for identi-fication of fungal pathogens. J. Clin. Microbiol.38:3735–3742.
39.Rex, J. H., and M. A. Pfaller.2002. Has antifungal susceptibility testing come of age? Clin. Infect. Dis.35:982–989.
40.Sandhu, G. S., B. C. Kline, L. Stockman, and G. D. Roberts.1995. Molecular probes for diagnosis of fungal infections. J. Clin. Microbiol.33:2913–2919. 41.Shin, J. H., F. S. Nolte, and C. J. Morrison.1997. Rapid identification of
Candidaspecies in blood cultures by a clinically useful PCR method. J. Clin. Microbiol.35:1454–1459.
42.Thompson, J. D., T. J. Gibson, F. Plewniak, F. Jeanmougin, and D. G. Higgins.1997. The CLUSTAL_X windows interface: flexible strategies for multiple sequence alignment aided by quality analysis tools. Nucleic Acids Res.25:4876–4882.
43.Trick, W. E., S. K. Fridkin, J. R. Edwards, R. A. Hajjeh, and R. P. Gaynes.
2002. Secular trend of hospital-acquired candidemia among intensive care unit patients in the United States during 1989–1999. Clin. Infect. Dis.35:
627–630.
44.Turenne, C. Y., S. E. Sanche, D. J. Hoban, J. A. Karlowsky, and A. M. Kabani.1999. Rapid identification of fungi by using the ITS2 genetic region and an automated fluorescent capillary electrophoresis system. J. Clin. Mi-crobiol.37:1846–1851.
45.Volokhov, D., V. Chizhikov, K. Chumakov, and A. Rasooly.2003. Microar-ray-based identification of thermophilicCampylobacter jejuni,C. coli,C. lari, andC. upsaliensis. J. Clin. Microbiol.41:4071–4080.
46.Volokhov, D., A. Rasooly, K. Chumakov, and V. Chizhikov.2002. Identifi-cation ofListeriaspecies by microarray-based assay. J. Clin. Microbiol.40:
4720–4728.
47.Wald, A., W. Leisenring, J. A. vanBurik, and R. A. Bowden.1997. Epidemi-ology of Aspergillus infections in a large cohort of patients undergoing bone marrow transplantation. J. Infect. Dis.175:1459–1466.
48.Walsh, T. J., A. Francesconi, M. Kasai, and S. J. Chanock.1995. PCR and single-strand conformational polymorphism for recognition of medically im-portant opportunistic fungi. J. Clin. Microbiol.33:3216–3220.
49.Wang, R. F., M. L. Beggs, L. H. Robertson, and C. E. Cerniglia.2002. Design and evaluation of oligonucleotide-microarray method for the detection of human intestinal bacteria in fecal samples. FEMS Microbiol. Lett.213:175– 182.
50.White, P. L., A. Shetty, and R. A. Barnes.2003. Detection of seven Candida species using the Light-Cycler system. J. Med. Microbiol.52:229–238. 51.White, P. L., D. W. Williams, T. Kuriyama, S. A. Samad, M. A. Lewis, and
R. A. Barnes.2004. Detection ofCandidain concentrated oral rinse cultures by real-time PCR. J. Clin. Microbiol.42:2101–2107.
52.White, T. J., T. Bruns, S. Lee, and J. Taylor.1990. Amplification and direct sequencing of fungal ribosomal RNA genes for phylogenetics, p. 315–322.In M. Innis, D. Gelfand, J. Sninsky, and T. White (ed.), PCR protocols: a guide to methods and application. Academic Press, Inc., San Diego, Calif. 53.Williams, D. W., W. A. Coulter, M. J. Wilson, A. J. Potts, and M. A. Lewis.
on May 15, 2020 by guest
http://jcm.asm.org/
2001. Identification of Candida dubliniensis, based on ribosomal DNA se-quence analysis. Br. J. Biomed. Sci.58:11–16.
54.Wingard, J. R.2005. The changing face of invasive fungal infections in hematopoietic cell transplant recipients. Curr. Opin. Oncol.17:89–92. 55.Yu, X., M. Susa, C. Knabbe, R. D. Schmid, and T. T. Bachmann.2004.
Development and validation of a diagnostic DNA microarray to detect quinolone-resistantEscherichia coliamong clinical isolates. J. Clin. Micro-biol.42:4083–4091.
56.Zhao, W., W. Liu, Q. Liu, L. Zhang, Z. Zhou, X. Liu, and H. Zhang.2002. Genotyping of hepatitis C virus by hepatitis gene diagnosis microarray. Zhonghua Yi. Xue. Za Zhi.82:1249–1253.
57.Zwart, G., E. J. van Hannen, M. P. Kamst-van Agterveld, K. Van der Gucht, E. S. Lindstrom, J. Van Wichelen, T. Lauridsen, B. C. Crump, S. K. Han, and S. Declerck.2003. Rapid screening for freshwater bacterial groups by using reverse line blot hybridization. Appl. Environ. Microbiol.69:5875– 5883.