0095-1137/05/$08.00⫹0 doi:10.1128/JCM.43.11.5705–5714.2005
Copyright © 2005, American Society for Microbiology. All Rights Reserved.
Campylobacter coli
in Swine Production: Antimicrobial Resistance
Mechanisms and Molecular Epidemiology
Siddhartha Thakur and Wondwossen A. Gebreyes*
Department of Population Health and Pathobiology, College of Veterinary Medicine, North Carolina State University, 4700 Hillsborough St., Raleigh, North Carolina 27606
Received 18 May 2005/Returned for modification 5 July 2005/Accepted 15 August 2005
The aim of this study was to determine antimicrobial resistance, to evaluate and compare the use of two
genotyping methods for molecular epidemiology purposes, and to determine the genotypic diversity of
Campy-lobacter coliof porcine origin. A total of 100 C. coliisolates from swine were tested for susceptibility to six
antimicrobials using the agar dilution method and genotyped using two high-resolution fingerprinting ap-proaches: multilocus sequence typing (MLST) and pulsed-field gel electrophoresis (PFGE). Evaluation of the methods was based on their resistance patterns, discriminatory indexes (DI), high test throughputs, costs, and turnaround times. Resistance to erythromycin and tetracycline was the most common. Both genotypic methods
were found to have high discriminatory power, although MLST had a higher DI (0.936) than PFGE (DIⴝ
0.889). It also had a higher throughput than PFGE. Isolates were clustered into 27 groups by MLST compared to 11 by PFGE. MLST was able to further discriminate the isolates grouped under the same cluster by PFGE. Out of the 65 MLST sequence types (STs) identified among the total isolates, 50 were reported for the first
time. Most STs were found to be specific to the farm (nⴝ38) and to slaughter (nⴝ22). Resistance against
tetracycline and erythromycin was encoded by thetet(O) gene and a A2075G point mutation in the 23S rRNA
gene, respectively. A high ciprofloxacin MIC (>64g/liter) was conferred by a point mutation in thegyrAgene.
The weak clonal structure of theC. coli population among swine was further highlighted by the index of
association value of 0.293. The findings of this study indicate that multidrug-resistant diverseC. colistrains
exhibiting resistance to ciprofloxacin and erythromycin are concerning, since these are the drugs of choice for treating invasive campylobacteriosis cases in humans.
Food-borne pathogens result in approximately 76 million illnesses in the United States every year (27).Campylobacteris the most common cause of bacterial gastroenteritis with an estimated 2.5 million cases annually in the United States and in 54,000 cases in the United Kingdom (1, 27). The preliminary data, as estimated by FoodNet, for diseases caused by enteric pathogens for the year 2004 showCampylobacterto have an incidence of 12.9 per 100,000 persons (2).Campylobacter jejuni in humans is considered to be the most important Campy-lobacter species, causing 95% of the food-borne infections. Data from the United Kingdom implicatedC. jejunias being responsible for 91.9% of the cases, followed byCampylobacter coliwith 7.9% (6).
Poultry has been recognized as the primary reservoir of C. jejuni, while pigs are mostly implicated as reservoirs of C. coli (19, 20). Recent studies conducted in Spain and the United Kingdom have highlighted the importance ofC. colias an important human pathogen due to its ability to show in-creased resistance to greater number of antimicrobials and because it causes more indigenously acquired food-borne dis-eases thanSalmonella entericaserovar Typhimurium (40, 44). C. colihas been suggested to be particularly suited to the swine production environment and has been isolated from pigs on farms in up to 100% of the samples collected (40).
Epidemi-ological evidence has suggested the zoonotic transmission of this pathogen from animals to humans (3, 25). Although most of the human cases are sporadic in nature, outbreaks caused by Campylobacterspp. have been reported in the past, caused by the consumption of raw milk and contaminated water (30, 39). It is important to use typing methods that have high discrim-inatory power to identify and differentiate sources of this pathogen in animals, humans, and the environment. Many phenotypic and genotypic methods have been developed for Campylobacter (32). Multilocus sequence typing (MLST) is one such genotypic method that is based on indexing the ge-netic variation in housekeeping genes (7). This technique has been successfully employed for studying the longitudinal epi-demiology ofC. jejuniin human, animal, and environmental samples (5). Recently, the standardization of the MLST typing method was extended toC. coli (8). However, no molecular epidemiological study has been reported using MLST forC. coli. Pulsed-field gel electrophoresis (PFGE) is another geno-typing method that has been used for investigatingC. jejuni outbreaks and genotypingC. coli(21, 28, 34, 42). Although this method is highly discriminatory, interlaboratory comparisons could be difficult due to complex protocols and accessibility of equipment and software for analyzing the patterns in multiple laboratories.
Prompted by the importance of C. coli as a food-borne pathogen and the paucity of molecular epidemiological infor-mation on this species, we conducted this study. The aim of this study was to evaluate and compare the use of MLST and PFGE for genotyping C. coli isolates from swine based on discriminatory power, throughput, cost, and time. In this study, * Corresponding author. Mailing address: Department of
Popula-tion Health and Pathobiology, College of Veterinary Medicine, North Carolina State University, 4700 Hillsborough St., Raleigh, NC 27606. Phone: (919) 513-8291. Fax: (919) 515-3044. E-mail: wagebrey@ncsu .edu.
5705
on May 15, 2020 by guest
http://jcm.asm.org/
we also determined the resistance mechanisms coding for pre-dominant antimicrobial resistance phenotypes and show evi-dence of the clonal structure ofC. coliby measuring the index of association (IA).
MATERIALS AND METHODS
Origin ofC. colistrains.A total of 100 isolates were randomly selected from 1,459C. coliisolates that were isolated as a part of a cross-sectional study conducted on swine farms and slaughter plants (46). The selected strains were from the conventional and antimicrobial-free (ABF) production systems repre-sentative of the processing stages at farm and slaughter, and the resistance patterns were observed during the entire study. Briefly, a total of 21 groups of pigs that belong to two distinct production systems (11 conventional and 10 ABF farms) were sampled at the nursery farms (6 weeks of age) and finishing farms (within 48 h of slaughter) followed by carcass swab sampling at the slaughter plant. Collection of swab samples at slaughter was done at three stages, including preevisceration, postevisceration, and postchill. Prior to testing, the isolates were recovered from storage at⫺80°C and streaked on Mueller-Hinton agar supple-mented with 5% sheep blood. All the incubations were done under microaerobic conditions at 42°C for 48 h. Antimicrobial susceptibility testing was done using the agar dilution method as described below. Genotyping of theC. coliisolates was done by MLST and PFGE as described later in this section.
Antimicrobial susceptibility testing.The agar dilution method was used as recommended by the National Committee for Clinical Laboratory Standards (NCCLS) subcommittee on Veterinary Antimicrobial Susceptibility Testing for determining the susceptibility ofCampylobacterisolates to different antimicro-bials (31). We tested the isolates for their susceptibility against a panel of six antimicrobials. The following is a list of antimicrobials with their abbreviations and ranges of concentrations used: chloramphenicol (CHL; 0.25 to 128g/liter), ciprofloxacin (CIP; 0.008 to 4g/liter), erythromycin (ERY; 0.06 to 32g/liter), gentamicin (GEN; 0.06 to 32g/liter), nalidixic acid (NAL; 0.25 to 128g/liter), and tetracycline (TET; 0.06 to 32g/liter) (14). All the antimicrobials were procured from Sigma (Sigma, MO) except ciprofloxacin (Serologicals Proteins, Inc., IL). The NCCLS breakpoint interpretative criteria for the Enterobacteri-aceaefamily were used for all the antimicrobials except erythromycin as recom-mended by NCCLS, as the interpretive standard breakpoint levels for the
Campylobacteriaceaefamily are not yet available (14). For erythromycin (8g/ liter), the breakpoint level used by the National Antimicrobial Resistance Mon-itoring System was adopted (12).C. jejuniATCC 33560 was used as the quality control organism for this test (14). The MIC50breakpoints used for each
anti-microbial were as follows: chloramphenicol (32g/liter), ciprofloxacin (4g/ liter), erythromycin (8g/liter), gentamicin (16g/liter), nalidixic acid (32g/ liter), and tetracycline (16g/liter).Campylobacterisolates showing resistance against ciprofloxacin at the concentration of 4g/liter (the highest on the orig-inal panel) were further tested at higher concentrations of the antimicrobial up to 64g/liter. Multidrug resistance here is defined as isolates exhibiting resis-tance against three or more antimicrobials simultaneously.
MLST.Genomic DNA purification of the isolates for sequencing was done using a QIAGEN DNA purification kit (QIAGEN, Valencia, CA). MLST of the seven housekeeping genes (aspA,glnA,gltA,glyA,pgm,tkt, anduncA) forC. coli
was done following the method described previously (8). Briefly, all the house-keeping genes were amplified using PCR, and the products were run on agarose gel to confirm the correct amplicon size. Purification of the PCR products was done using a QiaAmp PCR purification kit following the manufacturer’s instruc-tions (QIAGEN, Valencia, CA). Sequencing reacinstruc-tions using the forward and reverse primers in separate wells was done using 2l of the BigDye Ready Reaction mix (version 3.1; Applied Biosystems, Foster City, California), 0.5l of 1:15 diluted primer, 5.5l of molecular grade deionized water, and 2l of the purified PCR product. The sequencing reaction was performed on an automated 3700 ABI capillary sequencer (Applied Biosystems, Foster City, California) with running conditions of 30 cycles of 96°C for 10 s, 50°C for 5 s, and 60°C for 4 min. We used the ClustalW program for aligning the forward and reverse sequences (www.ebi.ac.uk/clustalw). The allelic profiles and the sequence types (STs) were then generated by blasting the correct sequence size on the MLST website from theCampylobacterdatabase (accessible at http://www.pubmlst.org/campylobacter or http://www.mlst.net). A dendrogram for the MLST data was generated using the START software (23).
PFGE.PFGE was done following the rapid protocol forCampylobacter(38). Briefly, 400-ml overnight culture cells were lysed, and intact genomic DNA was digested in agarose-embedded plugs with SmaI restriction enzyme. The digested DNA was then separated by using a contour-clamped homogeneous electric field
(CHEF)-DRIII (Bio-Rad Laboratories, Hercules, CA) with the following con-ditions: 0.5⫻Tris–borate–EDTA, 1% SeaKem Gold agarose (FMC BioProd-ucts, Rockland, ME), 14°C, 6 V/cm for 18 h with switch times ranging from 6.75 to 38.35 s with an included angle of 120°.S. entericaserovar Braenderup 17 Universal Marker (kindly provided by Leslie Wolf, North Carolina State Labo-ratory of Public Health, NC) was used as the reference marker. Gels were stained with ethidium bromide for 30 min, destained three times for 20 min each with distilled water, and photographed using an Alpha imager (Alpha 20 Innotech Corporation, San Leandro, CA). Analysis of PFGE data was performed using Bionumerics software (Applied Maths, Kortrijik, Belgium) using a “different bands” algorithm for clustering and the Ward algorithm of tree building ap-proach with 0.47% optimization and 0.48% position tolerance determined by using procedures recommended by the manufacturer. Visual inspection of the patterns was performed as a final step for analysis.
Characterization of resistance genes.A total of 21 multidrug-resistantC. coli
isolates were selected for further molecular characterization to determine the resistance genes coding for antimicrobial resistance against tetracycline and erythromycin and the class I integron. PCR was used to target thetet(O) and
tet(M) genes for tetracycline resistance and a mutation at position 2075 in the 23S rRNA for erythromycin resistance, as explained previously (15, 16, 35). Class I integrons were targeted in these isolates following the method described by O’Halloran et al. (33). Targeting of the threonine-to-isoleucine point mutation in the quinolone resistance-determining region (QRDR) of thegyrAgene confer-ring resistance to ciprofloxacin resistance was done using the mismatch mutation amplification assay (MAMA) PCR (49). Amplification reactions were carried out with 1l of purified DNA (QIAGEN DNAeasy tissue kit; QIAGEN, Valencia, CA), 300M deoxynucleoside triphosphate, 2.5 mM MgCl2, 50 pmol of primers,
and 0.5 U of GoldTaqpolymerase (Perkin-Elmer, Foster City, CA). Distilled water was added to bring the final volume to 20l. The PCR cycle included initial denaturation at 95°C for 5 min and 30 cycles of denaturation for 1 min at 95°C, primer annealing for 1 min at 54°C, and extension for 1 min at 72°C.
Data analysis.Simpson’s index of diversity was calculated to compare the discriminatory power of the two genotyping methods used in this study (22). TheIAwas determined using the START program to assess the clonality of the population (26). An absolute value of zero (IA⫽0) indicates that the population is freely recombining and is not clonal. A value of 1.0 indicates the high genetic diversity of isolates.
RESULTS
Diversity of sequence types across the two production
sys-tems based on MLST. Assignment of the allele frequencies
and STs was done using algorithms described in the Campy-lobacterMLST database (accessible at http://www.pubmlst.org /campylobacter or http://www.mlst.net). A total of 65 STs were generated from sequence typing of 100C. coliisolates with 47 STs occurring singly and ST-1413 being the most common seen in seven isolates from the carcasses of ABF pigs. Based on the allelic profiles of the housekeeping genes, 50 new STs were assigned for the first time after submitting the information to the MLST database. Twenty-four out of the 50 new STs orig-inated from the ABF swine production units. The remaining 26 new STs were from C. coli isolates from the conventional production system. Within individual production systems, we observed STs that were found specific to the processing stages either at the farm or slaughter, with 38 out of the 65 STs found to be specific to the farm and another 22 found only at the slaughter stage (Table 1). The three most predominant STs occurring in the database included 1413 (7 isolates), ST-854 (6 isolates), and ST-1123 (5 isolates), representing 18% of the isolates. Multiple STs were generated for individual anti-microbial resistance patterns, with the majority being specific either to the farm or the slaughter stage (Table 1). For in-stance, ST-1413 (n⫽7) was observed only among theC. coli ciprofloxacin-resistant strains (resistance pattern: CIP ERY NAL TET) isolated from the conventional nursery pigs.
on May 15, 2020 by guest
http://jcm.asm.org/
ever, two additional isolates from the same farm and sharing the same resistance pattern as above had different STs (ST-1096, cluster 9; and ST-19, cluster 19).
Based on the MLST dendrogram generated by the START program (data not shown), we observed a total of 27 clusters, with cluster 9 being the largest (n ⫽ 18) (Table 2). Seven isolates were represented by single branches and occurred in-dependently without being a part of any group. A majority of the isolates (n ⫽16) in cluster 9 were from the nursery and finishing farms and included 8 out of the 15 ciprofloxacin-resistant C. coli isolates. Clusters 2, 5, 6, 19, and 21 were comprised of isolates from the farm, while clusters 7, 8, and 24 included slaughter isolates only. Multiple STs were found among isolates from a single farm at different stages of pro-cessing both at farm and slaughter. For example, isolates 2003 and 2032 with the tetracycline resistance pattern (TET) were isolated from the same ABF farm but were associated with ST-890 and -825, respectively. Similarly, isolates 3490 and 3491 were from the same pig (TET resistant) reared in the conven-tional system but were associated with two different STs, ST-1130 and ST-854, respectively.
TheIAfor the whole population was 0.293, indicating a weak clonal structure. However, theIAvalues for the ABF and the conventional populations were 0.279 and 0.535, respectively, indicating a higher clonality ofC. coliisolates from the con-ventional system. Simpson’s index of diversity calculated for the MLST method was found to be 0.936. Such a high DI value indicates that MLST has a very high discriminatory power.
Genotypic diversity based on PFGE fingerprinting. The
SmaI-digested genome ofC. coliresulted in the generation of an average of 6 to 10 bands. Using 70% genetic similarity as the cutoff, a total of 11 clusters were observed, with clusters 1 (17 isolates), 11 (16 isolates), and 3 (15 isolates) being the pre-dominant ones comprising 48% of the total isolates (Fig. 1). We followed the recommended criteria for interpreting PFGE banding patterns, with isolates differing by one to three bands being most likely clonal (45).
Three clusters had isolates grouped together based on their antimicrobial resistance patterns. These included cluster 4 (n⫽4; TET), cluster 6 (n⫽3; TET), and cluster 10 (n⫽6; CIP ERY NAL TET). All the isolates from cluster 6 and five out of six isolates in cluster 10 were epidemiologically related,
being isolated from the same slaughter and farm groups. One group of isolates each in clusters 1 (isolates 762, 3995, and 4037) and 11 (isolates 26, 793, and 794) were epidemiologically related, representing the nursery, finishing, and slaughter stages of two different ABF farms. However, other isolates from these farms and slaughter stages were found to be unre-lated and clustered separately. Overall, the population exhib-ited considerable genotypic diversity. The remaining clusters were very diverse based on the location and time of isolation and the resistance patterns of these isolates. This indicates the diverse nature of theC. coliisolates. The PFGE method had a discriminatory index of 0.889.
Comparison of clustering by MLST and PFGE.We
identi-fied a total of 27 and 11 clusters for the 100C. coli isolates genotyped using MLST and PFGE, respectively. The associa-tion of MLST STs with PFGE clusters is shown in Fig. 1 and Table 2. Out of the 65 MLST STs observed for the complete data set, 53 STs (81.5%) representing 62C. coliisolates were represented by a single PFGE cluster, indicating that these isolates were not distinguished by the PFGE method. The remaining 12 STs were clustered in two to three PFGE clus-ters. A single PFGE cluster (cluster 4) was found to be asso-ciated with a single ST (ST-854). The remaining 10 PFGE clusters were associated with multiple STs. PFGE type 1 was the most heterogeneous cluster and included 16 STs represent-ing the farm and slaughter stages of both production systems. This indicates the poor correlation in polymorphism between MLST and PFGE findings.
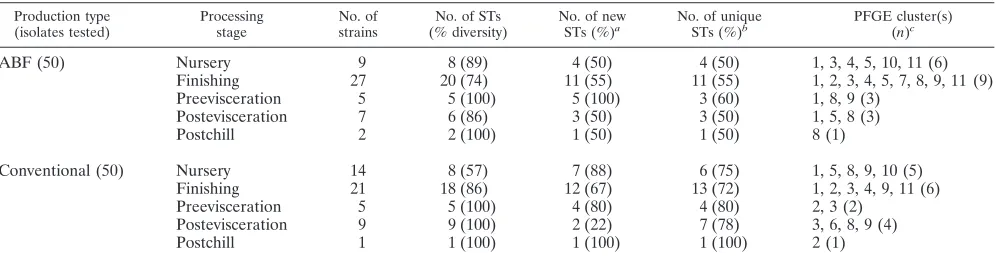
[image:3.585.44.542.80.209.2]Both of the methods were able to further differentiate the isolates clustered together in a single group by either MLST or PFGE. For example, PFGE cluster types 1 (n⫽17 isolates) and 11 (n ⫽ 16 isolates) were differentiated into 10 and 8 MLST clusters, respectively. Similarly, MLST cluster 9 (n⫽18 isolates) was represented by six PFGE clusters when typed by PFGE. However, we found that MLST had a better discrimi-natory power of 0.936 compared to 0.889 for PFGE. Visual comparison of the two genotyping approaches as shown in Table 2 reflected the ability of MLST to discriminate better between isolates that were clustered in the same group by PFGE. Overall, MLST was able to discriminate better between theC. coliisolates from the conventional and the ABF systems. MLST had a higher test throughput, as reactions can be carried TABLE 1. Total number ofC. coliisolates under each production system including the MLST sequence types and PFGE clusters
Production type (isolates tested)
Processing stage
No. of strains
No. of STs (% diversity)
No. of new STs (%)a
No. of unique STs (%)b
PFGE cluster(s) (n)c
ABF (50) Nursery 9 8 (89) 4 (50) 4 (50) 1, 3, 4, 5, 10, 11 (6)
Finishing 27 20 (74) 11 (55) 11 (55) 1, 2, 3, 4, 5, 7, 8, 9, 11 (9)
Preevisceration 5 5 (100) 5 (100) 3 (60) 1, 8, 9 (3)
Postevisceration 7 6 (86) 3 (50) 3 (50) 1, 5, 8 (3)
Postchill 2 2 (100) 1 (50) 1 (50) 8 (1)
Conventional (50) Nursery 14 8 (57) 7 (88) 6 (75) 1, 5, 8, 9, 10 (5)
Finishing 21 18 (86) 12 (67) 13 (72) 1, 2, 3, 4, 9, 11 (6)
Preevisceration 5 5 (100) 4 (80) 4 (80) 2, 3 (2)
Postevisceration 9 9 (100) 2 (22) 7 (78) 3, 6, 8, 9 (4)
Postchill 1 1 (100) 1 (100) 1 (100) 2 (1)
a
Sequence types that have been reported for the first time. b
Sequence types that were found only in the specific processing stage. c
Total PFGE clusters and the cluster numbers where the sequence types were grouped.
on May 15, 2020 by guest
http://jcm.asm.org/
TABLE 2. MLST and PFGE data for the 100C. coliisolates
Production system
Processing stage
Resistance
patternb Isolate ID
Allelic profile
STc MLST cluster
PFGE cluster
aspA glnA gltA glyA pgm tkt uncA
ABF Nursery NAL 53 33 39 30 78 104 43 17 1068 4 5
ABF Nursery Pansusceptible 183 33 39 30 82 104 43 68 1112 22 11
ABF Nursery Pansusceptible 752 33 38 30 82 104 173 68 1134 18 11
ABF Nursery ERY TET 26 33 39 37 82 104 43 68 1414 21 11
ABF Nursery Pansusceptible 252 33 39 37 82 104 43 68 1414 21 3
ABF Nursery TET 762 33 39 30 174 118 35 17 1431 6 1
ABF Nursery ERY NAL TET 7 33 39 46 82 104 43 68 1437 21 1
ABF Nursery CIP NAL TET 260 33 153 30 82 104 44 17 1438 15 10
ABF Nursery TET 206 33 38 30 82 104 43 17 854 4 4
ABF Finishing TET 4010 33 38 30 82 104 43 17 854 4 4
ABF Finishing TET 4082 33 38 30 82 104 43 17 854 4 4
ABF Finishing TET 2003 33 38 30 82 104 35 36 890 9 3
ABF Finishing ERY NAL TET 2112 33 38 30 82 104 35 17 1096 9 3
ABF Finishing ERY 793 33 38 30 82 152 173 68 1102 18 11
ABF Finishing ERY TET 786 33 39 30 82 104 43 68 1112 22 2
ABF Finishing Pansusceptible 3518 53 38 44 82 118 35 36 1123 13 2
ABF Finishing Pansusceptible 3978 53 38 44 82 118 35 36 1123 13 8
ABF Finishing NAL TET 953 33 38 30 82 104 173 68 1134 18 11
ABF Finishing Pansusceptible 2059 33 38 30 82 104 173 68 1134 18 11
ABF Finishing Pansusceptible 3819 33 38 30 82 104 173 68 1134 18 11
ABF Finishing TET 4115 53 38 30 82 118 35 36 1200 13 8
ABF Finishing CIP NAL TET 4076 33 39 132 82 104 44 17 1424 3 7
ABF Finishing Pansusceptible 3969 53 38 30 81 118 85 36 1426 1 11
ABF Finishing ERY TET 3995 33 39 30 79 104 56 17 1427 5 1
ABF Finishing ERY 1987 33 39 30 82 118 35 36 1432 12 5
ABF Finishing ERY NAL TET 952 33 39 134 82 104 56 17 1433 5 1
ABF Finishing TET 4077 33 39 44 82 104 44 17 1436 3 7
ABF Finishing ERY TET 1010 33 38 30 82 118 35 17 1446 9 3
ABF Finishing ERY TET 4017 33 38 30 82 118 35 17 1446 9 3
ABF Finishing Pansusceptible 1038 33 38 32 82 104 35 68 1447 18 11
ABF Finishing ERY TET 2164 53 39 44 82 118 35 17 1448 11 8
ABF Finishing ERY TET 2191 53 39 44 82 104 35 36 1450 10 1
ABF Finishing NAL 3552 53 39 44 82 104 35 36 1450 10 8
ABF Finishing CIP NAL TET 4075 33 39 46 82 104 44 17 1452 3 7
ABF Finishing Pansusceptible 4100 33 39 46 82 104 44 17 1452 3 7
ABF Finishing TET 2032 33 39 30 82 113 47 17 825 2 9
ABF Preevisceration ERY 794 33 39 47 82 104 43 36 1415 22 11
ABF Preevisceration Pansusceptible 4029 33 39 30 82 118 35 36 1432 12 8
ABF Preevisceration Pansusceptible 843 33 39 30 82 104 85 17 1445 4 1
ABF Preevisceration Pansusceptible 3580 53 39 44 82 104 35 36 1450 10 8
ABF Preevisceration Pansusceptible 3600 53 39 37 82 104 85 17 1451 25 1
ABF Postevisceration ERY TET 4037 33 38 30 82 104 35 36 890 9 1
ABF Postevisceration TET 2205 33 38 30 78 104 35 17 1113 8 5
ABF Postevisceration TET 4042 53 38 44 82 118 35 36 1123 13 8
ABF Postevisceration TET 4049 53 38 44 82 118 35 36 1123 13 8
ABF Postevisceration ERY 817 33 153 30 82 118 43 17 1416 15 1
ABF Postevisceration ERY 4055 33 39 30 82 118 35 36 1432 12 8
ABF Postevisceration TET 2207 33 38 37 78 104 35 17 1449 8 5
ABF Postchill Pansusceptible 3635 33 39 30 82 104 43 17 828 4 8
ABF Postchill ERY 3630 53 38 30 81 118 35 36 1469 1 8
Conva Nursery CIP ERY NAL TET 475 33 38 30 82 104 35 17 1096 9 5
Conv Nursery CIP ERY NAL TET 524 33 38 30 82 104 117 17 1413 9 10
Conv Nursery CIP ERY NAL TET 525 33 38 30 82 104 117 17 1413 9 1
Conv Nursery CIP ERY NAL TET 549 33 38 30 82 104 117 17 1413 9 9
Conv Nursery CIP ERY NAL TET 552 33 38 30 82 104 117 17 1413 9 9
Conv Nursery CIP ERY NAL TET 554 33 38 30 82 104 117 17 1413 9 10
Conv Nursery CIP ERY NAL TET 555 33 38 30 82 104 117 17 1413 9 10
Conv Nursery CIP ERY NAL TET 556 33 38 30 82 104 117 17 1413 9 10
Conv Nursery ERY 84 33 39 44 82 104 35 36 1417 10 8
Conv Nursery ERY TET 503 33 39 46 174 104 35 17 1418 6 1
Conv Nursery CIP ERY GEN NAL TET 548 33 38 46 82 104 117 17 1419 19 9
Conv Nursery CIP ERY GEN NAL TET 461 33 39 46 82 113 35 17 1440 2 1
Conv Nursery CIP ERY NAL TET 526 33 38 37 82 104 117 17 1441 19 11
Conv Nursery ERY GEN TET 533 33 39 30 82 113 117 17 1465 2 1
Conv Finishing ERY TET 3441 33 38 30 82 104 43 17 854 4 2
Conv Finishing TET 3736 33 38 30 82 104 43 17 854 4 4
Conv Finishing ERY TET 4246 33 39 30 82 104 43 36 1056 22 2
Continued on following page
on May 15, 2020 by guest
http://jcm.asm.org/
out in 96-well plates. However, PFGE was more cost-effective, costing approximately $7.00 per reaction compared to $42 for MLST.
Identification of antimicrobial resistance genes. All of the
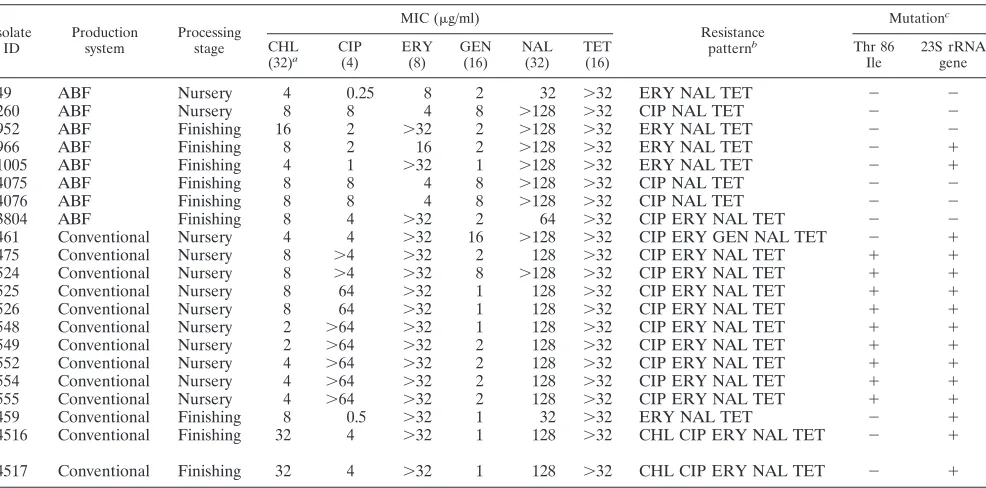
21C. coliisolates were positive for thetet(O) gene as shown in Table 3. These isolates were resistant at the highest concen-tration of tetracycline tested (32 g/liter). A point mutation from adenine to guanine at position A2075G in the peptidyl transferase region of 23S rRNA was detected in all C. coli isolates that were resistant to erythromycin. Sixteen of the 21 isolates were resistant at the highest concentration of erythro-mycin tested (32g/liter). A single isolate for which the MIC was 16 g/liter also carried the point mutation in the 23S rRNA gene. Ten of the 17 ciprofloxacin-resistantC. coli iso-lates were positive by MAMA PCR, indicating the point mu-tation at amino acid position 86 with threonine (Thr) replaced by isoleucine (Ile) (Table 3).
Ciprofloxacin-resistantC. coliisolates that were resistant at the concentration of 4g/liter were further tested by the same method at concentrations up to 64g/liter to determine the MIC. Five out of the 10C. coliisolates were found resistant at the highest concentration tested, while an MIC of 64g/liter was found for two isolates. Overall, MICs for ciprofloxacin
were higher for isolates from the conventional system than for those from the ABF system. Sequencing of the QRDR of the gyrAregion for all of the 17 isolates revealed a point mutation at amino acid position 147 with glutamic acid replaced by aspartic acid (GAA replaced by GAC) and two silent muta-tions in isolates 554 and 556 at posimuta-tions 116 (alanine; GCA replaced by GCT) and 108 (glycine; GGA replaced by GGC), respectively (Table 3). The remaining isolates, including the MAMA PCR-negative isolates, did not reveal any mutation in their QRDRs.
DISCUSSION
There are a multitude of studies that have reported the weak clonal population structure and the hypervariable genome of Campylobacter(7, 8, 34, 47). This makes the choice of using a genotyping method for determining the source of an outbreak or comparing isolates from different sources more complex and difficult to interpret. To circumvent this problem, an MLST scheme was developed forC. jejuniand has been shown to be a reliable method for typing human, animal, and environmen-tal strains of this pathogen (5, 7, 24, 25, 42). Recently, the MLST scheme was extended for typingC. coli, another impor-TABLE 2—Continued
Production system
Processing stage
Resistance
patternb Isolate ID
Allelic profile
STc MLST cluster
PFGE cluster
aspA glnA gltA glyA pgm tkt uncA
Conv Finishing ERY TET 827 33 153 30 82 104 35 17 1059 15 3
Conv Finishing CHL ERY TET 4511 33 38 30 82 104 35 17 1096 9 3
Conv Finishing ERY 872 33 38 30 82 104 85 17 1177 9 3
Conv Finishing ERY TET 4489 33 39 44 82 104 35 36 1417 10 2
Conv Finishing TET 648 32 39 115 115 104 85 17 1420 26 1
Conv Finishing ERY TET 423 33 38 46 82 104 173 17 1422 19 11
Conv Finishing ERY TET 429 33 39 46 82 104 47 17 1423 3 1
Conv Finishing CHL CIP ERY NAL TET 4516 33 39 134 174 104 43 68 1425 21 1
Conv Finishing CHL CIP ERY NAL TET 4517 33 39 134 174 104 43 68 1425 21 1
Conv Finishing ERY TET 841 33 39 44 82 189 35 36 1429 10 2
Conv Finishing TET 4396 32 153 30 82 104 44 36 1430 16 2
Conv Finishing TET 448 32 38 44 82 104 43 17 1434 23 2
Conv Finishing ERY TET 4490 33 153 30 82 104 44 17 1438 15 9
Conv Finishing ERY NAL TET 458 33 38 30 82 104 173 17 1439 9 11
Conv Finishing ERY NAL TET 459 33 38 30 82 104 173 17 1439 9 11
Conv Finishing ERY TET 623 33 38 132 82 104 85 17 1442 19 3
Conv Finishing TET 653 33 153 30 173 217 44 68 1466 14 11
Conv Finishing ERY 3451 33 39 30 82 113 47 17 825 2 9
Conv Preevisceration ERY TET 3480 33 38 30 82 104 35 36 890 18 3
Conv Preevisceration ERY 690 33 38 44 82 104 117 36 1421 20 2
Conv Preevisceration ERY 694 33 39 134 161 118 43 17 1435 24 3
Conv Preevisceration ERY 699 32 38 44 82 113 43 36 1443 23 2
Conv Preevisceration ERY TET 4324 32 38 30 167 104 35 17 1453 7 3
Conv Postevisceration TET 3491 33 38 30 82 104 43 17 854 4 11
Conv Postevisceration TET 4559 33 38 30 82 104 85 68 887 18 6
Conv Postevisceration ERY TET 3507 53 38 30 81 104 44 36 1097 1 3
Conv Postevisceration ERY TET 4276 53 38 44 82 118 35 36 1123 13 8
Conv Postevisceration ERY TET 892 33 38 134 161 104 43 17 1125 24 3
Conv Postevisceration TET 3490 33 38 30 82 104 43 68 1130 18 11
Conv Postevisceration TET 4549 33 153 30 82 104 43 36 1142 22 6
Conv Postevisceration ERY TET 4338 58 38 30 167 118 35 17 1454 7 3
Conv Postevisceration TET 4560 33 38 37 82 104 85 68 1455 17 6
Conv Postchill ERY TET 4445 53 38 30 81 118 43 36 1428 1 2
aConventional farms.
bCHL, chloramphenicol; CIP, ciprofloxacin; ERY, erythromycin; GEN, gentamicin; NAL, nalidixic acid; TET, tetracycline.
cSequence type indicates the unique number assigned on the basis of the allelic profile generated based on the allele nucleotide sequence number in the MLST database (www.pubmlst.org/campylobacter).
on May 15, 2020 by guest
http://jcm.asm.org/
[image:5.585.43.543.83.414.2]on May 15, 2020 by guest
http://jcm.asm.org/
FIG.
1.
PFGE
dendrogram
for
the
100
C.
coli
isolates
showing
the
11
clusters
at
70%
genetic
similarity
among
the
band
profiles.
on May 15, 2020 by guest
http://jcm.asm.org/
tant species of Campylobacter besides C. jejuni that causes food-borne gastroenteritis (6, 8, 44). Another technique used routinely for typing bothC. jejuniandC. coliis PFGE (3, 4, 13, 22, 41, 42). This method is being used by PulseNet within the United States for the nationwide surveillance of this pathogen along with other food-borne pathogens like Salmonella and Shigella(43). It has been used both for typing this pathogen and for discriminating between C. jejuni isolates responsible for 12 outbreaks in the United States (42). These two methods have not been used together to investigate the genetic diversity ofC. colistrains isolated from swine. The utility of both the methods as tools for understanding the epidemiology of this pathogen in the swine production environment is important. Therefore, in this study, we used these two methods for geno-typing 100 phenotypically diverseC. coliisolated from swine reared under conventional and antimicrobial-free production systems and compared their discriminatory powers, through-puts, and group associations.
MLST and PFGE differentiated the isolates into 26 and 11 clusters, respectively, exhibiting high levels of discrimination depending on the farm type and the antimicrobial resistance pattern. Our results were consistent with other studies where both these methods have been shown to differentiate between closely related strains ofCampylobacter(24, 41, 42). The dis-tribution of specific STs among the isolates at different stages of production and with particular resistance patterns indicated that certain STs were adapted to a specific stage of production. Specific STs were found either at the farm or at the slaughter stage (Tables 1 and 2). For example, ST-1413 was seen in C. coliisolates with a CIP ERY NAL TET resistance pattern and only in isolates from pigs at a nursery farm in the conven-tional production system. Similar results have been reported by
other studies where specific clones ofC. jejunihave been found associated with particular niches (5). A study in the United Kingdom reported a C. coli strain that may have become adapted to persist in water and act as a source of infection to humans (24).
The results observed in our study of specific STs being as-sociated with a specific production or processing stage such as slaughter may imply that not all strains detected at slaughter originated from the farm, and other factors such as cross-contamination during trucking and in holding pens remain a concern. The genotyping results provided evidence of multiple Campylobacter genotypes grouped together in different clus-ters. We observed clusters with isolates that were not related either temporally or spatially, indicating significant genotypic diversity. Hume et al., reported the absence of shared genotype from isolates that were isolated from the sow, its respective piglets and the littermates highlighting the diverse genome of this pathogen (21). Similar observations were made when we analyzed the clusters with respect to the resistance patterns. Barring a few STs that were restricted to specific resistance patterns (ST-1413 was associated with isolates with a CIP ERY NAL TET resistance pattern), most of the STs were found to be associated with multiple resistance patterns.C. jejuni iso-lates with similar PFGE patterns but with different resistance patterns have been reported before (3).
[image:8.585.48.541.79.323.2]We found MLST to have a better discriminatory power and test throughput than PFGE. Previous studies have reported the better discriminatory power of PFGE compared to MLST when used for typingC. jejuni(41, 42). However, MLST has been found to be as discriminatory as PFGE for distinguishing between temporally related isolates and the epidemic-causing isolates in different outbreaks caused by C. jejuni (42). The TABLE 3. Antimicrobial resistance and molecular characterization ofC. coliisolates isolated from swine in this study
Isolate ID
Production system
Processing stage
MIC (g/ml)
Resistance patternb
Mutationc
CHL (32)a
CIP (4)
ERY (8)
GEN (16)
NAL (32)
TET (16)
Thr 86 Ile
23S rRNA gene
49 ABF Nursery 4 0.25 8 2 32 ⬎32 ERY NAL TET ⫺ ⫺
260 ABF Nursery 8 8 4 8 ⬎128 ⬎32 CIP NAL TET ⫺ ⫺
952 ABF Finishing 16 2 ⬎32 2 ⬎128 ⬎32 ERY NAL TET ⫺ ⫺
966 ABF Finishing 8 2 16 2 ⬎128 ⬎32 ERY NAL TET ⫺ ⫹
1005 ABF Finishing 4 1 ⬎32 1 ⬎128 ⬎32 ERY NAL TET ⫺ ⫹
4075 ABF Finishing 8 8 4 8 ⬎128 ⬎32 CIP NAL TET ⫺ ⫺
4076 ABF Finishing 8 8 4 8 ⬎128 ⬎32 CIP NAL TET ⫺ ⫺
3804 ABF Finishing 8 4 ⬎32 2 64 ⬎32 CIP ERY NAL TET ⫺ ⫺
461 Conventional Nursery 4 4 ⬎32 16 ⬎128 ⬎32 CIP ERY GEN NAL TET ⫺ ⫹
475 Conventional Nursery 8 ⬎4 ⬎32 2 128 ⬎32 CIP ERY NAL TET ⫹ ⫹
524 Conventional Nursery 8 ⬎4 ⬎32 8 ⬎128 ⬎32 CIP ERY NAL TET ⫹ ⫹
525 Conventional Nursery 8 64 ⬎32 1 128 ⬎32 CIP ERY NAL TET ⫹ ⫹
526 Conventional Nursery 8 64 ⬎32 1 128 ⬎32 CIP ERY NAL TET ⫹ ⫹
548 Conventional Nursery 2 ⬎64 ⬎32 1 128 ⬎32 CIP ERY NAL TET ⫹ ⫹
549 Conventional Nursery 2 ⬎64 ⬎32 2 128 ⬎32 CIP ERY NAL TET ⫹ ⫹
552 Conventional Nursery 4 ⬎64 ⬎32 2 128 ⬎32 CIP ERY NAL TET ⫹ ⫹
554 Conventional Nursery 4 ⬎64 ⬎32 2 128 ⬎32 CIP ERY NAL TET ⫹ ⫹
555 Conventional Nursery 4 ⬎64 ⬎32 2 128 ⬎32 CIP ERY NAL TET ⫹ ⫹
459 Conventional Finishing 8 0.5 ⬎32 1 32 ⬎32 ERY NAL TET ⫺ ⫹
4516 Conventional Finishing 32 4 ⬎32 1 128 ⬎32 CHL CIP ERY NAL TET ⫺ ⫹
4517 Conventional Finishing 32 4 ⬎32 1 128 ⬎32 CHL CIP ERY NAL TET ⫺ ⫹
a
Breakpoint level based onC. jejuniATCC 33560 ing/ml antimicrobial concentration. b
CHL, chloramphenicol; CIP, ciprofloxacin; ERY, erythromycin; GEN, gentamicin; NAL, nalidixic acid; TET, tetracycline. c
Point mutations ingyrAand the 23S rRNA genes coding for ciprofloxacin and erythromycin resistance, respectively. All isolates were positive for thetet(O) gene.
on May 15, 2020 by guest
http://jcm.asm.org/
ability of MLST to have the same value for epidemiological typing as that of PFGE, AFLP, and ribotyping has also been demonstrated before (10). In the current study, PFGE resulted in good discrimination, but it did not discriminate as well as MLST. These findings imply that both genotyping methods are very good, and the use of both methods would ideally be a preferred way for tracking clones. It should also be emphasized that the outcome of PFGE typing is susceptible to changes in the chromosome and inter- and intragenomic recombinations, making this method unsuitable for studying the epidemiology of pathogens with hyperplastic genome including Campy-lobacter(18, 34, 47, 48).
Analysis of clusters generated by the two methods revealed the high level of genotypic diversity present in C. coli. We detected clustering of isolates based on the processing stage or sample type rather than the production system. However, in a study conducted in a dairy cattle environment, no clustering of C. coliisolates based on sample type was observed (24). This difference could be attributed to the different environments for dairy cattle and pigs. Seventeen clonal complexes have been defined so far for C. jejuni, and association of these clonal complexes with the given host has been shown by MLST and PFGE (5, 7). There are only two clonal complexes that have been defined forC. coli so far (29). Our lab is currently in-volved in defining the clonal complex for this species of Campy-lobacterin swine. This will help us in understanding its epide-miology in different hosts and environments.
The main mechanism of resistance against ciprofloxacin was the threonine-to-isoleucine point mutation at amino acid po-sition 86 as confirmed by both MAMA PCR and sequencing of the QRDR. Mutation at amino acid position 86 has been shown to confer high resistance to this antimicrobial at con-centrations ranging from 32g/liter up to 128g/liter (17, 36). A single isolate carried another mutation at position 147 in addition to the mutation at position 86. We do not know at this stage whether the additional mutation has potentiated the abil-ity of this isolate to become resistant to even higher concen-tration of ciprofloxacin than isolates that carry a mutation only at position 86. Other mutations in the QRDR that have been linked to ciprofloxacin resistance in Campylobacter include Asp-90, Ala-70, and Pro-104 mutations (11, 36). Recently, high resistance to moxifloxacin, a fluoroquinolone, was shown in Campylobacter isolates that had a double mutation in the QRDR of thegyrAgene.
Resistance against tetracycline was mediated through the tet(O) gene in 100% of the isolates that showed the tetracycline resistance phenotype and tested with PCR. Thetet(O) gene, which can be both plasmid and chromosomally located, has been shown to confer high resistance against tetracycline rang-ing from ⬎256 to 512 g/liter concentrations in C. coliand C. jejuni, respectively (16, 37). All of the 21 isolates tested were highly resistant to tetracycline (MIC⬎32g/liter). The ability of this gene to be transferred both intraspecies and interspecies inCampylobacterthrough conjugation could explain the high frequency of resistance seen against this antimicrobial in iso-lates in this study.C. coliisolates with an A2075G point mu-tation in their 23S rRNA gene were responsible for resistance against the macrolide erythromycin. In C. coli, resistance against erythromycin has been shown before to be mediated through the A2075G point mutation (16, 35). Although the
highest concentration of erythromycin tested in our study was 32g/liter,C. coliisolates with the above point mutation have been shown to exhibit resistance to as high as⬎1,024g/liter of the antimicrobial (16). The simultaneous resistance to im-portant classes of antimicrobials, including fluoroquinolones and macrolides, shown by the 21 characterizedC. coliisolates is very concerning.
The overallC. colipopulation had a weaker clonal structure (IA⫽0.293) compared to theIAvalue of 0.57 forC. jejuni(7). Our findings show that theC. coli population has low clonal structure, and widespread genotypic diversity was seen. In C. jejuni, 17 clonal complexes have been defined so far, and association of these clonal complexes with the given host has been shown by MLST and PFGE (5, 7). Our lab is currently involved in defining a clonal complex for this species of Campy-lobacter. We found the C. coli population isolated from the conventional production system to be slightly more clonal than that of the ABF system. This could be attributed to the pres-ence of a different lineage of this species circulating in these production systems. Our results differ from other studies that have reportedC. colito be less diverse thanC. jejuniby using MLST and AFLP (8, 9). However, it should also be noted that the isolates in the current study are not representative of the C. colipopulation existing in these systems, and we are cau-tious that no generalization is deduced from the study. We emphasize that MLST has the potential to be used for studying the molecular epidemiology ofCampylobacterdue to its high discriminatory power, the simplicity of data handling and anal-ysis, reproducibility of sequence data, high test throughput, and the ease with which data can be exchanged between dif-ferent laboratories via the internet. This study highlights the high genotypic diversity of antimicrobial-resistantC. coliin the swine production systems.
ACKNOWLEDGMENT
The work was supported by a research grant funded by the U.S. Department of Agriculture to W.A.G. (2002-51110-01508).
REFERENCES
1.Anonymous. 2001. Trends in selected gastrointestinal infections—2001. Commun. Dis. Rep. Wkly.11:1–2.
2.Centers for Disease Control and Prevention.2005. Preliminary FoodNet data on the incidence of infection with pathogens transmitted commonly through food—10 sites, United States, 2004. Morb. Mortal. Wkly. Rep.
54:352–356.
3.Chu, Y. W., M. Y. Chu, K. Y. Luey, Y. W. Ngan, K. L. Tsang, and K. M. Kam.
2004. Genetic relatedness and quinolone resistance ofCampylobacter jejuni
strains isolated in 2002 in Hong Kong. J. Clin. Microbiol.42:3321–3323. 4.Cloak, O. M., and P. M. Fratamico.2002. A multiplex polymerase chain
reaction for the differentiation ofCampylobacter jejuniandCampylobacter colifrom a swine processing facility and characterization of isolates by pulsed-field gel electrophoresis and antibiotic resistance profiles. J. Food Prot.65:266–273.
5.Colles, F. M., K. Jones, R. M. Harding, and M. C. Maiden.2003. Genetic diversity ofCampylobacter jejuniisolates from farm animals and the farm environment. Appl. Environ. Microbiol.69:7409–7413.
6.Communicable Disease Surveillance Centre.2000. Sentinel surveillance of
Campylobacterin England and Wales. Commun. Dis. Rep. Wkly.10:172. 7.Dingle, K. E., F. M. Colles, D. R. Wareing, R. Ure, A. J. Fox, F. E. Bolton,
H. J. Bootsma, R. J. Willems, R. Urwin, and M. C. Maiden.2001. Multilocus sequence typing forCampylobacter jejuni.J. Clin. Microbiol.39:14–23. 8.Dingle, K. E., F. M. Colles, D. Falush, and M. C. Maiden.2005. Sequence
typing and comparison of population biology of Campylobacter coliand
Campylobacter jejuni.J. Clin. Microbiol.43:340–347.
9.Duim, B., T. M. Wassenaar, A. Rigter, and J. Wagenaar.1999. High-reso-lution genotyping ofCampylobacterstrains isolated from poultry and humans with amplified fragment length polymorphism fingerprinting. Appl. Environ. Microbiol.65:2369–2375.
on May 15, 2020 by guest
http://jcm.asm.org/
10.Duim, B., P. C. Godschalk, N. van den Braak, K. E. Dingle, J. R. Dijkstra, E. Leyde, J. van der Plas, F. M. Colles, H. P. Endtz, J. A. Wagenaar, M. C. Maiden, and A. van Belkum.2003. Molecular evidence for dissemination of uniqueCampylobacter jejuniclones in Curac¸ao, Netherlands Antilles. J. Clin. Microbiol.41:5593–5597.
11.Engberg, J., F. M. Aarestrup, D. E. Taylor, P. Gerner-Smidt, and I. Nachamkin.2001. Quinolone and macrolide resistance in Campylobacter jejuni andC. coli: resistance mechanisms and trends in human isolates. Emerg. Infect. Dis.7:24–34.
12.FDA/USDA/CDC.1999. National antimicrobial resistance monitoring sys-tem: enteric bacteria (NARMS) 1998 annual report. Centers for Disease Control and Prevention, Atlanta, Ga.
13.Fitzgerald, C., K. Stanley, S. Andrew, and K. Jones.2001. Use of pulsed-field gel electrophoresis and flagellin gene typing in identifying clonal groups of
Campylobacter jejuniandCampylobacter coliin farm and clinical environ-ments. Appl. Environ. Microbiol.67:1429–1436.
14.Ge, B., S. Bodeis, R. D. Walker, D. G. White, S. Zhao, P. F. McDermott, and J. Meng.2002. Comparison of the Etest and agar dilution for in vitro antimicrobial susceptibility testing ofCampylobacter.J. Antimicrob. Che-mother.50:487–494.
15.Gibreel, A., D. M. Tracz, L. Nonaka, T. M. Ngo, S. R. Connell, and D. E. Taylor.2004. Incidence of antibiotic resistance inCampylobacter jejuni iso-lated in Alberta, Canada, from 1999 to 2002, with special reference to
tet(O)-mediated tetracycline resistance. Antimicrob. Agents Chemother.48:
3442–3450.
16.Gibreel, A., V. N. Kos, M. Keelan, C. A. Trieber, S. Levesque, S. Michaud, and D. E. Taylor.2005. Macrolide resistance inCampylobacter jejuniand
Campylobacter coli: molecular mechanism and stability of the resistance phenotype. Antimicrob. Agents Chemother.49:2753–2759.
17.Griggs, D. J., M. M. Johnson, J. A. Frost, T. Humphrey, F. Jorgensen, and L. J. Piddock.2005. Incidence and mechanism of ciprofloxacin resistance in
Campylobacterspp. isolated from commercial poultry flocks in the United Kingdom before, during, and after fluoroquinolone treatment. Antimicrob. Agents Chemother.49:699–707.
18.Hanninen, M. L., M. Hakkinen, and H. Rautelin.1999. Stability of related human and chickenCampylobacter jejunigenotypes after passage through chick intestine studied by pulsed-field gel electrophoresis. Appl. Environ. Microbiol.65:2272–2275.
19.Harvey, R. B., C. R. Young, R. L. Ziprin, M. E. Hume, K. J. Genovese, R. C. Anderson, R. E. Droleskey, L. H. Stanker, and D. J. Nisbet.1999. Prevalence ofCampylobacterspecies isolated from the intestinal tract of pigs raised in an integrated swine production system. J. Am. Vet. Med. Assoc.215:1601–1604. 20.Heuer, O. E., K. Pedersen, J. S. Andersen, and M. Madsen.2001. Prevalence and antimicrobial susceptibility of thermophilicCampylobacterin organic and conventional broiler flocks. Lett. Appl. Microbiol.33:269–274. 21.Hume, M. E., R. E. Droleskey, C. L. Sheffield, and R. B. Harvey.2002.
Campylobacter colipulsed field gel electrophoresis genotypic diversity among sows and piglets in a farrowing barn. Curr. Microbiol.45:128–132. 22.Hunter, P. R., and M. A. Gaston.1988. Numerical index of the
discrimina-tory ability of typing systems: an application of Simpson’s index of diversity. J. Clin. Microbiol.26:2465–2466.
23.Jolley, K. A., E. J. Feil, M. S. Chan, and M. C. Maiden.2001. Sequence type analysis and recombinational tests (START). Bioinformatics17:1230–1231. 24.Leatherbarrow, A. J., C. A. Hart, R. Kemp, N. J. Williams, A. Ridley, M. Sharma, P. J. Diggle, E. J. Wright, J. Sutherst, and N. P. French.2004. Genotypic and antibiotic susceptibility characteristics of aCampylobacter coli
population isolated from dairy farmland in the United Kingdom. Appl. Environ. Microbiol.70:822–830.
25.Manning, G., C. G. Dowson, M. C. Bagnall, I. H. Ahmad, M. West, and D. G. Newell.2003. Multilocus sequence typing for comparison of veterinary and human isolates ofCampylobacter jejuni.Appl. Environ. Microbiol.69:6370– 6379.
26.Maynard-Smith, J. M., N. H. Smith, M. O’Rourke, and B. G. Spratt.1993. How clonal are bacteria? Proc. Natl. Acad. Sci. USA90:4384–4388. 27.Mead, P. S., L. Slutsker, V. Dietz, L. F. McCaig, J. S. Bresee, C. Shapiro,
P. M. Griffin, and R. V. Tauxe.1999. Food-related illness and death in the United States. Emerg. Infect. Dis.5:607–625.
28.Michaud, S., S. Menard, and R. D. Arbeit.2005. Role of real-time molecular typing in the surveillance ofCampylobacter enteritis and comparison of pulsed-field gel electrophoresis profiles from chicken and human isolates. J. Clin. Microbiol.43:1105–1111.
29.Miller, W. G., S. L. On, G. Wang, S. Fontanoz, A. J. Lastovica, and R. E. Mandrell.2005. Extended multilocus sequence typing system for
Campy-lobacter coli,C. lari,C. upsaliensis, andC. helveticus.J. Clin. Microbiol.
43:2315–2329.
30.Morgan, D., C. Gunneberg, D. Gunnell, T. D. Healing, S. Lamerton, N. Soltanpoor, D. A. Lewis, and D. G. White.1994. An outbreak of Campy-lobacterinfection associated with the consumption of unpasteurized milk at a large festival in England. Eur. J. Epidemiol.10:581–585.
31.National Committee for Clinical Laboratory Standards.1999. Performance standards for antimicrobial disk and dilution susceptibility tests for bacteria isolated from animals: approved standard M31-A. National Committee for Clinical Laboratory Standards, Wayne, Pa.
32.Newell, D. G., J. A. Frost, B. Duim, J. Wagenaar, R. H. Madden, J. van der Plas, and S. L. W. On.2000. New developments in the subtyping of Campy-lobacterspecies, p. 27–44.InI. Nachamkin and M. J. Blaser (ed.), Campy-lobacter, 2nd ed. American Society for Microbiology, Washington, D.C. 33.O’Halloran, F., B. Lucey, B. Cryan, T. Buckley, and S. Fanning.2004.
Molecular characterization of class 1 integrons from Irish thermophilic
Campylobacterspecies. J. Antimicrob. Chemother.53:952–957.
34.On, S. L. W.1998. In vitro genotypic variation ofCampylobacter coli docu-mented by pulsed-field gel electrophoretic DNA profiling: implications for epidemiological studies. FEMS Microbiol. Lett.165:341–346.
35.Payot, S., L. Avrain, C. Magras, K. Praud, A. Cloeckaert, and E. Chaslus-Dancla.2004. Relative contribution of target gene mutation and efflux to fluoroquinolone and erythromycin resistance, in French poultry and pig isolates ofCampylobacter coli.Int. J. Antimicrob. Agents23:468–472. 36.Piddock, L. J., V. Ricci, L. Pumbwe, M. J. Everett, and D. J. Griggs.2003.
Fluoroquinolone resistance inCampylobacterspecies from man and animals: detection of mutations in topoisomerase genes. J. Antimicrob. Chemother.
51:19–26.
37.Pratt. A., and V. Korolik.2005. Tetracycline resistance of Australian Campy-lobacter jejuniandCampylobacter coliisolates. J. Antimicrob. Chemother.
55:452–460.
38.Ribot, E. M., C. Fitzgerald, K. Kubota, B. Swaminathan, and T. J. Barrett.
2001. Rapid pulsed-field gel electrophoresis protocol for subtyping of
Campylobacter jejuni.J. Clin. Microbiol.39:1889–1894.
39.Sacks, J. J., S. Lieb, L. M. Baldy, S. Berta, C. M. Patton, M. C. White, W. J. Bigler, and J. J. Witte.1986. Epidemic campylobacteriosis associated with a community water supply. Am. J. Public Health76:424–428.
40.Saenz, Y., M. Zarazaga, M. Lantero, M. J. Gastanares, F. Baquero, and C. Torres.2000. Antibiotic resistance inCampylobacterstrains isolated from animals, foods, and humans in Spain in 1997-1998. Antimicrob. Agents Chemother.44:267–271.
41.Sails, A. D., B. Swaminathan, and P. I. Fields.2003. Clonal complexes of
Campylobacter jejuniidentified by multilocus sequence typing correlate with strain associations identified by multilocus enzyme electrophoresis. J. Clin. Microbiol.41:4058–4067.
42.Sails, A. D., B. Swaminathan, and P. I. Fields.2003. Utility of multilocus sequence typing as an epidemiological tool for investigation of outbreaks of gastroenteritis caused byCampylobacter jejuni.J. Clin. Microbiol.41:4733– 4739.
43.Swaminathan, B., T. J. Barrett, S. B. Hunter, R. V. Tauxe, and the CDC PulseNet Task Force.2001. PulseNet: the molecular subtyping network for foodborne bacterial disease surveillance, United States. Emerg. Infect. Dis.
7:382–389.
44.Tam, C. C., S. J. O’Brien, G. K. Adak, S. M. Meakins, and J. A. Frost.2003.
Campylobacter coli—an important foodborne pathogen. J. Infect.47:28–32. 45.Tenover, F. C., R. D. Arbeit, R. V. Goering, P. A. Mickelsen, B. E. Murray, D. H. Persing, and B. Swaminathan.1995. Interpreting chromosomal DNA restriction patterns produced by pulsed-field gel electrophoresis: criteria for bacterial strain typing. J. Clin. Microbiol.33:2233–2239.
46.Thakur, S., and W. A. Gebreyes.Prevalence and antimicrobial resistance of
Campylobacterin antimicrobial-free and conventional pig production sys-tems. J. Food Prot., in press.
47.Wassenaar, T. M., B. Geilhausen, and D. G. Newell.1998. Evidence of genomic instability inCampylobacter jejuniisolated from poultry. Appl. En-viron. Microbiol.64:1816–1821.
48.Weijtens, M. J., R. D. Reinders, H. A. Urlings, and J. Van der Plas.1999.
Campylobacterinfections in fattening pigs; excretion pattern and genetic diversity. J. Appl. Microbiol.86:63–70.
49.Zirnstein, G., L. Helsel, Y. Li, B. Swaminathan, and J. Besser.2000. Char-acterization ofgyrAmutations associated with fluoroquinolone resistance in
Campylobacter coliby DNA sequence analysis and MAMA PCR. FEMS Microbiol. Lett.190:1–7.