Noise and determinism in cardiovascular
dynamics
Peter V.E. McClintock
aand Aneta Stefanovska
b,aa
Department of Physics, Lancaster University, Lancaster, LA1 4YB, UK.
b
Nonlinear Dynamics and Synergetics, Faculty of Electrical Engineering, University of Ljubljana, Trzaska 25, 1000 Ljubljana, Slovenia.
Abstract
Signals derived from the human cardiovascular system are well known to exhibit highly complex, nearly periodic, oscillatory behaviour whose nature is something of an enigma. It has, for example, been variously described as chaotic, fractal, stochas-tic, and subject to 1/f fluctuations – and its true nature is still the subject of vigorous debate. We review and describe some recent experiments that illuminate the prob-lem and discuss a combination of noise and almost periodic frequency modulation as a signature of the system dynamics.
Key words: Cardiovascular system; Nonlinear oscillators; Synchronization;
Couplings; Frequency modulation; Stochastic processes
PACS:87.22As; 87.45.Hw; 05.40+j
1 Introduction
Physiological signals derived from humans are extraordinarily complex – faith-fully reflecting their origin in what is arguably the most complicated mecha-nism ever to have existed. Because they must reflect ongoing processes that normally occur unseen, within the interior of the body, such signals repay close attention. In particular, they can be used to diagnose incipient pathophysi-ological conditions before symptoms become obvious. A well-known example is the electrocardiogramme (ECG) signal, representing the electrical activity of the heart. ECG measurements have been used for diagnostic purposes for almost a century. For the first several decades of such measurements, atten-tion was focussed mainly on the detailed shape of the approximately periodic pulses seen in the signal. More recently, however, attention has shifted to the
separation of the pulses because it has become apparent that the heart of a
healthy human in repose does not beat at a constant rate. Rather, the car-diac frequency varies in time, a phenomenon known as heart-rate variability (HRV).
Gene Stanley and his group have probably done more than anyone to try to characterise and analyse cardiovascular signals, so it is a particular pleasure to have been invited to present a paper on this topic in Messina. Approaches to the problem introduced by different authors have included, for example, studies of: Fourier spectra [1]; chaotic behaviour[2,3]; wavelet spectra [4–6]; Karhunen-Lo`eve decomposition [7]; scaling properties [8–13]; Lyapunov expo-nents [14]; multifractal properties [15,16]; correlation integrals [17]; 1/f spectra [18–20]; and synchronization properties [21–25]. The two extreme perceptions of HRV consider it to be deterministic in origin, e.g. sometimes resulting in de-terministic chaos [2,3], or stochastic [26]. It is not immediately obvious which of these several diverse approaches is the most promising: the criteria to be met, presumably, are that the technique of analysis should (i) be able to deal successfully with time variations of characteristic frequencies and amplitudes, and that (ii) it should yield some insight into the physiological processes re-sponsible for the HRV, so that (iii) their individual function – normal or pathological – can be evaluated separately for diagnostic purposes.
In this paper we focus on the results obtained through use of one of the techniques mentioned above, wavelet analysis [4,27], and we point out that it apparently meets all three criteria. In Sec. 2 we summarise the experimental information obtained by this method and, in Sec. 3 we show how it can be accounted for in terms of mutually interacting oscillatory processes each of which appears to relate to a distinct physiological mechanism. In Sec. 4 we report the present status of attempts to model the cadiovascular system as a set of coupled oscillators, showing that important features of the measured signals can be reproduced by the model. In Sec. 5 we draw conclusions and try to point the way forward.
2 Cardiovascular signals
Respiration (a)
ECG
HRV
Blood pressure
Amplitude
Blood flow 1
0 5 10 15 20 25
Blood flow 2
Time (s)
(b)
0.18 Hz
1.1 Hz
0.18 Hz
0.36 Hz 0.18 Hz 0.09 Hz 0.026 Hz 0.011 Hz
1.1 Hz
Average wavelet transform 1.1 Hz
0.11 Hz 0.03 Hz
0.014 Hz
0.01 0.03 0.1 0.3 1
1.1 Hz 0.18 Hz
0.091 Hz 0.032 Hz 0.012 Hz
[image:3.595.118.465.86.269.2]Frequency (Hz)
Fig. 1. Samples of cardiovascular signals (a) and time averages of their wavelet transforms (b). The positions of the peaks are almost the same for all signals, while the corresponding amplitudes may be considerably different. After [27].
that –
• There are (at least) fivecharacteristic spectral peaks.
• Remarkably, thesame, or almost the same, peaks appear in all the spectra,
regardless of where or how the corresponding signals were recorded, though there are considerable differences in amplitude.
• All the peaks are broadened.
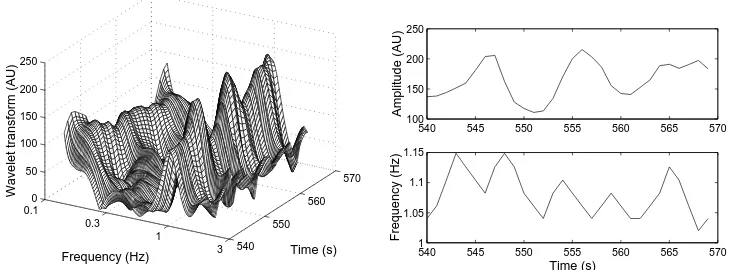
A clue to the origin of some of the broadening can be found by inspection of the full time-frequency wavelet spectrum, part of which is shown in Fig. 2. It can be seen that both the instantaneous amplitudes and central frequencies vary in time, giving rise to a considerable part of the broadening observed in the averaged spectra of Fig. 1(b).
540 550
560 570
3 1 0.3 0.1
0 50 100 150 200 250
Time (s) Frequency (Hz)
Wavelet transform (AU)
540 545 550 555 560 565 570 100
150 200 250
Amplitude (AU)
540 545 550 555 560 565 570 1
1.05 1.1 1.15
Frequency (Hz)
[image:4.595.102.468.86.221.2]Time (s)
Fig. 2. A segment of the wavelet transform of the blood flow signal in the time-fre-quency plane (left). Peaks at the heart (∼1.1 Hz) and respiration rates (∼0.18 Hz)
are visible. On the right are plotted the amplitude and frequency variations of the heartrate peak. After [5].
3 Interacting oscillatory processes
With varying degrees of confidence, all of the oscillatory processes can now be related to underlying physiological mechanisms. Their characteristic average frequencies vary slightly between individuals, and, in some cases, between dif-ferent measurement locations, but in each case they lie within definite limits. The physiological origins of the peaks at 1 Hz (heart beat), and 0.2 Hz (respi-ration) are obvious. It is reasonably well established that the peak at 0.1 Hz is attributable to intrinsic myogenic activity of smooth muscles [28–30]. The 0.03 Hz peak is apparently connected to autonomous nervous control [31,32] (neurogenic), and there is strong evidence that the 0.01 Hz peak arises from metabolically related endothelial activity [33,34].
Thus wavelet analysis of signals from the cardiovascular system provides a noninvasive technique for acquiring information about these distinct physio-logical processes. Additional information, yielding deeper insight into the dy-namics, can also be inferred from the couplings between the processes. These can manifest themselves either through mutual modulation (Fig. 2) or through synchronization between two or more of the processes. Which of these phe-nomena occurs in any given case probably depends partly on the strength of the coupling and partly on how close in frequency low harmonics of the processes would be to each other in the absence of coupling. In practice, mea-surements on healthy subjects show transient episodes of cardio-respiratory synchronization lasting typically a few tens of seconds. The average length of these episodes depends on the physiological state, and differs between e.g. athletes, sedentary individuals, and patients with pathological conditions such as diabetes.
information they carry about the couplings. But, with the exception of the cardio-respiratory coupling, they have not yet been closely studied. A major difficulty is that, unlike the heart and respiration, the lower-frequency pro-cesses do not give rise to separate signals that can be acquired noninvasively. In practice, therefore, it is necessary to infer the existence or absence of syn-chronization from univariate time series. This challenging problem is already being approached in three distinct ways: (i) filtration of the univariate data to create two “separate” signals that can then be tested for mutual synchro-nization [23] using established techniques such as synchrogrammes [21] or syn-chronization indices [35]; (ii) the use of angles-of-return-time maps [25,36]; and (iii) bispectral analysis [37]. In each case, it has been possible to derive infor-mation about the presence or absence of synchronization between the 0.1 Hz (myogenic) process and respiration or heartbeat. Problems of resolution – in time, frequency and phase – have so far made it impossible to obtain synchro-nization information for the 0.03 Hz (neurogenic) and 0.01 Hz (endothelial) processes.
Note that the three lower frequencies are derived in each case from spatially distributed processes. Within each of them, there must be significant global synchronization because, if this were not the case, low frequency oscillations would be undetectable in centrally measured quantities such as HRV (Fig. 1(b)) because they would all have averaged out.
To make further progress, it is necessary to develop a model to which the cardiovascular data can be fitted. One may then hope to characterise different physiological and pathophysiological conditions quantitatively in terms of the model parameters.
4 A coupled oscillator model of the cardiovascular system
Given the clear evidence of (a) well-defined spectral peaks (implying the pres-ence of oscillatory processes) and (b) amplitude and frequency modulation, and synchronization effects (all indicating the existence of inter-oscillator in-teractions), it is natural to try to model the system with a set of oscillators [38] whose couplings [39] can be adjusted to try to reproduce the observed phenomena.
Little experimental information exists yet about either the nature of the cou-plings or the details of the oscillators. So we have used [38] the Poincar´e oscillator
˙
xi =−xiqi−ωiyi+gxi(x),
˙
yi =−yiqi+ωixi+gyi(y), qi =αi(
q
x2i +y
2
i −ai),
where, x, y are vectors of the oscillator state variables, αi, ai, and ωi are
constants and gyi(y) andgxi(x) are linear coupling vectors. Although to some
extent this choice is arbitrary, (1) possesses properties of structural stability, robustness and symmetry consistent with physiological understanding and the analyses of measured time series.
Using a numerical simulation [39] of five coupled oscillators (1), with character-istic frequencies chosen to accord with measured data (Fig. 1), and amplitudes set initially to unity, we find that we can generate signals that to the eye seem in many respects to resemble those from the cardiovascular system. We were especially interested to establish whether frequency and amplitude modula-tion would occur with short episodes of synchronizamodula-tion at random intervals, as observed in the experiments. The investigations are still at an early stage, but we have already established: (a) that the observed depth of modulation requires parametric couplings (as expected); (b) that with appropriately cho-sen parameter values parametric modulation indeed gives rise to episodes of synchronization, but of course in a totally deterministic fashion with equal in-tervals between the episodes; and (c) with purely linear couplings, and added noise (random fluctuations), the synchronization episodes occur briefly and randomly just as observed in reality. An example showing the modelling of cardiorespiratory synchronization is shown in Fig. 3. It appears, therefore, that both linear and parametric couplings exist and that it is essential to take into account the influence of stochastic effects resulting from the (unmodelled) rest of the system.
5 Conclusions
0 50 100 150 200 −1
0 1
x
1
time, s (a)
0 50 100 150 200
−2 0 2
x
2
time, s (b)
0 0.2 0.4 0.6 0.8 1 1.2 1.4
10−5 100 S(f)
f, Hz
(d)
0 50 100 150 200
0 2 4 6
phase mod 2
π
[image:7.595.147.431.73.301.2]time, s (c)
Fig. 3. Results of modelling with linear couplings, in the presence of fluctuations. (a) and (b) The time series showing the rhythmic activities of the cardiac and respi-ratory flow components. (c) The corresponding cardio-respirespi-ratory synchrogram. (d) Power spectrum of oscillation in the blood flow generated by the cardiac activity. After [39].
Acknowledgements
It is a pleasure to acknowledge valuable discussions with Fajko Bajrovi´c, Sasha Balanov, Maja Braˇciˇc Lotriˇc, Peter Clarkson, Hermann Haken, Nata Jan-son, Igor Khovanov, Peter Kroˇselj, Knut-Arvid Kirkebøen, Hebe Kvernmo, Mitya Luchinsky, Janko Petrovˇciˇc, Samo Ribariˇc, Misha Rosenblum, Carstin Sch¨afer, Saˇso Strle, Duˇsan ˇStajer, Peter Tass, Vilma Urbanˇciˇc-Rovan and Aleˇs Zaloˇznik. The research has been supported by the Ministry of Education, Sci-ence and Sport (Slovenia), the Engineering and Physical SciSci-ences Research Council (UK), the Medical Research Council (UK), the Leverhulme Trust (UK), and INTAS.
References
[1] S. Akselrod, D. Gordon, F.A. Ubel, D.C. Shannon, A.C. Barger and R.J. Cohen, Science213 (1981) 220.
[2] A. Babloyantz and A. Destexhe, Biol. Cybern.58(1988) 203.
[3] C.S. Poon and C.K. Merrill, Nature389 (1997) 492.
[5] M. Braˇciˇc, P.V.E. McClintock and A. Stefanovska, Characteristic frequencies of the human blood distribution system, In: D.S. Broomhead, E.A. Luchinskaya, P.V.E. McClintock and T. Mullin (Eds.), Stochastic and Chaotic Dynamics in the Lakes, American Institute of Physics, Melville, New York, 146-153, 2000.
[6] M Braˇciˇc-Lotriˇc, A. Stefanovska, D. ˇStajer, V. Urbanˇciˇc-Rovan,Physiol. Meas.
21, 441-457, 2000.
[7] M. Hoˇziˇc and A. Stefanovska, Physica A 280(2000) 587.
[8] P.C. Ivanov, M.G. Rosenblum, C.K. Peng, J.E. Mietus, H.E. Stanley and A.L. Goldberger, Physica A 249(1998) 587.
[9] L.A.N. Amaral, A.L. Goldberger, P.C. Ivanov and H.E. Stanley, Phys. Rev. Lett.81(1998) 2388.
[10] S. Havlin, S.V. Buldyrev, A.L. Goldberger, P.C. Ivanov, C.K. Peng and H.E. Stanley, Physica A 273(1999) 46.
[11] S. Havlin, L.A.N. Amaral, Y. Ashkenazy, A.L. Goldberger, P.C. Ivanov, C.K. Peng and H.E. Stanley, Physica A274 (1999) 274.
[12] Y. Ashkenazy, P.C. Ivanov, S. Havlin, C.K. Peng, A.L. Goldberger and H.E. Stanley, Phys. Rev. Lett. 86(2001) 1900.
[13] P. Bernaola-Galv´an, P.C. Ivanov, L.A.N. Amaral and H.E. Stanley, Phys. Rev. Lett.87(2001) 168105.
[14] M. Braˇciˇc and A. Stefanovska, Bull. Math. Bol. 60(1998) 417.
[15] P.C. Ivanov, L.A.N. Amaral, A.L. Goldberger, S. Havlin, M.G. Rosenblum, Z.R. Struzik and H.E. Stanley, Nature399 (1999) 461.
[16] L.A.N. Amaral, P.C. Ivanov, N. Aoyagi, I. Hidaka, S. Tomono, A.L. Goldberger, H.E. Stanley and Y. Yamamoto, Phys. Rev. Lett. 86(2001) 6026.
[17] A. Stefanovska and P. Kroˇselj, Open Sys. and Information Dyn.4 (1997) 457.
[18] M. Kobayashi and T. Musha, IEEE Trans. Biomed. Eng.29(1982) 456.
[19] C.K. Peng, J. Mietus, J.M. Hausdorff, S. Havlin, H.E. Stanley and A.R. Goldberger, Phys. Rev. Lett. 70(1993) 1343.
[20] P.C. Ivanov, L.A.N. Amaral, A.L. Goldberger, S. Havlin, M.G. Rosenblum, H.E. Stanley and Z.R. Struzik, Chaos 11(2001) 641.
[21] C. Sch¨afer, M.G. Rosenblum and J. Kurths, Nature 392 (1998) 239.
[22] A. Stefanovska, H. Haken, P.V.E. McClintock, M. Hoˇziˇc, F. Bajrovi´c, and S. Ribariˇc, Phys. Rev. Lett. 85(2000) 4831.
[23] A. Stefanovska and M. Hoˇziˇc, Prog. of Theor. Phys. Suppl. No.139(2000) 270.
[25] N.B. Janson, A.G. Balanov, V.S. Anishchenko and P.V.E. McClintock, Phys. Rev. Lett.86(2001) 1749.
[26] P.C. Ivanov, L.A.N. Amaral, A.L. Goldberger and H.E. Stanley, Europhys. Lett.
43(1998) 363.
[27] A. Stefanovska and M. Braˇciˇc, Contemporary Phys.40(1999) 31.
[28] P.C. Johnson, News Physiol. Sci. 6 (1991) 41.
[29] S. Bertuglia, A. Colantuoni and M. Intaglietta, Microcirc. Res.48(1994) 68.
[30] H.D. Kvernmo, A. Stefanovska, M. Braˇciˇc, K.A. Kirkebøen and K. Kvernebo, Microvasc. Res.56 (1998) 173.
[31] J. Karstrup, J. B¨uhlow and N.A. Lassen, Int. J. Microcirc.: Clin. Exp.8(1989)
205.
[32] T. S¨oderstr¨om, A. Stefanovska, M. Veber and H. Svenson, Am. J. Physiol., in press.
[33] H.D. Kvernmo, A. Stefanovska, K.A. Kirkebøen and K. Kvernebo, Microvasc. Res. 57(1999) 298.
[34] A. Stefanovska, M. Braˇciˇc and H.D. Kvernmo, IEEE Trans. on Biomed. Engineering46(1999) 1230.
[35] P. Tass, M.G. Rosenblum, J. Weule, J. Kurths, A.S. Pikovsky, J. Volkmann, A. Schnitzler, and H.-J. Freund, Phys. Rev. Lett.81(1998) 3291.
[36] N.B. Janson, A.G. Balanov, V.S. Anishchenko and P.V.E. McClintock, “Phase relationships between two or more interacting processes from one-dimensional time series. I. Basic theory.”, and “Phase relationships between two or more interacting processes from one-dimensional time series. II Application to heart-rate-variability data”, Phys. Rev. E, in press.
[37] J. Jamˇsek and A. Stefanovska, “Bispectral analysis of cardiovascular oscillations”, submitted to Phys. Rev. E.
[38] A. Stefanovska, M. Braˇciˇc Lotriˇc, S. Strle and H. Haken, Physiol. Meas. 22
(2001) 535.
[39] A. Stefanovska, D.G. Luchinsky and P.V.E. McClintock, Physiol. Meas. 22