http://dx.doi.org/10.4236/jpee.2014.24018
Fuzzy Adaptive P&O Control for MPPT of a
Photovoltaic Module
Maynara A. Aredes, Bruno W. França, Maurício Aredes
Departament of Electrical Engineering,Federal Universityof Rio de Janeiro (UFRJ), Rio de Janeiro, Brazil Email: maynara@lemt.ufrj.br, bruno@lemt.ufrj.br, aredes@lemt.ufrj.br
Received December 2013
Abstract
In this work a Maximum Power Point Tracker (MPPT) for photovoltaic modules is developed using fuzzy logic. As it is well known, the output of the photovoltaic module is a non-linear curve which has a unique point of maximum power (MPP) for a given condition of radiation and temperature. When a load is connected to the module, only in very specifics cases, the operation point will coin-cide with the MPP, for any other conditions the system will not operate with maximum power. Thus MPPT circuits must guarantee that photovoltaic modules operate with its maximum power at most of the time, independently to the radiation and temperature conditions. In order to achieve this objective, in this paper the input variables of the controller are transformed into lin-guistic variables, which associate with a set of rules results the displacement of the operation point so as to transfer the maximum power from the photovoltaic module to the load.
Keywords
Fuzzy Logic; MPPT; Photovoltaic Systems; Solar Cell
1. Introduction
The photovoltaic generation of electrical energy has been widely discussed in the scientific community, in which a large number of papers have been published, increasing the knowledge about this subject.
The photovoltaic technological growth is being achieved due to the following aspects: the enhancement of the photovoltaic cell material and the rise of the renewable sources. Both aspects agree with the current ecological trends, stimulated by the limited availability of the nonrenewable resources such as petroleum, natural gas, etc.
The power electronic development has enabled the use of the photovoltaic energy, especially in the connec-tion between this source to the grid (AC systems) and to control the voltage and current to feed a specific load (DC system). In the second case, DC-DC converters are applied between the source and the load, aiming to guarantee the desired feeding aforementioned and also to achieve the maximum energy transfer to the load. In this way, many resources have been published [1-6], in order to obtain the Maximum Power Point Tracking (MPPT).
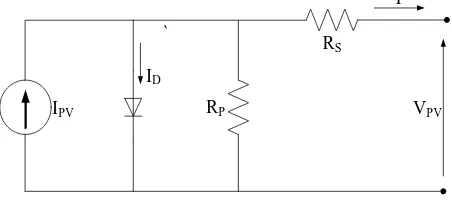
The mathematical model of a solar cell can be obtained analyzing the simplified equivalent circuit of Figure 1. In this circuit the solar panel is represented by a current source in parallel to a diode and its series and parallel equivalent resistances [1].
The characteristic equation of the diode which describes the relation between current and voltage
(
I V×)
is given by (2).0 1 D T V nV D
I I e
= −
(1)
where ID is the diode current, I0 is the reverse bias saturation current of the diode, VD is the voltage across the diode, n is the ideality factor of the diode and VT is the thermal voltage. The thermal voltage, VT has the function as shown in (2).
T kT V
q
= (2)
where k is the Boltzman constant Tis cell’s operating temperature in degree Kelvin and q is the electron charge. Using the diode equation (1) the relation between current and voltage of the circuit of Figure 1 is:
( )
0 1
PV S
T
V IR
nV PV S
PV
P
V IR
I I I e
R + + = − − − (3)
where I and VPV are the current and output voltage of the circuit, IPV is the current generated by the solar panel, Rs and Rp are the series and parallel equivalent resistances of the circuit, respectively. In real cells,
s
R is about 3
10− Ω and the parallel resistance more than 10Ω.
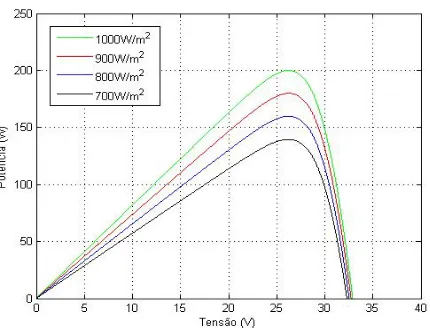
Thus, the function that describes the relation between the current and voltage of the solar cell depends on both the internal characteristics, Rp and Rs resistances, and external parameters such as temperature and intensity of solar radiation. In normal conditions the temperature is considered to be 25˚C, and the solar radiation is equal to 1000 W/m². Figures 2 and 3 show the variation of the characteristic curve for different values of temperature and radiation.
3. MPPT (Maximum Power Point Tracking)
The output power of the solar cell can be estimated analyzing the curvesVxI in Figures 2 and 3. Figure 2 de-picts the curves VxI for different values of temperature and Figure 3 dede-picts the curves VxI for different values of solar radiation. In these figures, the maximum power points are highlighted for each curve. It is important to emphasize that for a constant solar radiation, as lower is the temperature the higher is the power will be supplied at the MPP. Otherwise, for a constant temperature, as higher is the solar radiation higher power will be supplied at the MPP. These characteristics are displayed is Figures 4 and 5, respectively.
Both the solar radiation and the solar cell temperature are not constant throughout the day. In this way, a dy-namic MPPT controller is desired to optimize the solar cell power delivery. In order to obtain the higher VxI product, the MPPT controller is a closed loop controller embedded in a power electronic device to regulate the
[image:2.595.185.411.606.706.2]RS RP ` IPV ID I VPV
Figure 2. I × V curve for different values of temperature.
Figure 3. I × V curve for different values of solar radiation.
[image:3.595.192.410.511.700.2]Figure 5. P × V curve for different values of solar radiation.
output voltage. Therefore, the use of a power electronic device increases the total cost and may be not necessary depending on the load requirements. Thus, the MPPT control technology should be applied in special loads and/or complex electrical systems which justify its usage costs.
4. Buck-Boost Converter
The buck-boost converter is widely used in photovoltaic systems, being responsible for the voltage regulation at the load bus. The output voltage can be controlled by this converter varying the duty cycle of the semiconductor switch (Figure 6).
Controlling the output voltage, the energy transfer from the solar cell to the load can be regulated. The rela-tion between the load voltage Va, the source voltage Vs, and the switch duty-cycle (D) is given by:
a
a S V D
V V
=
− (4)
5. Proposed P&O Control Using Fuzzy Logic
The Perturb and Observe method (P&O) is one of the simplest and common control method to employ in pho-tovoltaic systems. It consists of increasing or decreasing the output voltage of the DC-DC converter by a fixed step value to achieve the MPP. The active power flow Pout(k) is calculated for each voltage variation and the new power value is compared to the last one Pout(k-1). If the Pout(k) is higher than Pout(k-1), then the next voltage variation will be kept in the same direction, otherwise it will go to the opposite direction.
Usually the voltage step value ΔV is fixed around less than 1% of the output voltage Vout. Moreover, in ac-tual equipment, the voltage perturbation occurs with the same microcontroller sampling frequency and thus the MPPT is not achieved.
In order to go with the MPPT and keep the P&O control advantages, recent studies have been focus on adap-tive control methods. One of these methods employs the fuzzy logic technique [1-4].
The adaptive control method using Fuzzy logic enhances the flexibility of the control, by varying the voltage step value. For a small value of ΔV the control dynamic is slow, however for large step values there is a high-er oscillation around the maximum powhigh-er point, which can result in an undesired unstable condition. In this manner, the Fuzzy logic acts to adjust properly the ΔV amplitude to guarantee fast dynamic in transitory re-sponse, and also reduced power oscillation with satisfactory robustness in steady-state to goal with the MPPT.
The proposed control method has two input signals and one output signal, as depicted in Figure 7. The inputs are the measured load voltage and current, and the output is the switch duty-cycle signal. The controller is com-posed by three main procedures: the Fuzzification, the Inference and the Deffuzification.
5.1. Fuzzification
C L
Va Va
CA
RG
A
Figure 6. Buck-boost converter.
Figure 7. Input and output signals of
the Fuzzy Controller.
are grades classifications which composes sets of membership functions. Therefore, the inputs and outputs are used to calculate the voltage and power variation:
k k 1
ΔV =V −V− (5)
k k 1
ΔP=P −P− (6)
where V is the present measured output voltage and k Vk 1− is the last sampling measured output voltage. The power variables P and k Pk 1− are obtained through the VxI product of the present and last sampling measured voltages and current signals, respectively.
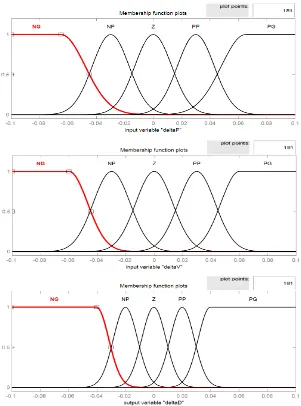
Both resultant signals (ΔV and ΔP) and the output variable ΔD (duty cycle variation of the converter) are divide in five categories: big negative (BN), small negative (SN), zero (Z), small positive (SP), big positive (BP). The membership functions were chosen intuitively, as shown in Figure 8. All variables were normalized by nominal operating values of known conditions of temperature and solar radiation.
5.2. Inference
Table 1 and Figure 9 show the set of rules of the Fuzzy controller. All the inputs are Fuzzy variables: voltage variationΔV , power variation ΔP and duty cycle variation ΔD (output of the controller).
The inference Fuzzy method used was the Mandami method with max-min composition operation.
5.3. Defuzzification
The output variable of the Fuzzy controller is a numerical variable, thus a defuzzification method is needed. The Centroid defuzzification method was chosen to transform the linguistic output into a physical variable (duty cycle of the buck-boost converter). The method is given by Equation (7), thus obtaining the amount of duty cycle that will be added to the previous value. Therefore the output voltage of the buck-boost converter will vary seeking the maximum power point.
( )
( )
* .
. C
C
z z dz z
z dz µ
µ
=
∫
∫
(7)6. Simulation Results
In order to verify the proposed controller performance, a MATLAB Simulink simulation was done. Figure 10 depicts the system simulation, which is composed of the power circuit and the controller.
The power circuit has a PV module with 18 solar cells in series and 10 in parallel. This PV inputs a buck-boost converter which supplies a resistive load of 0.5 Ω. The Fuzzy adaptive P&O controller is mainly composed of: low-pass filters, to mitigate the high frequency components of the measured signals (current and
∆P
Figure 8. Funções de pertinência das variáveis de entrada (ΔVeΔP) e de saída (ΔD).
[image:6.595.148.448.522.705.2]voltage of the load); Fuzzy controller; and the PWM block.
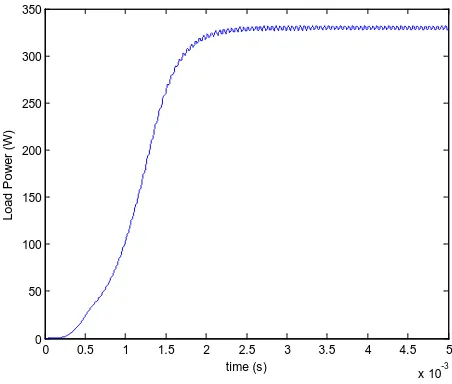
The Fuzzy block inputs are presented in Figures 11 and 12. According to the set of rules of the Fuzzy con-troller The MPP is achieved when both ΔP and ΔV are zero. Moreover, the dynamic response of the con-troller is shown in Figure 13 (output signal ΔD), where the steady state is achieved in 2.5ms. Note that, at this time the power supplied by the PV module accomplished the maximum power point (Figure 14) at 13V (Figure 15) and duty cycle equal to 0.3 (Figure 16).
7. Conclusions
A novel MPPT controller for photovoltaic systems was proposed using Fuzzy logic to achieve better perfor-mance in tracking the maximum power point of the solar cells.
Table 1. Set of Rules.
P V
∆ ∆ NG NP Z PP PG
NG PG PP NP NP NG
NP PP PP PP NP NP
Z PP PP Z NP NP
PP NP NP PP PP PG
[image:7.595.92.540.245.674.2]PG NG NP NP PP PG
[image:7.595.185.411.520.701.2]Figure 10. MATLAB Simulink simulation.
Figure 11. Input signal ΔP of the Fuzzy controller.
Controller
Power Circuit
0 0.5 1 1.5 2 2.5 3 3.5 4 4.5 5
x 10-3 0
0.005 0.01 0.015 0.02 0.025 0.03 0.035
time (s)
D
el
taP
(
p.
u.
Figure 12. Input signal ΔV of the Fuzzy controller.
Figure 13. Output signal ΔD of the Fuzzy controller.
Figure 14. Load power.
0 0.5 1 1.5 2 2.5 3 3.5 4 4.5 5
x 10-3 0
0.005 0.01 0.015 0.02 0.025 0.03 0.035
time (s)
D
el
taV
(
p.
u.
)
0 0.5 1 1.5 2 2.5 3 3.5 4 4.5 5
x 10-3 -0.01
-0.005 0 0.005 0.01 0.015 0.02 0.025 0.03
time (s)
D
el
taD
0 0.5 1 1.5 2 2.5 3 3.5 4 4.5 5
x 10-3 0
50 100 150 200 250 300 350
time (s)
Load P
ow
er
(
W
[image:8.595.184.410.512.704.2]Figure 15. Load voltage.
Figure 16. Duty cycle.
The set of rules of the controller were designed to vary the duty cycle variation, different from the classical P&O controller. Simulation results verified the efficiency of the controller, highlighting the fast response and good dynamic of the system.
References
[1] Xiao, W. and Dunford, W. (2004) A Modified Adaptive Hill Climbing MPPT Method for Photovoltaic Power Systems.
IEEE Power Electronics Specialists Conference, 3, 1957-1963.
[2] Won, C.-Y., Kim, D.-H., Kim, S.-C., Kim, W.-S. and Kim, H.-S. (1994) A New Maximum Power Point Tracker of
Photovoltaic Arrays Using Fuzzy Controller. 25th Annual IEEEPower Electronics Specialists Conference, 1, 396-403.
[3] Mohd Zainuri, M., Mohd Radzi, M., Soh, A. and Rahim, N. (2012) Adaptive P& O-Fuzzy Control MPPT for PV Boost
dc-dc Converter. 2012 IEEE International Conference on Power and Energy (PECon), Kota Kinabalu, 2-5 December
2012, 524-529.
[4] Kuo, Y.-C., Liang, T.-J. and Chen, J.-F. (2001) Novel Maximum-Power-Point-Tracking Controller for Photovoltaic
Energy Conversion System. IEEE Transactions on Industrial Electronics, 48, 594-601.
[5] Femia, N., Petrone, G., Spagnuolo, G. and Vitelli, M. (2005) Optimization of Perturb and Observe Maximum Power
Point Tracking Method. IEEE Transactions on Power Electronics, 20,963- 973.
[6] Esram, T. and Chapman, P. (2007) Comparison of Photovoltaic Array Maximum Power Point Tracking Techniques.
Energy Conversion, 22, 439-449. http://dx.doi.org/10.1109/TEC.2006.874230
0 0.5 1 1.5 2 2.5 3 3.5 4 4.5 5
x 10-3 -2 0 2 4 6 8 10 12 14 time (s) Load v ol tage ( V )
0 0.5 1 1.5 2 2.5 3 3.5 4 4.5 5
fluenced by Solar Irradiation and Cell Temperature. 13th International Conference on Computer Modelling and Simu-lation (UKSim),Cambridge, 30 March-1 April 2011, 376-381.
[8] Chin, C.S., Chin, Y.K., Chua, B.L., Kiring, A. and Teo, K. (2012) Fuzzy Logic Based MPPT for PV Array under
Par-tially Shaded Conditions. 2012 International Conference onAdvanced Computer Science Applications and