http://dx.doi.org/10.4236/ijg.2016.71005
How to cite this paper: Khalil, Md.I., Khan, Md.N.I., Kabir, Md.Z., Majumder, R.K., Ali, Md.I., Paul, D. and Islam, S.M.A. (2016) Heavy Minerals in Sands along Brahmaputra (Jamuna) River of Bangladesh. International Journal of Geosciences, 7, 47-52. http://dx.doi.org/10.4236/ijg.2016.71005
Heavy Minerals in Sands along
Brahmaputra (Jamuna) River
of Bangladesh
Md. Ibrahim Khalil
1*, Md. Nazrul Islam Khan
2, Md. Zafrul Kabir
1, Ratan Kumar Majumder
1,
Md. Idris Ali
3, Debasish Paul
3, Syed Mohammad Azharul Islam
4 1Nuclear Minerals Unit, Atomic Energy Research Establishment, Dhaka, Bangladesh2Material Science Division, Atomic Energy Center, Bangladesh Atomic Energy Commission, Dhaka, Bangladesh 3Health Physics and Radioactive Waste Management Unit, Atomic Energy Research Establishment, Dhaka, Bangladesh
4Department of Physics, Jahangirnagar University, Dhaka, Bangladesh
Received 25 December 2015; accepted 25 January 2016; published 28 January 2016
Copyright © 2016 by authors and Scientific Research Publishing Inc.
This work is licensed under the Creative Commons Attribution International License (CC BY).
http://creativecommons.org/licenses/by/4.0/
Abstract
Sands along Brahmaputra River of Bangladesh have long been considered to be a source of heavy minerals (HMs) since it traversed a long way through various terrains. An attempt has been made under this research work to determine the kinds and amounts of heavy minerals in the sands sourced from the river system. Samples from 14 locations along Brahmaputra River covering 30 km distance from upstream to downstream of the river are found to contain dif-ferent heavy minerals concentration with a range of 7.92 - 25.16 weight% with the remaining of the sample comprising silicate and aluminosilicates. Mineral characterization from peak po-sitions in diffractogram of X-ray Diffraction (XRD) evaluate quartz, feldspar and mica are major categories light mineral while rutile, magnetite, illmenite, zircon, monazite, garnet, uranium arsenide and uranium fluoride are the major types heavy minerals. Ilmenite and rutile are main contributors of total heavy mineral (THM). Titanium bearing minerals ilmenite and rutile contributes 26.22% - 31.01% and 14.57% - 23.50% of THM. In the present study area, most of the sands are found to be fine and medium grained as obtained from the particle sizes analysis using 18- to 230-mesh.
Keywords
Heavy Minerals, River, Sand, Bangladesh
1. Introduction
Minerals are the composite of different elements and occur naturally as crystalline inorganic substances in sedi-ments. Mineral sediments, sands and mud are weathered from mountain belts, transported by rivers, glaciers or wind and deposited. Minerals are classified into two types on the basis of its density such as light minerals (spe-cific density less than 2.9/103 kg·m−3) and heavy minerals (specific density greater than 2.9/103 kg·m−3) [1]. The erosion of weathered rocks and minerals results in the concentration of the more resistant and higher specific gravity (density) minerals (2.9/103 kg·m−3).
The Brahmaputra River originating in Tibet and flowing through Tibet and the north-eastern part of India en-ters Bangladesh in Kurigram District. The immense amount of sediment carried by the Brahmaputra River, de-rived from intense erosion of the Himalayas (in the north), is delivered to the Bay of Bengal. During transporta-tion sandy materials laid down on the bed of the river, forming sand bars. The thickness of sand deposits up to gravel bed is 44 m [2]. For economic exploitation of mineral sands, it is necessary to identify the minerals present, quantify total reserves of sand deposits, determine the contents and quality of economic minerals, and find the market demands in the country and abroad. Non-marine alluvial sand placer deposits are also known to be sources of heavy minerals (HMs), e.g. Gbangbama deposit in Sierra Leone [4], central Kalimantan, Borneo, Indonesia [3]. Compared to HM sand accumulations in beach sand deposits, the concentration of HMs in river sands is generally lower, with as little as 5% - 10% total HMs [4]. Heavy mineral river deposits may be promi-nent in Bangladesh as the river and drainage systems within Bangladesh are extensive, carrying large quantities of sandy sediments to the coastal regions, e.g. the Brahmaputra River carries an estimated (7.35 - 8.00) × 108 tone of sediment per year [5][6]. The alluvial sediments contain both light and HMs with the HMs generally deposited on the bed of the river systems forming HM-rich sand bars.
Heavy minerals, having higher specific gravity, occur in all sands. Some sands contain large enough concen-trations of valuable heavy minerals to serve as commercial sources of these minerals. The kinds and amounts of heavy minerals occurring in Brahmaputra River are of great interest to warrant commercial exploitation. An at-tempt has been made through this study to know the heavy minerals concentration together with individual heavy mineral quantification along Brahmaputra River in Bangladesh.
2. Materials and Methods
2.1. Study Area
The present study area covers Kurigram sadar, Ulipur and Chilmari Upazila of Kurigram district which is tra-versed by Brahmaputra (Jamuna) river (25˚48'26"; 89˚45'09" - 25˚33'32"; 89˚41'01"). The study area covers sta-ble sand bars in an area of 30 km × 4 km from upstream to downstreamof the Brahmaputra River in the Kuri-gram district, north-eastern Bangladesh (Figure 1).
2.2. Sample Collection and Analysis
The present study covers about 30 km × 4 km area from which 14 successive locations were selected and num-bered as DK1-DK14. From each location two samples were collected from sand bar (“chars”) and river bed found in the study area. The sample locations were recorded in terms of degree-minute-second (latitudinal and longitu-dinal position) using a hand-held global positioning system (GPS) (Model: Magellan-Map-410) unit. Each loca-tion is separated by a distance of approximately 2 km (approximately 1 minute in co-ordinate system). The ples were collected at the depth of 0 - 5 cm by plastic spade during summer period of 2014 and collected sam-ples were packed in polyethylene bags. Each sample has the weight of about 2 kg. The collected samsam-ples were air dried at room temperature in open air.
Figure 1. Location map of the study area.
For mechanical separation 10 kg raw sand samples were dried in the sun to remove moisture. Separation of heavy and light minerals was carried out depending on specific gravity/density of the minerals using labora-tory shaking table. For each sample, heavy minerals fraction obtained after density separation dried in burner. Magnetite, ilmenite, rutile and zircon mixed with others were separated using Induced Roll Magnetic Separa-tor (IRMS) applying fixed magnetic intensity at 0.5 amp, 2.5 amp, 5.5 amp, and 7.5 amp condition, respec-tively.
Powder X-ray Diffraction (XRD) is a versatile technique that can be used to identify any crystalline sub-stances, such as most minerals. It can also be used to quantify the proportions of different minerals or indeed many other substances when they are present in a mixture. Powder X-ray diffraction analysis is seemingly the perfect technique for crystalline-mixture analysis, since each component of the mixture produces its characteris-tic pattern independently of the others, making it possible to identify the various components by unscrambling their superposed patterns. An X-ray beam of known wavelength is focused on a powdered sample and X-ray diffraction peaks are measured using a detector. In the present study X-ray diffraction technique has been uti-lized to discern these properties. The phase identification was performed using Philips X’Pert Pro multipurpose X-ray diffractometer which uses copper Kα radiation. X-ray generator operated at 40 kV and 30 mA, and all scans were run at a speed of 2˚ per minute, from 10˚ to 70˚, with a continuous step size of 0.02.
3. Results and Discussion
3.1. Heavy Mineral Separation Analysis
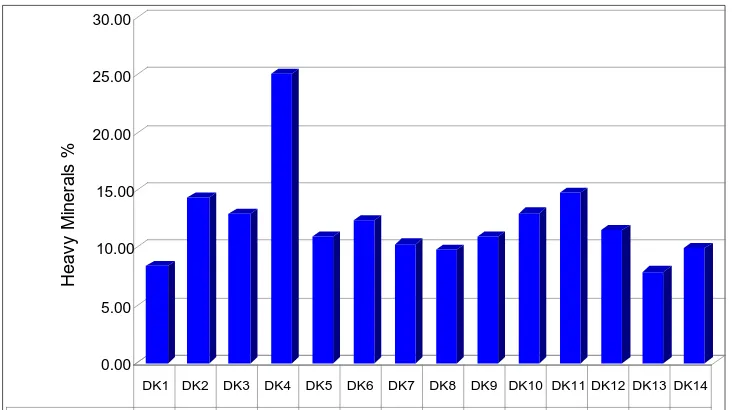
The heavy mineral separation analysis has been carried out to know the total heavy mineral (THM) weight per-centage in the present samples. Weight perper-centage of separated heavy minerals in most of the samples varied from 8% to 15%, while in one sample it reaches to 25%; similar THM value is reported for Brahmaputra river sand [10]. The THM percentage is varied greatly from site to site. It is minimum in DK13 and it is maximum in DK4 (Figure 2). Other sites are having intermediate values.
Roll Magnetic Separator (IRMS) resulted to separate magnetite, ilmenite, rutile and zircon mixed with other minerals. Separation of samples DK1, DK8 and DK12 reveals that ilmenite and rutile are main contributors of to-tal heavy mineral (THM). Titanium bearing minerals ilmenite and rutile contributes 26.22% - 31.01% and 14.57% - 23.50% of THM.
3.2. Granulometric Analysis
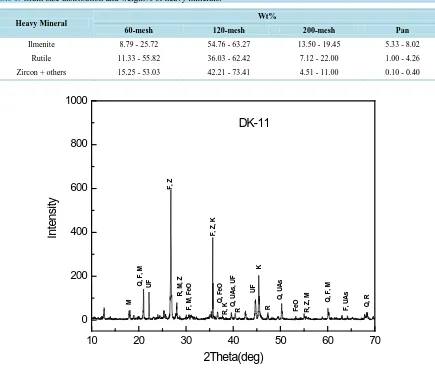
[image:4.595.131.497.270.475.2]Granulometric analysis has been carried out to know the content of sand, silt and clay (%) in the present sedi-ments. Percentage of sand, silt and clay (%) content of the samples are presented in Figure 3. Sand is the main constituent in all the sampling locations, which varied from 91.87% to 99.74%. Silt content is the least constitu-ent which varied from 0.03% to 7.98%. In the samples studied, the heavy minerals occur predominantly in the 60- to 200-mesh sieve grade (Table 1). 75% - 90% heavy minerals of THM occur in 60- to 120-mesh while some heavy mineral grains are finer but most of the samples contain negligible amounts of material of this grain size. In a given sample, the heavy minerals are primarily finer grained than the average grain size of the whole sample.
Figure 2. Heavy minerals weight% in the sand sample of the study area.
Figure 3. Distribution of sand, silt and clay (%) content in sediment samples of the study area.
0.00 5.00 10.00 15.00 20.00 25.00 30.00
H
eav
y
M
iner
al
s
%
Heavy Minerals% 8.37 14.38 12.92 25.16 10.92 12.43 10.33 9.87 10.95 13.01 14.83 11.52 7.92 10.00
[image:4.595.171.461.513.705.2]3.3. X-Ray Diffraction
X-ray diffraction is a unique analytical tool for the analysis of geological samples. It is the most important and informative technique for identification and characterization of minerals in the sediments. The XRD spectra were recorded for all the sediment samples to determine the mineralogical composition. A representative dif-fractogram is shown in Figure 4 along with name of the minerals present.
The XRD pattern (Figure 4) indicates that the compositions are of single-phase structure since no ambiguous reflections other structure is evidenced. Analyzing the XRD patterns we notice that the position of the peaks comply with the reported value. All diffraction peaks of the studied samples are compared to the reported struc-ture for relevant base sand samples. The observed peaks at 2 theta value of 18.37, 21.24, 23.86, 26.97, 29.01, 30.10, 35.42, 36.95, 38.43, 39.62, 40.64, 44.24, 46.10, 47.81, 50.53, 53.43, 55.30, 60.28, 63.68, 68.55 confirmed that the sand is mainly containing Quartz, Monazite, Feldspar, Uranium Fluoride, Rutile, Zircon, Hematite, Kayanite, Uranium Arsenide. Observed peak positions were matched against the International Centre for Dif-fraction Data (ICDD) Joint Committee on Powder DifDif-fraction System (JCPDS) card database.
[image:5.595.97.532.326.696.2]The Brahmaputra drains the Tibetan Plateau of China and is dominated by upland tributaries originating in the Himalayas. The Brahmaputra flows through various rock types including Precambrian metamorphics (high-grade schists, gneisses, quartzites, metamorphosed limestones), felsic intrusives, and Paleozoic-Mesozoic sandstones, shales and limestones [12]. From the heavy mineral assemblage study of the Brahmaputra-Jamuna River sand, it can be postulated that there are several types of source rock complexes are exist in the specific source area
Table 1. Grain size distribution and weight% of heavy minerals.
Heavy Mineral Wt%
60-mesh 120-mesh 200-mesh Pan
Ilmenite 8.79 - 25.72 54.76 - 63.27 13.50 - 19.45 5.33 - 8.02
Rutile 11.33 - 55.82 36.03 - 62.42 7.12 - 22.00 1.00 - 4.26
Zircon + others 15.25 - 53.03 42.21 - 73.41 4.51 - 11.00 0.10 - 0.40
10
20
30
40
50
60
70
0
200
400
600
800
1000
R M R , Z , M K UF F, UAs Q, R
Q , F , M F eO Q , UAs R R, K Q, F e O Q , UAs , UF F, Z, K F, M , Fe O R , M , Z F, Z Q , F , M UF
Int
ens
ity
2Theta(deg)
DK-11
Figure 4. The representative XRD pattern of the sand sample. M = Monazite, Q = Quartz, F = Feldspar, UF = Uranium
mainly Lesser Himalayan and Indo-Burman Ranges with having little influence of Himalayan tributaries and north Himalayan [13]. Heavy minerals obtained in the study might have the similar source as described by the researchers.
4. Conclusion
The heavy fractions of sands along the Brahmaputra River are primarily the source of the iron titanium and iron oxide minerals magnetite and ilmenite. Most of the heavy minerals are in the 60- to 200-mesh size range. Most of the samples have between 8 and 15 percent heavy minerals. Ilmenite ranges from about 4 to 9 percent and ru-tile ranges from about 3 to 5 percent. Such percentages are much higher than those of Someshari river sands of Bangladesh. Considering the high heavy mineral concentration in river sands, the possibility of commercial uti-lization of the heavy minerals in sands along the Brahmaputra River is quite a burning issue at the present time.
Acknowledgements
The authors are thankful to local Administration and people of the study area for their assistance during field work. The authors are also grateful to laboratory staffs of Nuclear Minerals Unit of Atomic Energy Research Establishment for their assistance in laboratory analysis. This work is financed by the Ministry of Science and Technology, Government of The People’s Republic of Bangladesh under the Special Allocation program 2014- 2015.
References
[1] de Meijer, R.J., James, J.R., Jennings, P.J. and Koeyers, J.E. (2001) Cluster Analysis of Radionuclide Concentration in Beach Sand. Applied Radiation and Isotopes, 54, 535-542. http://dx.doi.org/10.1016/S0969-8043(00)00196-2
[2] Umitsu, M. (2001) Holocene Sea-Level Changes and Coastal Evolution in Japan. The Quaternary Research, 30, 187- 196.
[3] Aral, H., Pownceby, M.I. and Im, J. (2008) Characterisation and Beneficiation of Zircon-Rich Heavy Mineral Concen-trates from Central Kalimantan (Borneo, Indonesia). Transactions of the Institution of Mining and Metallurgy Section
B—Applied Earth Science, 117, 77-87. http://dx.doi.org/10.1179/174327508X339837
[4] Force, E.R. (1991) Geology of Titanium-Mineral Deposits. Geological Society of America, Special Paper 259.
http://dx.doi.org/10.1130/spe259-p1
[5] Coleman, J.M. (1969) Brahmaputra River: Channel Processes and Sedimentation. Sedimentary Geology, 3, 139-239.
http://dx.doi.org/10.1016/0037-0738(69)90010-4
[6] Rahman, M.A., Biswas, P.K., Zaman, M.N., Miah, M.Y., Hossain, T. and Imamul Huq, S.M. (2012) Characterisation of the Sand of Brahmaputra River of Bangladesh. Bangladesh Journal of Scientific and Industrial Research, 47, 167- 172.
[7] Carver, R.E. (1971) Heavy Mineral Separation. In: Carver, R.E., Ed., Procedures in Sedimentary Petrology, Wiley, NewYork, 427-452.
[8] Solai, A., Suresh Gandhi, M., Chandrasekaran, K. and Ram Mohan, V. (2009) Distribution of Heavy Mineral Sand Their Provenance Studies in and around Tamiraparani Estuary and off Tuticorin Tamil Nadu, India. International
Journal of Earth Sciences and Engineering, 2, 527-543.
[9] Milner, I. (1962) Sedimentary Petrology. George Allen and Unwin Ltd., London, 643-715.
[10] Rahman, M.A., Pownceby, M.I., Haque, N., Bruckard, W.J. and Zaman, M.N. (2014) Characterisation of Titanium- Rich Heavy Mineral Concentrates from the Brahmaputra River Basin, Bangladesh. Applied Earth Science (
Transac-tions of the Institution of Mining and Metallurgy B), 123, 222-233.
[11] Rahman, M.A., Zaman, M.N., Biswas, P.K., Sultana, S. and Nandy, P.K. (2015) Physical Separation for Upgradation of Valuable Minerals: A Study on Sands of the Someswari River. Bangladesh Journal of Scientific and Industrial
Re-search, 50, 53-58. http://dx.doi.org/10.3329/bjsir.v50i1.23810
[12] Huizing, H.G.J. (1971) A Reconnaissance Study of the Mineralogy of Sand Fractions from East Pakistan Sediments and Soils. Geoderma, 6, 109-133. http://dx.doi.org/10.1016/0016-7061(71)90029-2