International Journal of Emerging Technology and Advanced Engineering
Website: www.ijetae.com (ISSN 2250-2459, Volume 2, Issue 5, May 2012)155
Transportation Mode Recognition with Zigbee Using
Accelerometer
M.Munisankar¹, R.Nagendra²
¹Project student, 10-7, Nalanda nagar, S.V.U post, Tirupati, A.P, India ²Asst.Professor, Sree Vidhyanikethan Engg College, A.Rangampet, Tirupati, A.P, India
1[email protected] 2[email protected]
Abstract—Automatic recognition of human activities is one of the important and challenging research areas in proactive and ubiquitous computing. Human-activity recognition requires an objective and reliable technique that can be used under the conditions of daily living. Complex sensors such as cameras in computer vision have been used to recognize activities. In general, the computer vision-based techniques for tracking and activity recognition often work well in a laboratory or well-controlled environment.
However, they fail in achieving the same level of accuracy under a real-home setting due to the clutter, variable lighting, and highly varied activities that take place in the natural
environments. Motion capture with the body-fixed
accelerometers offers an appropriate alternative for the assessment of daily physical activities
The Growth in the elderly population will pose great pressure on the healthcare system to treat common geriatric problem. Preventive approaches like encouraging elderly people to perform physical exercises can decrease the risk of developing chronic diseases. Excessive exercises performed by Sportsmen leads to severe problems. Lack of physical work or excessive physical exercise is undesirable. The present scenario of modern world demands balanced physical work which needs record on daily basis. This project proposes a wearable platform which addresses the requirement.
Keywords—Accelerometer, Acceleration Synthesization, Acceleration Decomposition Microcontroller, Zigbee
I. INTRODUCTION
An accelerometer is a device that measures proper acceleration. Accelerometers can provide quantitative measurements and respond to both acceleration for gravity and acceleration for body movement. This makes them suitable for measuring postural orientation as well as body movements. Single- and multi-axis models are available to detect magnitude and direction of the acceleration as a vector quantity, and can be used to sense orientation, acceleration, vibration shock, and falling.
The Embedded Based Transportation Mode Recognition with Zigbee using Accelerometer is proposed in the present project which analyses the body motions of a user to accurately determine.
Accelerometer is used to record the motions of the body in X Y and Z axis and senses the user’s body motions to give corresponding motion strength. The microcontroller interfaced to accelerometer records the physical activity and prepares the profile of the user which can analyze later. Accelerometer ADXL335 is used for this project with the features of 3-axis sensing. A microcontroller with built-in A/D converter is used to built-interface accelerometer and send the data serially to PC using Zigbee module. PC at the other end receives the data through Zigbee and generates the physical activity profile.
Implementation of project is done in two steps. First the code is developed in embedded ―c‖ for micro controller to interface with 3-Axis Accelerometer using Keil IDE. Second the Software is developed to prepare the profile in the PC as per the data received from wearable module. Recognizing the transportation modes of people’s daily living is an important research issue in the real-time
applications.
1. GPS based recognition is poor reception of GPS information and heavy energy consumption.
2. GSM based recognition it needs long time to observe the change of cell information and recognition accuracy is often low.
In order to avoid these we go for Zigbee combined with Accelerometer to recognize transportation modes, such as walking, driving, etc.
Accelerometer based recognition is more acceptable because:
It consumes much less energy than GPS
It needs a little starting time
It can obtain sensor data all the time
This method does not depend on any external
equipment and will not affect by different deployment of cell towers.
Two methods are used to find the acceleration in accelerometers:
International Journal of Emerging Technology and Advanced Engineering
Website: www.ijetae.com (ISSN 2250-2459, Volume 2, Issue 5, May 2012)156
1. Acceleration Synthesization:
Accelerometer is a type of transducer. Which converts capacitance into an analog output voltage, which is
proportional to acceleration. In Acceleration
Synthesization Linear model can be used.
The three axes are ax , ay, az. As ax, ay, az are the orthogonal decompositions of real acceleration.
The magnitude of synthesized acceleration can be
expressed as a=√ (ax² + ay² + az²)
2. Acceleration Decomposition:
It is a 3d method. For a particular sampling interval, the gravity component on each axis can be estimated by averaging all the acceleration measurements in the interval on that axis.
Vertical acceleration vector V corresponding to
gravity is estimated as V = (Vx ,Vy ,Vz ).
• Dynamic component of the acceleration can be
calculated as d =(ax −Vx , ay −Vy , az −Vz),which
is caused by the user’s motion rather than gravity.
• Then, the projection P of d upon the vertical axis
is P=(d.V/V.V)V
We can compute the horizontal component of dynamic
acceleration by vector subtraction, as h = d−P.
Then, magnitude of the vertical component and
magnitude of the horizontal component of dynamic acceleration at each point can be computed.
II. IMPLEMENTATION
Hardware Implementation
The project consists of the following hardware modules as shown in the figure2.1.
1. 16f873a PIC Microcontroller
2. Accelerometer
3. Zigbee Module
Block Diagram
(i)
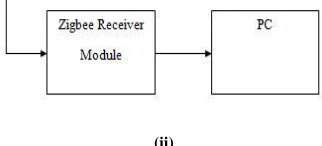
[image:2.612.362.523.148.221.2](ii)
Figure 2.1: Block diagram of Transportation mode recognition system (i) Transmitter Section (ii) Receiver section
Accelerometer
An accelerometer is a device that measures proper acceleration. Accelerometer ADXL335 is used for this project with the features of 3-axis sensing and gives the output in terms of analog voltages. An accelerometer is used to record the motions of the body in X, Y, Z axis and senses the user’s body motions to give corresponding motion strength.
Microcontroller
The 16f873a PIC microcontroller is the main component of this project. 16f873a PIC Micro controller is a 10-bit microcontroller with 72 Kbytes of programming memory. The microcontroller interfaced with the accelerometer records the physical activity and prepares the profile of the user which can be analyzed.
Zigbee
Zigbee is a specification for a suite of high level communication protocols using small, low-power digital radios based on the IEEE 802.15.4-2003 standard for wireless personal area networks (WPANs). Zigbee is a wireless communication used to transmit the data between the microcontroller and the pc.
The circuit diagram contains 16f873a PIC Micro Controller, ADXL335 Accelerometer and Zigbee Modules. Pic Micro Controller is a 10 bit micro controller with 72 Kbytes of programming memory and has three ports namely PORT A, PORT B; PORT C. The three axis Accelerometer is connected to PORTA of the micro controller of pins P.1^2, P.1^3, P.1 ^4 respectively.
International Journal of Emerging Technology and Advanced Engineering
Website: www.ijetae.com (ISSN 2250-2459, Volume 2, Issue 5, May 2012)157
Zigbee is a wireless communication used to transmit the data between the microcontroller and the pc. Zigbee module contains 20 pins and out of which we use only four pins. The pins which used are first pin, second, third and tenth pins. A power Supply of 3.3 V is given to the first pin of Zigbee. Second pin DOUT acts as a transmitter and third pin DIN/ CONFIG acts as a receiver. The output from the 17 pin of the micro controller is given to the third pin of the Zigbee. Zigbee transmits the data received from the micro controller.
Thereason for using pic microcontroller is due to their
low cost, wide availability, large user base, extensive collection of application notes, availability of low cost or free development tools, and serial programming (and
re-programming with flash memory) capability
.
Microcontroller Program can be done by using MPLAB software. Transportation mode results are seen in Pc by using Matlab software.
Applications Accelerometers
1. Cost sensitive, Low power, motion and tilt-
sensing applications.
2. Mobile Devices.
3. Gaming Systems.
4. Disk drive protection
5. Image stabilization in cameras
6. Sports and health devices
Zigbee
1. Industrial control, embedded
sensing, medical data collection
2. Smoke and intruder warning
3. Building automation
4. Home automation, etc.
III. PREVIOUS WORK
The most successful and exhaustive work in this regard is that of Bao & Intille (2004). In their experiments, subjects wore 5 biaxial accelerometers on different body parts as they performed a variety of activities like walking, sitting, standing still, watching TV, running, bicycling, eating, reading etc.
Acceleration data of the wrist and arm are known to improve recognition rates of upper body activities such as typing and martial arts movements. All past works with
multiple accelerometers have used accelerometers
connected with wires, which may restrict subject movement.
Based on these results, this work uses data collected from five wire-free biaxial accelerometers placed on each subject’s right hip, dominant wrist, non-dominant upper arm, dominant ankle, and non-dominant thigh to recognize ambulation, posture, and other everyday activities. Although each of the above five locations have been used for sensor placement in past work, no work addresses which of the accelerometer locations provide the best data for recognizing activities even though it has been suggested that for some activities that more sensors improve recognition
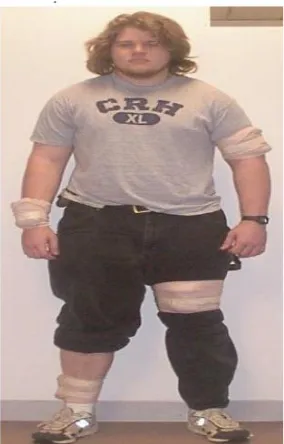
[image:3.612.374.516.273.495.2]Figure3.1: Bao & Intille experiment
International Journal of Emerging Technology and Advanced Engineering
Website: www.ijetae.com (ISSN 2250-2459, Volume 2, Issue 5, May 2012)158
Figure3.1 Hoarder boards were attached to 20 subjects on the 4 limb positions shown here (held on with medical
gauze), plus the right hip.
Figure
3.2 Hoarder datacollection board, which stored data from a biaxial accelerometer. The biaxial accelerometers are attached to the opposite side of the board.
In my project I am using single triaxial accelerometer to collect data from the observer. We have attempted to recognize activities using a single triaxial accelerometer worn near the pelvic region. Activity recognition is formulated as a classification problem. It reduces the electrical connections and increases the performance.
[image:4.612.353.546.171.628.2]IV. CIRCUIT DIAGRAM
Figure 4.1: Circuit diagram
V. RESULTS
Results are obtained from the Accelerometer and then classified as stationary and walking, jogging etc based on their acceleration magnitude and power spectrum of the x, y, z axis.
The confusion matrix is used to distinguish the changes in the Transportation modes from one state to another state.
This project is also suitable to ―Health monitoring systems‖,‖Driver fatigue monitoring systems‖ and some medical applications.
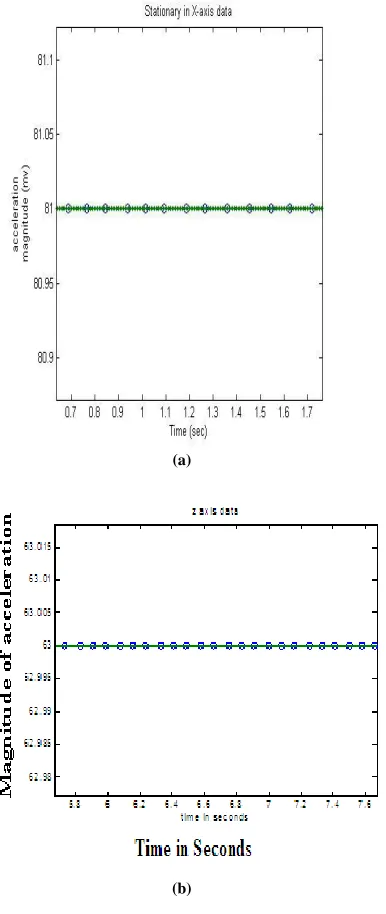
Stationary
Readings of X, Y and Z axis Values at Static Condition
(a)
International Journal of Emerging Technology and Advanced Engineering
Website: www.ijetae.com (ISSN 2250-2459, Volume 2, Issue 5, May 2012)159
[image:5.612.79.259.129.309.2]
(c)
Figure 5.1: (a) Stationary samples in x-axis. (b) Stationary samples in z-axis. (c) Stationary power spectrum in z-axis
The Figures 5.1 shows the X, Y and Z axes data at Static Condition. As the device is in Static Mode, there will not be any deviation in all the axes. The readings will be a horizontal line without any deviation. The power spectrum in static condition in any axis in figure8.1 (d) is used to find the frequency of the accelerometer.
Walking
Readings of X, Y and Z axis Values at Walking Condition
(a)
(b)
(c)
(d)
International Journal of Emerging Technology and Advanced Engineering
Website: www.ijetae.com (ISSN 2250-2459, Volume 2, Issue 5, May 2012)160
(e)
[image:6.612.355.526.162.647.2](f)
Figure 5.2: (a) Walking samples in x,y and z-axes. (b) Walking samples in x-axis. (c) Walking samples in z-axis. (d) Walking samples
in y-axis. (e) Walking position in x,y and z-axes (f) Stationary power spectrum in x-axis.
In walking the accelerometer magnitudes in x, y and z-axes changed and are varying as the person is in walking. The deviation in x, y and z can be observed in figures 5.2 (a), 5.2 (b), 5.2 (c), 5.2 (d).
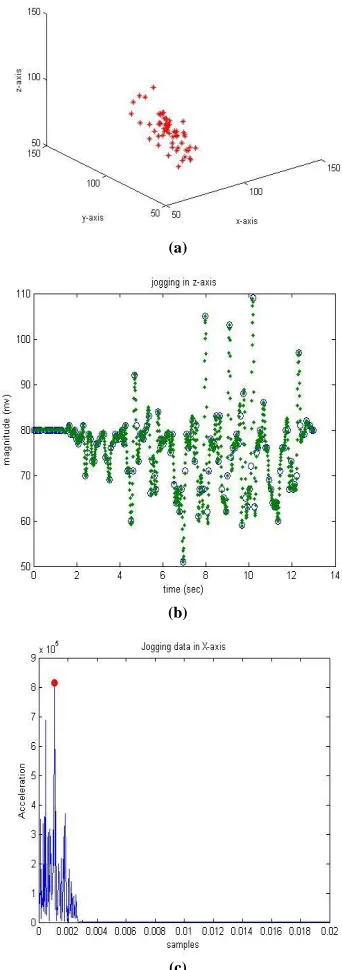
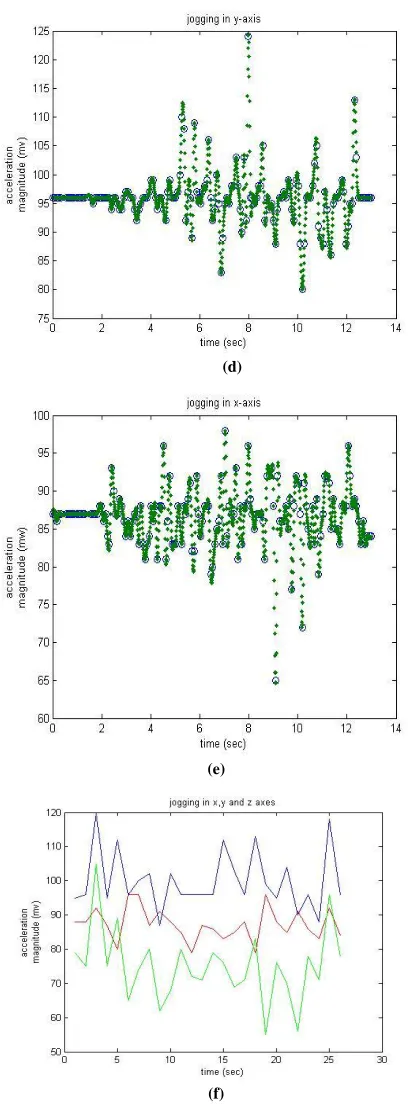
Jogging
Readings of X, Y and Z axis Values at Jogging Condition
(a)
(b)
International Journal of Emerging Technology and Advanced Engineering
Website: www.ijetae.com (ISSN 2250-2459, Volume 2, Issue 5, May 2012)161
(d)
(e)
[image:7.612.60.264.133.685.2]
(f)
Figure 5.3: (a) Jogging position in accelerometer. (b) Jogging samples in z-axis. (c) Jogging samples in y-axis. (d) Jogging samples in x-axis. (e) Jogging samples in x,y and z-axes. (f) Jogging power spectrum in
z-axis.
Running
Readings of X, Y and Z axis Values at Running Condition
(a)
(b)
International Journal of Emerging Technology and Advanced Engineering
Website: www.ijetae.com (ISSN 2250-2459, Volume 2, Issue 5, May 2012)162
[image:8.612.53.287.131.282.2](d)
Figure 5.4: (a) Running position in accelerometer. (b) Running power spectrum in y-axis. (c) Running samples in z-axis. (d) Running
samples in x,y and Z-axes
The Running position in accelerometer and their corresponding magnitudes in x, y and z-axes are shown in figure 5.4.
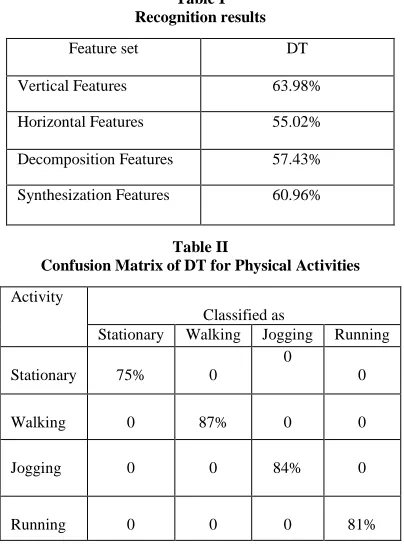
Recognition Results
[image:8.612.68.270.433.710.2]The recognition results are used to find the acceleration features in vertical and horizontal axes. The acceleration magnitude can be find by using acceleration synthesization and decomposition methods are shown in the table I
Table I Recognition results
Feature set DT
Vertical Features 63.98%
Horizontal Features 55.02%
Decomposition Features 57.43%
Synthesization Features 60.96%
Table II
Confusion Matrix of DT for Physical Activities Activity
Classified as
Stationary Walking Jogging Running
Stationary 75% 0
0
0
Walking 0 87% 0 0
Jogging 0 0 84% 0
Running 0 0 0 81%
VI. CONCLUSION
A Prototype of a hand held battery operated Human Physical Activity (Transportation modes) Measuring System is presented. This device is used to record the motions of the body in X, Y and Z axis and senses the user’s body motions to give corresponding motion Strength. The Micro Controller interfaced to accelerometer records the physical activity and prepares the profile of the user which can be analyzed.
Accelerometer frequency can be estimated up to 4Hz by using power spectrum estimation. In existing methods they can calculate up to 3Hz only. There is various machines available day today life which tells the present state of the body. There is no device in real time which tells the present state of the body. The Human Activity Measuring System has been developed using ADXL335 Accelerometer, 16F873A Pic Microcontroller and Zigbee Module. The motion Strength of the person is recorded and profile is created accurately.
The Transportation mode recognition with Zigbee using accelerometer can also used to find abnormal activities in humans. It can also used to detect accidents in vehicles and infant baby monitoring systems.
REFERENCES
[1 ] S. Reddy, J. Burke, D. Estrin, M. Hansen and M. Srivastava, ―Determining Transportation Mode on Mobile Phones‖, Proc. IEEE Int. Symp. Wearable Computers (ISWC 2008), IEEE Press, Sep. 2008, pp. 25-28, doi:10.1109/ISWC.2008.4911579
[2 ] Y. Zheng, L. Liu, L. Wang and X. Xie, ―Learning transportation mode from raw gps data for geographic applications on the web‖, Proc. 17th Int. Conf. World Wide Web (WWW 2008), ACM Press, Apr.2008, pp. 247-256, doi:10.1145/1367497.1367532.
[3 ] M. Mun, D. Estrin, J. Burke and M. Hansen, ―Parsimonious Mobility Classification using GSM and WiFi Traces‖, Proc. Fifth Workshop on Embedded Networked Sensors(HotEmNets 2008), ACM Press, Jun. 2008.
[4 ] P. J. Troped, M. S. Oliveira, C. E. Matthews, E. K. Cromley, S. J.Melly and B. A. Craig, ―Prediction of Activity Mode with Global Positioning System and Accelerometer Data‖, Medicine & Science in Sports & Exercise, vol. 40(5), May 2008, pp.972-978, doi:10.1249/MSS.0b013e318164c407.
[5 ] M. Mun, S. Reddy, K. Shilton, N. Yau,P. Boda, J.Burke, D.Estrin, M. Hansen, E.Howard and RWest, ―PEIR, the Personal Environmental Impact Report, as a Platform for Participatory Sensing Systems Research‖, Proc. 7th Ann. Int. Conf. Mobile Systems, Applications and Services
(Mobisys 2009), ACM Press,Jun.2009,pp.55
International Journal of Emerging Technology and Advanced Engineering
Website: www.ijetae.com (ISSN 2250-2459, Volume 2, Issue 5, May 2012)163
[7] A. H. Ismail, J. W. Baraby, and C. B. Smith ―Relationships between Mechanical force and physiological cost during gait in adult men,‖ in Biomechanics: Proceeding of the C.I.C. Symposium Biomechanics, J. M.Cooper, Ed. Chicago: The Athlete Inst., 1971, pp. 99–106.
[8] J. Reswick, J. Perry, D. Antonelli, N. Su, and C. Freeborn, ―Preliminary Evaluation of the vertical acceleration gait analyzer (VAGA),‖ in Proc.6th
Annu. Symp. External Control Extremities, Dubrovnik, 1978, pp.305–314.
[9] J. A. Balogun, D. A. Martin, and M. A. Clendenin, ―Calorimetric Validation Caltrac accelerometer during level walking,‖ Phys.Ther. vol. 69, pp. 501– 509, 1989
[10] www.datasheetarchive.com/sim%20300%20gsm%20 module-datasheet.html http://www.analog.com/static/imported files/data_sheets/ADXL335.pdf