Comparison of Science Process Skills with Stem Career
Interests of Middle School Students
Fulya Zorlu1, Yusuf Zorlu2,*
1Department of Primary Science Education, Faculty of Ereğli Education, Bülent Ecevit University, Turkey 2Department of Primary Science Education, Faculty of Education, Dumlupınar University, Turkey
Copyright©2017 by authors, all rights reserved. Authors agree that this article remains permanently open access under the terms of the Creative Commons Attribution License 4.0 International License
Abstract
This study was aimed to examine the relation between the STEM (Science, Technology, Engineering and Mathematics) career interests and science process skills of middle school seventh grade students. Method of this study was the relational survey method. The study was conducted on the basis of voluntariness and participants were 133 seventh grade students (69 females and 64 males) who study in middle schools under the Ministry of Education. STEM-CIS and SPST was used data collection instruments in this study. SPSS package program was used to analyse the data obtained from research. When we consider STEM career interests, it was determined that career interest of students in the fields of Science and Mathematics were higher than their career interests in Technology and Engineering. When averages of STEM-CIS were considered, career interest in Engineering was lower than career interests in other fields. In accordance with findings obtained via STEM-CIS and SPST scales, it is determined that there are low or medium-level relations between STEM career interest and science process skills. It is observed that there are medium-level relations between career interest of Science, Technology and Mathematics and science process skills. The relation between science process skills and Engineering career interest is rather low level.Keywords
STEM, Science Process Skill, ScienceEducation
1. Introduction
This 21st century is a time frame where innovations and changes affect societies to a great extent. In line with the characteristic of this time frame, it is expected for individuals who constitute societies to have some competences with regard to information and skills practicum. Competences possessed by individuals affect their quality of life in relation to their performances in life
and education process in schools plays a rather significant role in this regard.
The main objective of education process should be integrating individuals with real life [1]. Importance is being attached to associated Science knowledge with real life events in science education [2]. In order to achieve this, students should be given insight into thinking skills which are known as Science process skills and which facilitate learning and provides a good grasp of manners and methods of research along with Science knowledge [3]. Enabling students to gain these skills is considered as one of the main objectives of science education and this is especially being emphasized in curriculums [4]. Because Science process skills involve cognitive, intellectual, manual and social skills used to solve problems encountered in daily life that they are regarded as a tool which enables individuals to get the most out of their knowledge [5, 6].
Science process skills are used in all available programs in the fields of science, physics, chemistry, biology and Engineering [7]. According to Strong [8], STEM education plays an important role in gaining Science process skills. In this context, STEM education based on an understanding which unifies disciplines of science, technology, mathematics and Engineering should be adopted [9, 10]. STEM education aims to enable students to gain problem solving skills by using knowledge and skills in different disciplines in conjunction [11, 12, 13, 14]. In line with these benefits it provides, interest of students in STEM fields should be enhanced and they should be encouraged to choose one of the Engineering and information technology, science or mathematics based career groups as their career field [15].
conducted to investigate the impact of STEM activities on Science process skills of students and their attitude towards science. The objective of this study is exploring the relation between the level of interest of middle school students to career interest fields in STEM and their science process skills. In line with this objective, an answer to the below question of study is sought.
1.1. Research Question
Is there a statistically meaningful relation between STEM career interests and science process skills of seventh grade students?
2. Materials and Methods
Relational survey design among the quantitative research methods was used in this study. Relational survey pattern aims to determine the existence and/or degree of covariance between two or more variables and examines the data obtained via relational analysis, correlational relations or comparison [19]. As the relation between the STEM (Science, Technology, Engineering and Mathematics) career interests of students and their science process skills is examined, pattern of research is relational survey.
2.1. Participants Characteristics
Participants were determined by using simple random method. First step was consisted of 172 seventh grade students. According to the volunteer principle of 172 seventh grade students, 140 seventh grade students participated in the research. 7 seventh grade students were not analyzed because they did not fill the data collection tool completely. The study was conducted on the basis of voluntariness and participants were 133 seventh grade students (69 females and 64 males) who study in middle schools under the Ministry of Education.
2.2. Data Collection Tools
2.2.1. Science Process Skills Test (SPST)
It was developed by Burns, Okey and Wise (1985). Translation into Turkish and adaptation was made by Özkan, Aşkar and Geban (1992). This test involves 36 questions and aims to measure skills of describing the variables, operational description, hypothesizing and defining, interpreting and researching graphics and data and designing research. The reliability of test was found as 0.79 after the statistical analysis [20].
2.2.2. STEM Career Interest Survey (STEM-CIS)
This survey was developed by Kier, Blanchard, Osborne and Albert (2013) and adapted to Turkish by Bilen, Ergün ve Irkıçatal [21]. The survey was composed of 4 factors, each involving 11 items, so that there were 44 items in total. Reliability co-efficient (Cronbach's alpha) of the survey was determined as 0.92. This survey measures the career interest in the fields of Science, Technology, Engineering and Mathematics.
2.3. Analysis of Data
SPSS package program was used to analyses the data obtained from research. Simple regression analyses were made by using simple linear correlation which is one of the predictive statistical analyses.
3. Conclusions
Histogram graphic was prepared in SPST are given in Figure 1.
Figure 1. Distribution of fields of students’ SPST
When Figure 1 is examined, the average of the students' scores from SPST over 36 points is 12.87. According to this finding, it can be said that the students' scientific process skills are low.
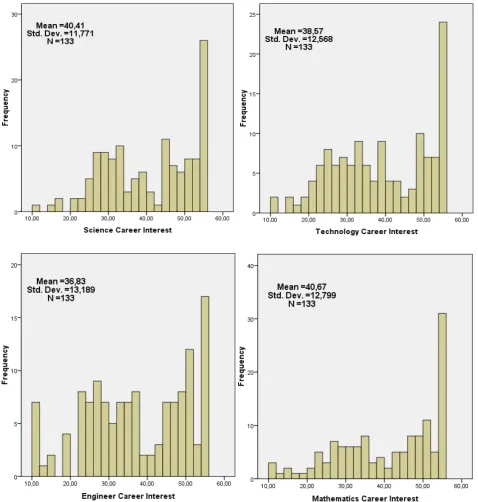
Figure 2. Distribution of fields of students’ STEM career interest When Figure 1 is examined, it is seen that there is an
accumulation between 45-55 regarding students’ interest in the field of Science and this accumulation is 55 in the field of Mathematics. Furthermore it can be said that the maximum accumulation between 10-40 averages occurs in the fields of Technology and Engineering. It can be said that career interest of students in Science and Mathematics
is higher than their interest in Engineering and Mathematics.
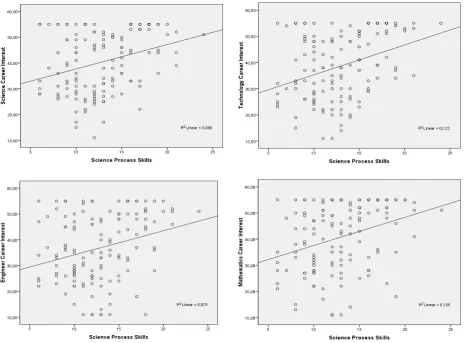
Figure 3. Scatter plot between SPST and STEM-CIS
[image:4.595.69.538.357.700.2]Table 1. Simple regression analysis results of marks scored in STEM-CIS and in SPST
Fields of Career
Interest Variable B R R
2 t P
Science Constant 28.226 8.261 0.000 SPST 0.946 0.309 0.096 3.719 0.000
Technology Constant 23.885 6.645 0.000 SPST 1.141 0.349 0.122 4.261 0.000
Engineering Constant 9.605 6.395 0.000 SPST 0.017 0.273 0.075 3.250 0.001
Mathematics Constant 26.771 7.244 0.000 SPST 1.080 0.324 0.105 3.924 0.000 n= 133
Simple linear correlation analyses are made to determine whether there is a statistically meaningful relation between the marks students scored in career interest fields of Science and their marks scored from SPST factors or not. It is determined that there is a positive and meaningful relation between career interest fields in Science and skills of “Identifying and Stating Hypotheses” and “Graphing and Interpreting Data” (Science-Identifying and Stating Hypotheses: Pearson r= 0.195, p=0.024; Science- Graphing and Interpreting Data: Pearson r= 0.306, p=0.000). In accordance with Pearson correlation co-efficient, there is a low-level relation between career interests in Science and “Hypothesizing and Defining” skill, while there is a medium-level relation between career interests in Science and “Graphing and Interpreting Data” skill. A simple regression analysis is performed to determine to what extent the variance between SPST marks can explain the variance of marks they scored in fields of career interest in Science.
Table 2. Simple regression analysis results of marks scored in Science career interest and SPST
Variable B R R2 t P
Constant 35.363 14.557 0.000 Identifying and Stating
Hypotheses 1.586 0.195 0.038 2.280 0.024 Constant 33.745 16.414 0.000
Graphing and
Interpreting Data 2.795 0.306 0.094 3.681 0.000 n= 133
In accordance with the results of simple regression analysis shown in Table 2, it is determined that the marks scored from the skills of “Identifying and Stating Hypotheses” and “Graphing and Interpreting Data” is a meaningful predictor of marks scored in career interest fields in Science (Identifying and Stating Hypotheses: R=0.195, R2=0.038, F(1,132)=5.199, p=0.024; Graphing and Interpreting Data: R=0.306, R2=0.094, F(1,132)=13.547, p=0.000). It is determined that 3.8% of the variance of marks scored in career interest in Science is explained by the variance of marks scored in “Identifying and Stating Hypotheses” skill and 9.4% is explained by the variance of marks scored in “Graphing and Interpreting Data” skill.
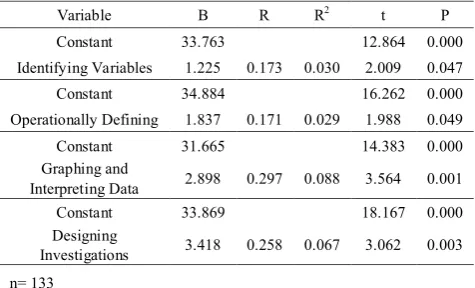
[image:5.595.303.541.374.518.2]Simple linear correlation analyses are made to determine whether there is a statistically meaningful relation between the marks students scored in Technology career interest and their marks scored from SPST factors or not. It is determined that there is a positive and meaningful relation between Technology career interest and skills of “Identifying Variables”, “Operationally Defining”, “Graphing and Interpreting Data” and “Designing Investigations” (Technology-Identifying Variables: Pearson r= 0.173, p=0.047; Technology-Operationally Defining: Pearson r= 0.171, p=0.049; Technology-Graphing and Interpreting Data: Pearson r= 0.297, p=0.001; Technology-Designing Investigations: Pearson r= 0.258, p=0.003). In accordance with Pearson correlation co-efficient there is a low-level relation between career interest in Technology and skills of “Identifying Variables”, “Operationally Defining”, “Graphing and Interpreting Data” and “Designing Investigations”. A simple regression analysis is performed to determine to what extent the variance between SPST marks can explain the variance of marks they scored in fields of career interest in Technology.
Table 3. Simple regression analysis results of marks scored in Technology career interest and in SPST
Variable B R R2 t P
Constant 33.763 12.864 0.000 Identifying Variables 1.225 0.173 0.030 2.009 0.047 Constant 34.884 16.262 0.000 Operationally Defining 1.837 0.171 0.029 1.988 0.049 Constant 31.665 14.383 0.000
Graphing and
Interpreting Data 2.898 0.297 0.088 3.564 0.001 Constant 33.869 18.167 0.000 Designing
Investigations 3.418 0.258 0.067 3.062 0.003 n= 133
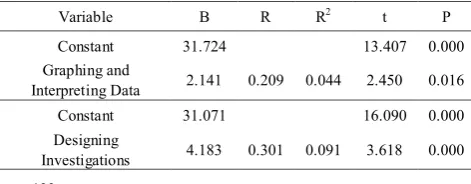
[image:5.595.56.292.506.591.2]Simple linear correlation analyses are made to determine whether there is a statistically meaningful relation between the marks students scored in Engineering career interest and their marks scored from SPST factors or not. It is determined that there is a positive and meaningful relation between Engineering career interest and skills of “Graphing and Interpreting Data” and “Designing Investigations” (Engineering-Graphing and Interpreting Data: Pearson r= 0.209, p=0.016; Engineering- Designing Investigations: Pearson r= 0.301, p=0.000). In accordance with Pearson correlation co-efficient there is a low-level relation between career interest in Engineering and skills of “Graphing and Interpreting Data” and a medium-level relation with “Designing Investigations”. A simple regression analysis is performed to determine to what extent the variance between SPST marks can explain the variance of marks they scored in fields of career interest in Engineering.
Table 4. Simple regression analysis results of marks scored in Engineering career interest and SPST
Variable B R R2 t P
Constant 31.724 13.407 0.000
Graphing and
Interpreting Data 2.141 0.209 0.044 2.450 0.016 Constant 31.071 16.090 0.000 Designing
Investigations 4.183 0.301 0.091 3.618 0.000 n= 133
In accordance with the results of simple regression analysis shown in Table 4, it is determined that the marks scored from the skills of “Graphing and Interpreting Data” and “Designing Investigations” is a meaningful predictor of marks scored in Engineering career interest (Graphing and Interpreting Data: R=0.209, R2=0.044, F(1,132)=6.002, p=0.016; Designing Investigations: R=0.301, R2=0.091, F(1,132)=13.090, p=0.000). It is determined that 4.4% of the variance of marks scored in career interest in Engineering is explained by the variance of marks scored in “Graphing and Interpreting Data” skill, 9.1% is explained by the variance of marks scored in “Designing Investigations”.
Simple linear correlation analyses are made to determine whether there is a statistically meaningful relation between the marks students scored in career interest fields of Mathematics and their marks scored from SPST factors or not. It is determined that there is a positive and meaningful relation between career interest fields in Mathematics and skills of “Identifying and Stating Hypotheses”, “Graphing and Interpreting Data” and “Designing Investigations” (Mathematics-Identifying and Stating Hypotheses: Pearson r= 0.180, p=0.038; Mathematics-Graphing and Interpreting Data: Pearson r= 0.341, p=0.000; Mathematics-Designing Investigations: Pearson r= 0.261, p=0.002). In accordance with Pearson correlation co-efficient there is a low-level relation between career interest in Mathematics and skills of “Identifying and Stating Hypotheses” and “Designing
[image:6.595.55.291.326.418.2]Investigations” and a medium-level relation with “Graphing and Interpreting Data” skill. A simple regression analysis is performed to determine to what extent the variance between SPST marks can explain the variance of marks they scored in fields of career interest in Mathematics.
Table 5. Simple regression analysis results of marks scored in career interest fields in Mathematics and in SPST
Variable B R R2 t P
Constant 35.607 13.441 0.000 Identifying and Stating
Hypotheses 1.592 0.180 0.033 2.099 0.038 Constant 32.601 14.768 0.000
Graphing and
Interpreting Data 3.385 0.341 0.116 4.152 0.000 Constant 35.757 18.868 0.000 Designing
Investigations 3.570 0.265 0.070 3.146 0.002 n= 133
In accordance with the results of simple linear regression analysis shown in Table 5, it is determined that the marks scored from the skills of “Identifying and Stating Hypotheses”, “Graphing and Interpreting Data” and “Designing Investigations” is a meaningful predictor of marks scored in career interest fields in Mathematics (Identifying and Stating Hypotheses: R=0.180, R2=0.033, F(1,132)=4.405, p=0.038; Graphing and Interpreting Data: R=0.341, R2=0.116, F(1,132)=17,240, p=0.000; Designing Investigations: R=0.265, R2=0.070, F(1,132)=9.899, p=0.002). It is determined that 3.3% of the variance of marks scored in career interest in Mathematics is explained by the variance of marks scored in “Identifying and Stating Hypotheses” skill; 11.6% is explained by the variance of
marks scored in “Graphing and Interpreting Data” and 7%
is explained by the variance of marks scored in “Designing Investigations”.
4. Conclusions and Discussion
STEM career interests and science process skills of students play important roles regarding their choices of profession [22, 23]. If students were aware of their interest and gain the required skills, they could choose professions which are suitable for them. In the study conducted in this direction, relations between the career interest of students in fields of STEM and their science process skills are explored.
25]. It was stated in researches that it was lack of Engineering courses in curriculums, interest and knowledge of female students about Engineering [24, 25, 26, 27, 28]. Utilization of science process skills or applications is not limited with science only and appropriately utilizing these skills would provide advantages for students in all academic fields. Therefore a quality science education encouraged by NGSS and characterized by supporting Science and Engineering applications within the context of being informed about great ideas in science has a vital importance for academic development of students [26]. Therefore the career interests of students in Engineering and Technology should be improved. Within the scope of improvement studies, activities and applications to develop their skills necessary for 21st century and their science process skills should be conducted for students via STEM education. Because a student who develops his/her interest and ability in different fields would have the opportunity to improve himself/herself better.
Science process skills have been separated as basic and unified skills or basic, causative and experimental skills from past to present [29, 30, 31]. In education, while basic skills are thought from 1st to 5th grades, causative and experimental skills are gained from 5th to 8th grades along with basic skills. Basic, causative and experimental skills are at the centre of skills needed in 21st century [26, 32]. Therefore at least Science process skill levels of students should be determined prior STEM applications and if there are any shortcomings, they should be eliminated. Applying STEM education after these steps would help students for gain to the skills of 21st century.
Literature researches have come to the conclusion that students cannot fully acquire scientific process skills [33, 34]. This is supported by findings from SPST in this study. In accordance with findings obtained via STEM-CIS and SPST scales, it was determined that there are medium or low-level relations between STEM career interest and science process skills. It was observed that there are medium-level relations between career interest of Science, Technology and Mathematics and science process skills. The relation between career interest of Engineering and science process skills was rather low. It was determined that there are relations between the skill of “Graphing and Interpreting Data” and Science, Technology, Engineering and Mathematics; between the skill of “Designing Investigations” and Technology, Engineering and Mathematics; between the skill of “Identifying and Stating Hypotheses” and Science and Mathematics; between the skills of “Identifying Variables” and “Operationally Defining” and Technology. When these relations were examined, it was possible to say that there was a connection between Science process skills and STEM career interest. If Science process skills of students are improved, their career interests in Science, Technology, Engineering and Mathematics would also improve. There
were researches stating that science process skills and career interests of students could be improved via STEM and similar applications [17, 35, 36, 27, 37, 38, 8]. Applications improving career interests and Science process skills of students could be performed.
This research is a preliminary study exploring the relations between STEM career interest and Science process skills. SPST deals with only five Science process skills. It should comparison other science process skills not included in this study with STEM career interests that it will contribute obtaining more results in this field. Moreover, performing STEM applications by benefiting from science process skills more would contribute better to the development of students. It could be thought that arranging education and training environment in accordance with obtained data would make it possible to utilize STEM applications better and enable students to gain skills. A generation that grows in the interests and skills and can be a profession is extremely useful in the future.
Note
A part of this study is presented as verbal announcement in the 4th International Conference on Social Sciences and Education Research.
REFERENCES
[1] J. Dewey. Human nature and conduct: An introduction to social psychology. The Modern Library, New York, 1922. [2] S. Michaels, A. W. Shouse, H. A. Schweingruber. Ready, set
science! Putting research to work in K-8 science classrooms. The National Academies Press, Washington, DC, 2008. [3] S. Çepni, A. Ayas, D. Johnson, M. F. Turgut. Fizik
Öğretimi. Milli Eğitimi Geliştirme Projesi Hizmet Öncesi Öğretmen Eğitimi Deneme Basımı, Ankara, 1996.
[4] S. Aslan, H. E. Kılıç, D. Kılıç. Bilimsel süreç becerileri, Pegem Atıf İndeksi, 2016.
[5] K. Ostlund. Science Process Skills: Assessing Hands-On Student Performance. Addison-Wesley Publishing Company; Menlo Park, CA, 1992.
[6] N. Rustaman, Dkk. Strategi Belajar Mengajar Biologi. Bandung: FPMIPA-UPI, 2003.
[7] B. Yıldırım, Y. Altun. Investigating the Effect of STEM Education and Engineering Applications on Science Laboratory Lectures. El-Cezerî Journal of Science and Engineering, Vol. 2, No. 2, 28-40, 2015.
[8] M. G. Strong. Developing elementary math and science
process skills through Engineering design instruction. Hofstra University. 2013.
[9] E. Bozkurt-Altan, H. Yamak, E. Buluş-Kırıkkaya. A
Design Based Science Education. Journal Educational Faculty of Trakya University, Vol. 6, No. 2, 212-232, 2016. [10]T. Kelley. Staking the claim for the ‘T’ in STEM. The
Journal of Technology Studies, Vol. 36, No. 1, 2-9, 2010. [11]S. Ceylan. A study for preparing an instructional design
based on science, technology, Engineering and mathematics (STEM) approach on the topic of acids and bases at secondary school science course. Unpublished Master’s
Thesis, Uludağ University, Institute of Educational Sciences, Bursa, 2014.
[12]M. K. Daugherty. The prospect of an “A” in STEM education. Journal of STEM Education, Vol. 14, No. 2, 10-15, 2013.
[13]J. Morrison. Attributes of STEM education: The student, the school, the classroom, 2006. [Monograph]. Baltimore, MD: Teaching Institute for Excellence in STEM. Web: http://www.psea.org/uploadedFiles/TeachingandLearning/C areer_and_TechnicalEducation/Attributes%20of%20STEM %20Education%20with%20Cover%202 %20.pdf
[14]K. H. Tseng, C. C. Chang, Ş. J. Lou, & W. P. Chen. Attitudes
towards science, technology, Engineering and mathematics (STEM) in a project-based learning (PjBL) environment. International Journal Technology Design Education, Vol. 23, 87-102, 2013.
[15]T. A. Franz-Odendaal, K. Blotnicky, F. French & P. Joy.
Experiences and perceptions of STEM subjects, careers, and engagement in STEM activities among middle school students in the maritime provinces. Canadian Journal of Science, Mathematics and Technology Education, Vol. 16, No. 2, 153-168, 2016.
[16]R. Christensen & G. Knezek. Relationship of Middle School
Student STEM Interest to Career Intent. Journal of Education in Science, Environment and Health, Vol. 3, No. 1, 1-13, 2017.
[17]A. Cotabish, D. Dailey, A. Robinson, & G. Hughes. The effects of a STEM ıntervention on elementary students'
science knowledge and skills. School Science and Mathematics. Vol. 113, No. 5, 215-226, 2013.
[18]H. Yamak, N. Bulut, & S. Dündar. Effect of FeTeMM activities to 5th Grade Learners’ Scientific Process Skills
and Their Attitude towards Science. Gazi Education Faculty
Magazine, Vol. 34, No. 2, 249-265, 2014.
[19]N. Karasar, (2014). Bilimsel Araştırma Yöntemi [Scientific Research Method], Nobel Publishing, Ankara.
[20]A. Yıldırım. Effect of guided inquiry experiments on the
acquisition of science process skills, achievement and differentiation of conceptual structure. Unpublished Master’s Thesis, Middle East Technical University The
Graduate School of Natural And Applied Sciences, 2012.
[21]K. Bilen, A. Ergün, and Z. Irkıçatal. The Study of Turkish
Adaptation STEM Career Interest Survey International Conference on Education in Mathematics, Science and Technology, 2015.
[22]L. N. Calkins & A. Welki. Factors that influence choice of
major: Why some students never consider economics. International Journal of Social Economics, Vol. 33, No. 8, 547-564, 2006.
[23]W. L. Kuechler, A. McLeod, & M. G. Simkin. Why don’t
more students major in IS? Decision Sciences Journal of Innovative Education, Vol. 7, No. 2, 463-488, 2009. [24]J. D. Basham & M. T. Marino. Understanding STEM
education and supporting students through universal design for learning. Teaching Exceptional Children, Vol. 45, No. 4, 8-15, 2013.
[25]R. W. Bybee. Advancing STEM education: A 2020 vision. Technology and Engineering Teacher, Vol. 70, No. 1, 30-35, 2010.
[26]D. I. Aaron. STEM Is Elementary: Challenges Faced by
Elementary Teachers in the Era of the Next Generation
Science Standards, The Educational Forum, Vol. 81, No. 1, 83-91, 2017.
[27]M. K. Al Salami, C. J. Makela, & M. A. de Mirand.
Assessing changes in teachers’ attitudes toward interdisciplinary STEM teaching. International Journal of Technology and Design Education, 1-26, 2015.
[28]K. Weber. Role models and informal STEM-related activities positively impact female interest in STEM. Technology and Engineering Teacher, Vol. 71, No. 3, 18-22, 2011.
[29]M. Padilla. The science process skills. Research Matters to the Science Teacher, 1990. [No. 9004]. Retrieved from http://www.narst.org/publications/research/skill.cfm [30]M. Padilla. Inquiry, process skills, and thinking in science.
Science & Children, Vol. 48, No. 2, 8–9, 2010.
[31]YÖK/Dünya Bakası. Milli eğitim geliştirme projesi; öğretmen eğitimi dizisi. İlköğretim Fen Öğretimi, Ankara.
1997.
[32]National Research Council. A framework for K–12 science education: Practices, crosscutting concepts, and core ideas. DC: The National Academies Press, Washington, 2012. [33]F. Zorlu, Y. Zorlu, and F. Sezek. Examining secondary
school students’ scientific process skills in terms of some variables, Procedia-Social and Behavioral Sciences, Vol. 106, 1181-1189, 2013.
[34]F. Sezek, Y. Zorlu, & F. Zorlu. Examination of The Factors
Influencing The Scientific Process Skills of The Students in The Elementary Education Department. Journal of Erzincan Universtiy Education Faculty, Vol. 17, No.1, 197-217, 2015. [35]S. Jeong, and H. Kim. The effect of a climate change
monitoring program on students’ knowledge and perceptions of STEAM education in Korea. Eurasia Journal
of Mathematics, Science & Technology Education, Vol. 11, No. 6, 1321-1338, 2014.
[36]J. E. Jon and H. I. Chung. Consultant report securing Australia’s future STEM: Country comparisons-STEM Report Republic of Korea, 2013.
http://www.acola.org.au/PDF/SAF02Consultants/Consultan t%20Report%20-%20Korea.pdf.
[37]A. Şahin, M. C. Ayar, and T. Adıgüzel. STEM Related
After-School Program Activities and Associated Outcomes
on Student Learning. Educational Sciences: Theory &
Practice, Vol. 14, No. 1, 297-322, 2014.
[38]H. Yamak, N. Bulut, and S. Dündar. The Impact of STEM
Activities on 5th Grade Students’ Scientific Process Skills